International Competitiveness in the Telecommunications and ICT Sectors: A Cross-Country Comparison
38
0
0
Texte intégral
(2) Adresse postale CIRST Université du Québec à Montréal C.P. 8888, Succursale Centre-ville Montréal (Québec) Canada, H3C 3P8. Adresse civique CIRST Université du Québec à Montréal Pavillon Thérèse-Casgrain, 3e étage 455, boul. René-Lévesque Est, Bureau W-3042 Montréal (Québec) Canada H2L 4Y2. Pour nous joindre Téléphone : (514) 987-4018 Télécopieur : (514) 987-7726 Courrier électronique : cirst@uqam.ca Site Internet : www.cirst.uqam.ca. Conception graphique : Marie-Andrée Desgagnés ISBN-13 978-2-923333-26-7 Dépôt légal - Bibliothèque et Archives nationales du Québec, 2006 Dépôt légal - Bibliothèque et Archives Canada, 2006.
(3) TABLE OF CONTENTS Abstract......................................................................................................................................................................... 1 Introduction.................................................................................................................................................................. 1 ICTs, Productivity and economic growth in the Arab world ................................................................................... 2 Factors contributing to productivity enhancement ................................................................................................... 3 Contribution of S&T to productivity in Arab countries............................................................................................. 5 The ICT and telecommunications market in the Arab countries and in the world ............................................... 6 The Arab ICT market................................................................................................................................................ 10 The state of the networked economy of Arab and benchmarked countries.......................................................... 12 FDI in the ICT and telecommunication sectors in Arab countries ........................................................................ 19 Concentration of FDI in the Arab world................................................................................................................. 19 Policies to promote ICT development in Arab countries........................................................................................ 26 What it takes for successful ICTs ............................................................................................................................. 28 Summary and conclusions......................................................................................................................................... 30 References................................................................................................................................................................... 31. i.
(4)
(5) International Competitiveness in the Telecommunications and ICT Sectors: A Cross-Country Comparison. Abstract The ICTs and telecommunications contribute significantly to a country's economic growth and development. The use of the internet and other information technologies, once at the hands of the private firms and governments of developed economies, is starting to get into the top priorities of some developing economies. Developing countries in the Arab world lack the means and necessary resources to develop the new technologies. Nonetheless, some exceptions exist and there are signs of regional leadership among some Arab countries. Globally, however, the dominance of the developed world in ICT and telecom is not likely to change dramatically in the coming years. Even so, developing countries may have a possible role in making policy and business decisions in the future. Despite the progress realized by many Arab countries lately, especially in the ICT area, their performance is lacking compared to other developing countries in South East Asia and Eastern Europe. Arab countries spend much less on ICTs than other countries. At current investment levels, it will take almost 20 years for the Arab countries to double their ICT infrastructure, while the industrialized countries can achieve the same performance in just eight years. _______________ JEL: L80, K10, 033. Introduction Information and communication technologies (ICTs)1 have been used widely around the world with increasing beneficial effects on productivity and economic growth. ICT infrastructure availability in a country and its rate of investment play a crucial role in the formation of the global knowledge-based economy (KBE). The most widely used indicators of infrastructure are fixed and mobile telephone densities, rate of access to personal computers and Internet penetration. Also, issues of quality of infrastructure and of services must be addressed when a comprehensive evaluation is made of a country's preparedness and its connectivity capacity. Indeed, the digital access index (DAI) recently developed by the International Telecommunications Union (ITU) takes into account a number of new variables such as education and affordability to access the IT infrastructure (ITU, 2003). ICTs play a significant role in the economy because of their pervasiveness and the spillover effects to other industries. This is why they are considered to be “enablers” to other dependent industries (like manufacturing, trade, tourism, transportation, education, and financial services) and as such they contribute to growth and development. The use of ICTs in the production process allows other industries to increase their productivity and to offer better quality products and services at lower cost to consumers. Further, innovation is facilitated when new and existing firms find ways to apply and use the ICTs. In that sense, ICTs contribute to the creation of new businesses while they can help existing firms to expand in new markets. Trade, entrepreneurship and technological knowledge are thus stimulated and all of them create a more dynamic economic and business environment. Better quality workforce is required by the knowledge-based firms. The more educated workers and ICT trainees are, the better their positioning in taking advantage of the new opportunities created by ICTs. Employment and social inclusion are thus enhanced. For all of the above, developing a strong ICT sector has become a top priority for many industrialized and developing economies. In an attempt to leapfrog into the future, increasing amounts of GDP are spent on ICTs around the world (8.3% in North America, 8% in Europe, 6.7% in Latin America and a mere 4% in the Arab world). A relatively low level of investment in ICTs results in marginal improvements of the sector and, because of limited spillover effects, in insignificant improvements of the rest of the economy. At current investment levels, it will take only eight years for the industrialized countries to double their ICT infrastructure, while it will take almost 20 years for the Arab countries. Statistical evidence shows that Arab countries lag behind world averages on every ICT indicator, with the notable exception of the United Arab Emirates (UAE) which exceed world averages in a number of connectivity indicators. 1. The Information and Communication Technologies (ICT) industry encompasses computer software engineering, multi-media production, computer hardware and peripherals manufacturing, telecommunications, website development, computer and internet services, product distribution and servicing and education, training and research. CIRST – Note de recherche 2007-02 | page 1.
(6) Anastassios Gentzoglanis Such gross measures of performance hide necessarily stark individual country differences. Indeed, the picture is much better if we examine each Arab country separately, and not as a group. There is number of Arab countries (UAE, Egypt, Jordan, and Tunisia) that have embarked in sector reforms and developed laudable initiatives to boost activity in the ICT sector. Starting from their telecommunications sector, they have gone through a number of structural changes by introducing competition in the mobile telecom (competition in the fixed line segment of the market was not as successful as in the mobile) and data/internet markets and made a number of other more or less significant changes in some other sectors of the economy. Their awareness of the importance of ICTs to growth and economic and social development led some Arab countries to initiate programmes and ICT policies to promote the development of this sector. Nonetheless, many of these initiatives remain unexploited and they need a further refinement and development of a comprehensive ICT strategy and a sound regional ICT policy. Despite the notable progress in the telecommunications sector, policies such as local loop unbundling, access charges for mobile, fixed-line and especially internet dial-up rates should be addressed urgently should usage of ICTs in the Arab world be increased at the targeted levels. The governments in the Arab countries have a role to play in creating an environment that satisfies the exigencies for ICT growth. Facilitating the development of ICT sector through sound policies and regulations, supporting the development of ICT infrastructure through public and private domestic and foreign (FDI) investments and encouraging the use of ICTs by using subsidies and tax incentives, are some of the policy tools that may be used by Arab countries to achieve their goals in terms of ICT objectives. This paper examines the state of the ICT industry and policies initiated by Arab countries to contribute to the development of the sector and facilitate the economic and social inclusion of their citizens. Strengths and weaknesses are highlighted and the Arab competitiveness performance with respect to ICTs is compared to the performance of a number of developing and developed countries that, not long time ago, were at low levels of development but they managed, through sound policies and initiatives, to leapfrog into the group of advanced economies. The examples of success of the benchmark countries are illustrative and serve to draw policy recommendations for the Arab countries.. ICTs, Productivity and economic growth in the Arab world Productivity has been rising in many developed economies at rates that have not been seen since mid 80s. In the USA output per hour has been increasing at an average rate of 3% per annum since 1995. This has got by surprise many economists and business specialists because the USA is, after all, the most technologically advanced economy. For years, productivity in the USA was declining steadily (from mid 70s to mid 80s) with a small increase afterwards and a further decline in the early and mid 90s. The Solow paradox – the observation that computers are ubiquitous but in productivity statistics – was almost generally accepted by pundits and doubts were cast over the potential of ICTs on increasing productivity and growth. With the sharp increase in productivity during the last decade, the Solow paradox seemed to have ended and new interest has surged in examining the relationship between ICTS and the rise in productivity. Technological innovation and globalization has made early adopters of ICTs more dynamic and flexible and has expanded the possibilities for new markets and new organizational changes. Economies became more open and this required a better skilled workforce and more emphasis on policies that foster the creation of knowledge and new programmes in education. Policies that give incentives to firms and especially to small and medium sized enterprises (SMEs) to adopt the ICTs were multiplied (USA, EU, Canada, Costa Rica, etc.,) lately on the belief that SMEs are more flexible and therefore better equipped to confront the newly created intense competitive environment. In many developed economies, deregulation and privatization created new market conditions and this has led to overcapacity. This resulted in an across the board decrease in prices and in inflation and in the decline in profits for many dot-com companies. This is particularly true because ICTs have decreased the entry barriers in many business activities. Excess Page 2 | CIRST – Note de recherche 2007-02.
(7) International Competitiveness in the Telecommunications and ICT Sectors: A Cross-Country Comparison capacity and easy entry led to well known bankruptcies (Worldcom, Enron, Global Crossing, etc.,), despite the increases in productivity. Figure 1 Productivity growth in the USA, 1970-2005. Source : http://www.dallasfed.org/research/swe/2005/swe0501c.pdf. In the USA, productivity growth, as reported by the Bureau of Labour Statistics (2005), surged to almost 4% in 2005. This is mainly attributed to the ICTs. The use of ICTs alone does not guarantee increases in productivity. Firms that achieve high gains in productivity tend to combine investments in hardware and software with organisational changes. The latter may be expressed as the organisation of autonomous work groups, the introduction of team work and shift in responsibility to lower levels of hierarchy. Experiments in some developed economies (Germany, for instance) showed that the increase of employee participation in all levels of the production process is a strategy that brings benefits to the firm and the society in general2.. Factors contributing to productivity enhancement The importance of ICTs in organizational change suggests that governments could have a role to play in both the provision of a high quality ICTs infrastructure and in the dissemination of information based on the benefits and costs of such initiatives. This is particular important for SMEs and the businesses operating in low skill intensive industries such as textiles, leather and clothing, food and beverages, and woodwork which appear to be slow adopters of e-business practices. This is pertinent to some Arab countries, especially Egypt and the group of Maghreb countries. Although it may be extremely difficult or nearly impossible to enhance global competitiveness, in a very short period of time, nonetheless, in the long term, some Arab countries may exploit their comparative advantage and introduce policies that take into account their specificities and identify factors that contribute to a strong productivity performance at a regional level. Experience showed that the factors below are contributing factors to productivity gains: 2. For the representative sample of German business, the introduction of these measures increased average productivity by 8% in the 1999-2001 periods. CIRST – Note de recherche 2007-02 | page 3.
(8) Anastassios Gentzoglanis • • • • •. good transport and telecommunication links high-tech clusters that encourage networking common vision among regional stakeholders a business culture that favours industry-science relations government policies that promote the region. As productivity surges, new questions arise about its sources and its consequences. Does a mere investment in ICTs lead to more productivity or the latter is related to a firm's corporate culture, organizational practices and institutional setting? Which corporate culture is more conducive to the realization of productivity gains? These are important theoretical questions to be answered before a comprehensive policy agenda is formulated. Firms in developing countries function in an entirely different business and institutional environment than in developed economies. Ambiguity over property rights, inadequate and/or inexistent or archaic competition and business laws, bureaucracy, corruption and red tape are all factors that influence negatively the adoption of ICTs. Firms in these countries cannot fully reap the benefits of innovations and organizational changes. SMEs and large firms alike and especially multinationals have difficulties in surfing into that environment. If the relationship between ICTs and productivity were simple, it could have been possible to merely invest in ICTs and leap-frog in productivity and exports. Developing countries, could then easily elaborate growth policies that enhance productivity and economic growth. Brynjolfsson (2005) argues that productivity depends on both ICTs and organizational capital. Indeed, it is argued that the direct cost to a firm adopting an ICT is around 10% to 20% of total ICT cost. The rest encompasses costs associated with the organization of work after ICTs have been introduced to the company. The organization of processes, the strategies to manage risk, and the approaches to integrate knowledge and new ideas are important costs that must be managed by the digital firm appropriately. It is further argued that ICTs are indeed the technologies that can bring significant enhancements in many aspects of business and social activities. The widespread use of ICTs has significantly simplified the supply chain management (SCM) of most businesses, has allowed firms to get a better insight of customers and develop better customer relations management (CRM) strategies, has permitted firms to offer customized goods and services and has transformed the production chain from mass production to mass customization. This has opened up new business opportunities and created possibilities for containment of costs and increase in business performance. Firms able to take advantage of productivity enhancements by adopting early and efficiently the ICTs have gotten a leg up on the competition. For sure, the first-mover advantage is not always a better strategy especially when the new technologies are changing constantly and become ever cheaper to use and more user-friendly. As technology matures, it is increasingly argued by many that the ICTs have become just another commodity and as such it is necessary for a firm to possess them as an input to compete but its mere possession is not enough to ensure a competitive advantage.. Page 4 | CIRST – Note de recherche 2007-02.
(9) International Competitiveness in the Telecommunications and ICT Sectors: A Cross-Country Comparison. Contribution of S&T to productivity in Arab countries Developing countries, and particularly Arab countries, cannot do without the ICTs. If the latter are indeed just another commodity their mere adoption is insufficient to provide the advantage they expect to have in order to be able to compete locally and internationally. Despite the widespread recognition that ICTs are increasingly becoming an essential part of a business strategy and competitive advantage, the deployment of ICTs in an organization require investments in venture and human capital. Venture capital is scarce in developing countries and especially in Arab countries, and human capital is even scarcer. The brain-drain that inflicts many developing countries has important repercussions on economic development of less favoured economies. Serious brain-drain is facing Jordan and Egypt. Well-trained ICT professionals once got the working experience in their home country seek better paid work in the Gulf region. Human and venture capital and a sound science and technology (S&T) policy are essential for economic development. Many East Asian countries were at the same level of development as they are many Arab countries now. But East Asian countries adopted, in a short period of time, a number of policies that permitted their development at an astonishingly fast rate. As a matter of fact, they adopted the following principles and practices: • Adoption of economic development programs with special emphasis on science and technology and the creation of national champions. • Adoption of strategies and policies aiming at both developing a qualified base of scientists and at building the necessary human and capital infrastructure necessary for economic development • Creation of a mentality for collaboration between industry, academia and research and development institutes and centres with particular emphasis on finding practical solutions of specific technological problems. • Adoption of policies aiming at promoting R&D programs through grants and subsidies and the participation of the private sector. • Adoption of policies and programs to enhance the development of small and medium-sized firms. The best example of the adoption of these policies is South Korea. In the 1960s, Korea was spending 2/10ths of 1% of its GDP on S&T, approximately the same amount spend today by Middle-East countries. Nowadays, Korea spends around 2.6% of GDP on S&T and has a viable and highly competitive high-tech industry. Some Arab countries have recognized the importance of S&T and of the ICTs industry and adopted various policies and approaches. Saudi Arabia, for example, established as early as in 1977 the King Abdulaziz City for Science & Technology (S&T) as the starting point of its R&D policy. Its main objectives were to encourage basic scientific and applied research, coordinate the activities of research centres, and cooperate with the concerned agencies to define the national priorities and policies in the field of science and technology. The city supports a variety of researchers and research projects and sets priorities as to the establishment3 of research institutes and collaborates with other research institutes and universities. S&T plays a vital role in a country’s economic development, and industry, government and academia share the responsibility for supporting the investment, development, use and commercialisation of its activities. A number of indices are used to measure a country's relative strength in the field of S&T. The number of a country's scientific publications and citations worldwide are two widely used indexes of relative strength. During the period 1997-2001, the USA and the EU15 accounted for 72% and 90% of 3. The city established the Research Institute of Oil and Petrochemical Industries, and the Institute of Energy Research. CIRST – Note de recherche 2007-02 | page 5.
(10) Anastassios Gentzoglanis world publications and citations respectively. Only few developing countries had a share in both measures as it is indicated in the table below. Arab countries' relative share is insignificant, by world standards.. Country USA EU15 UK Germany Japan France. Table 1 Relative global strength in S&T, 1997-2001 %share of world publications %share of world citations 34.9 Declining 49.4 Declining 37.1 rising 39.3 Rising 9.4 Rising 11.4 Rising 8.8 Rising 10.0 Rising 9.3 Rising 8.4 Rising 6.4 Rising 6.9 Rising. Canada Italy China India South Africa Iran. 4.6 4.1 3.2 2.1 0.5 0.13. Declining Rising Rising Declining Rising Rising. 5.3 4.4 1.6 0.9 0.3 0.06. Declining Rising Rising Rising Rising Rising Rising. Ranking 1 2 3 4 5 6 7 19 22 29 30. Source: King, D.A., 2004. Indeed, Arab countries as a whole have some of the lowest levels of research funding in the world, investing a mere 0.4% of GDP in R&D. Most of the funding comes from government sources while the private sector invests less than one percent of total R&D expenditure in the Arab world. Therefore, Arab countries lag behind in technology creation and diffusion4 of new technologies. Such a performance in the S&T sector may explain why most Arab countries trail behind most benchmarked economies in the ICT sector. Technology transfer through FDI can benefit the Arab countries as the Malaysian experience has shown. But technology transfer without creative contribution from domestic resources will only result in technological dependence. Channelling a larger share of GDP into education producing a better quality workforce with the capacity to learn and adapt the ICTs will enhance the Arab competitiveness.. The ICT and telecommunications market in the Arab countries and in the world The demand for ICT is affected by a number of macroeconomic factors, such as GDP growth, personal consumption spending, investment spending, government spending, population and employment. The contribution of each factor to ICT demand for the period 1999-03 and 2003-07 is indicated in the table below for each geographic region and in total.. 4. Technology creation is measured by patents granted to residents and diffusion by the share of high- and mediumtechnology exports in total goods exports). Page 6 | CIRST – Note de recherche 2007-02.
(11) International Competitiveness in the Telecommunications and ICT Sectors: A Cross-Country Comparison Table 2 Macroeconomic factors affecting ICT spending Americas. Asia- EMEA Pacific (Europe/Middle East/Africa). Global total. Americas Asia- EMEA Pacific. % growth 1999-2003. Global total. % growth 2003-2007 (forecast). GDP growth. 3.8%. 2.7%. 6.0%. 4.3%. 5.8%. 9.0%. 8.4%. 7.6%. Personal consumption. 4.6. 2.2. 5.9. 4.5. 5.4. 9.3. 8.3. 7.3. Investment. 1.9. 3.1. 4.4. 3.1. 6.7. 8.4. 9.7. 8.3. Government spending. 5.5. 5.5. 7.0. 6.1. 4.6. 8.0. 7.8. 6.8. Population. 1.3. 1.2. 0.6. 1.1. 1.2. 1.1. 0.5. 1.0. Employment 1.0 1.1 0.9 1.0 1.9 1.3 0.9 Source: http://www.witsa.org/digitalplanet/DP2004-Summary.pdf, and author’s calculations. 1.3. The information technology (IT) spending per employee (table 3) varies widely across sectors and countries. Worldwide, the finance industry is the one that spends the most per employee (around $8,000.00 in 2002) while at the other extreme is the construction industry which spends the least (around $100 in 2002). Despite the high rates of spending in some industries, the potential is still enormous and the applications of the IT are increasing at an accelerating rate in almost every sector of the economy. Table 3 Information technology (IT) spending per employee, worldwide, 2002, $'000 Sector ICT spending per employee, worldwide, 2002, $'000 8.00 Finance 2.75 Utilities 1.75 Communication 1.25 Transport 1.15 Government 1.00 Manufacturing 0.49 Retail/Wholesale 0.48 Health care 0.25 Services 0.25 Education 0.10 Construction 0.05 Resource industries Source: IDC, 2004. Table 4 indicates the global ICT spending by market segment and ICT’s potential growth as forecast for the period 2003-2007 by World Information Technology and Services Alliance (2004). The expected growth rates of ICT spending over the years 2003-07 indicate that the manufacturing segment is a less intensive user of ICT relative to finance and government.. CIRST – Note de recherche 2007-02 | page 7.
(12) Anastassios Gentzoglanis Table 4 ICT spending by Market Segment ($US Billions, Percent Growth) Year Market segment 2003 % growth 1999-2003 % growth 2003-07 Consumer 21,724 4.5% 7.3% Manufacturing 18,280 2.6 7.0 Finance, Business 13,046 4.9 8.5 Trade 8,160 3.1 5.6 Government 6,184 6.1 6.8 Transport, Comm. 4,424 4.6 6.9 Services 4,320 4.0 10.2 Construction 4,124 5.4 7.4 Agriculture 1,962 1.0 3.9 Utilities 1,605 5.4 3.8 Mining 1,131 8.4 4.0 Source: http://www.witsa.org/digitalplanet/DP2004-Summary.pdf. Given that the financial sector is relatively less important than the manufacturing in most Arab economies, with the exception of the Arabian Gulf region, the ICT market will necessarily be limited unless Arab countries target export markets. It is important to note, however, that the financial sector and especially the banks in the GCC (Gulf Cooperation Council) countries are quite aggressive in adopting the IT and expanding infrastructure. By the end of 2003, they have spent over $1US billion, which, compared to IT spending of other developing countries, is substantial. Acquiring the latest banking technologies will continue to be a priority for the GCC financial industry and, therefore, demand for IT equipment and services will continue to grow in that region. Additionally, the e-readiness projects of many Arab countries will further boost demand for ICTs. Globally, however, if we compare the spending spree of various regions, it becomes clear that Middle East countries had the third slowest ICT growth rate during the period 1999-2003 and the same performance is expected for the years 2003-2007 (Table 5). Table 5 ICT growth during the periods 1999-2003 and 2003-2007 (%). Source: http://www.witsa.org/digitalplanet/DP2004-Summary.pdf. Page 8 | CIRST – Note de recherche 2007-02.
(13) International Competitiveness in the Telecommunications and ICT Sectors: A Cross-Country Comparison On a global basis, spending on IT is expected to be high given that global economic growth remains robust during the next two years5, as forecast by WITSA, 2004. The figure below (table 6) shows that ICT spending reached its trough in 2001 with $2.1 trillion U.S. dollars. It is expected to increase to over $3.2 trillion in 20076. Table 6 Global ICT spending ($US billions). Source: http://www.witsa.org/digitalplanet/DP2004-Summary.pdf. Table 7 Total ICT spending and per market segment, 1999-2007 ($US billions). Source: http://www.witsa.org/digitalplanet/DP2004-Summary.pdf. 5. This prediction is based on barring any unexpected shocks that may disrupt the current economic upturn. There are stark differences across countries and across sectors in the use of IT. For instance, in Britain, 98% of general practitioners use computers in their offices while in the USA, 95% of them still use pen and paper. 6. CIRST – Note de recherche 2007-02 | page 9.
(14) Anastassios Gentzoglanis Information-intensive industries invest ever increasing sums in ICTs. It is estimated that ICTintensive industries (software developers, communication firms, financial services, etc) spend approximately 10% of their revenues to IT while the health care industry invests only about 2%. Table 8 Total ICT spending by region, 1999-2007 ($US billions). Source: http://www.witsa.org/digitalplanet/DP2004-Summary.pdf. On a regional basis there is unequal spending on ICTs. Traditionally, America was more inclined to ICT industry and spends more than the Asia-Pacific and EMEA countries (table 8).. The Arab ICT market The ICT market in Arab countries is rather nascent. Arab countries invest a very little percentage of their GDP in ICTs. The average investment level for the Arab world is a mere 4% of GDP compared to 8% in industrialized countries. Insufficient investments in that sector imply that the development of this industry will be slow and this will result in a slow growth of other sectors that depend on ICTs. Nonetheless, some governments in Arab countries have recently shown increasing interest in the industry and have decided to make the necessary reforms in order to develop it and attract foreign capital. Diversification and reduction of their oil dependency is one of the goals of some governments such as the UAE. The most important ICT markets in the Arab world are the ones of Saudi Arabia, Egypt, UAE and Jordan. Indeed, the Saudi ICT industry is one of the largest and fastest growing markets in the Arab world. The country’s government has embarked on a grand scale projects aimed at expanding the ICT infrastructure. Because of the government aggressive plans to increase the use of new technologies and especially of ICTs in a short period of time, demand for software products, computer equipment, IT services and data communications is quite high. For the period 2002-2003, the demand for ICT products and services grew at an average compound rate of 8.3% (table 9). It is worth mentioning that the digitalization of the Saudi Arabia’s telecommunications industry (it is presently totally digitalized) contributed to these growth rates.. Page 10 | CIRST – Note de recherche 2007-02.
(15) International Competitiveness in the Telecommunications and ICT Sectors: A Cross-Country Comparison. 2002 (US$) Software products Computer equipment IT services Data communications Total. 1,000 850 1,300 550 3,700. Table 9 Saudi Arabia’s ICT market 2003 (US$) CAGR (compounded average (estimates) growth rate) 1,295 9% 1,041 7 1,592 7 772 12 4,700 8.3. Source: Madar Research Group, 2004. Another interesting market for which data exist is the one of Jordan. Jordan's ICT industry is mainly regional. It is concentrating its export activities in the neighbouring Arab countries although significant inroads are being realized in the North America market (table 10). Table 10 Jordanian ICTs exports by region Exports ($) Percentage (%) 28,059,000 40% 26,098,000 37 13,053,000 19 2,323,000 3 118,000 1 77,000 0,001 69,728,000 100%. Region Other Arab Gulf The Americas Europe South East Asia Africa Total. Source: Information Technology Association, Jordan, 2003 ICT Industry Statistics, 2004. The government of Jordan initiated a blueprint toward an information society and its goals were set out in the REACH initiative. Its vision is to make Jordan a major regional IT leader and an internationally recognized exporter of IT products and services. Table 11 Domestic and Export revenues for Jordanian ICTs Industry, 2001-2003 Revenues and investment. Domestic revenues Export revenues Total revenues Cumulative investments. 2001. 2002. 2003. 188,448,000 40,038,000 228,486,000. Growth rate 45% 0% 34%. 226,183,000 69,728,000 295,910,000. 20% 74% 30%. 68,000,000. 13%. 79,656,250. 17%. In $. In $. 130,000,000 40,000,000 170,000,000 60,000,000. In$. Growth rate. Source: Information Technology Association, Jordan, 2003 ICT Industry Statistics, 2004. Based on its strengths and exploiting its human and capital advantages, its ICT industry witnessed an overall growth in revenues in 2003 by more than 30%. Starting from total revenue of approximately $170M in 2001, it reached $228M in 2002 and $296M in 2003. Its sales were chiefly destined to the Arab countries but its export market was the Americas and Europe as well. The major part of its revenues comes from the sale of hardware and technology provision, licensing, software development and communications and internet services. The ICT sector employs 3,550 employees divided among technical, marketing and sales, administrative and management departments. CIRST – Note de recherche 2007-02 | page 11.
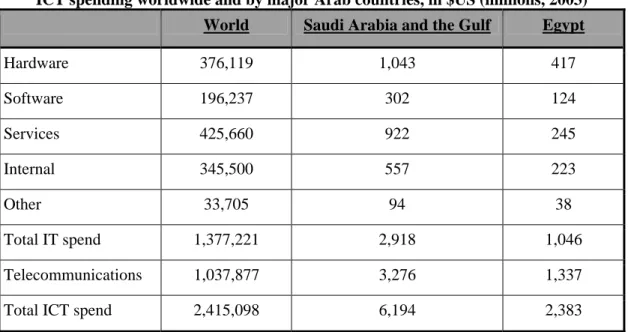
(16) Anastassios Gentzoglanis Table 12 shows the demand for ICT services and equipment and its decomposition in world demand and demand by the most important Arab countries in terms of ICT. Table 12 ICT spending worldwide and by major Arab countries, in $US (millions, 2003) World. Saudi Arabia and the Gulf. Egypt. Hardware. 376,119. 1,043. 417. Software. 196,237. 302. 124. Services. 425,660. 922. 245. Internal. 345,500. 557. 223. Other. 33,705. 94. 38. Total IT spend. 1,377,221. 2,918. 1,046. Telecommunications. 1,037,877. 3,276. 1,337. Total ICT spend. 2,415,098. 6,194. 2,383. Source: World Information Technology and Services Alliance (WITSA), 2004. As it was mentioned above, compared to the industrialized countries, the ICT industry in Arab countries is currently small. However, it is highly dynamic and innovative, with enormous potential for growth, increasing employment and higher export levels. Its relatively low cost structure, its proximity to vital European and Asian markets and the commitment of many Arab governments to nurture the ICT industry and expand business opportunities, will continue to contribute to the rapid development of the ICT industry in this region. A high percentage of Arab ICT companies export regionally and internationally.. The state of the networked economy of Arab and benchmarked countries Despite the erosion of the overall competitive position of some Arab countries, the Arab competitiveness as a whole has increased recently. The success of this group of countries is greatly attributed to its willingness to proceed with regulatory and institutional reforms in major sectors of the economy such as telecommunications, electricity, transport and financial markets. Simultaneously, they developed ICTs policies to reap the advantages offered by the new technologies and the internet. Policy makers in the region want to further exploit the new possibilities and to integrate the Arab countries into the networked economy. The Arab countries start, however, from low levels of knowledge of the new economy and their economic and financial means may not suffice to invest in ICT infrastructure and take advantage of the Information Age. Basically, the Arab countries tend not to have the same infrastructural facilities and support as the industrialized countries, which are the prerequisites for being able to reap the benefits of new technologies. Even so, there are good examples of countries which managed to get into the information age with levels of development almost equal to the current one of the Arab region. For instance, a group of countries, such as Chile, South Africa, Malaysia and Korea were, not long time ago, close to many Arab countries in terms of economic development. Regulatory and institutional reforms across the border and other sound macroeconomic and sectoral policies have profoundly transformed their economic landscape and led them to higher levels of economic prosperity and well-being, in a relatively short period of time. These are good examples of best Page 12 | CIRST – Note de recherche 2007-02.
(17) International Competitiveness in the Telecommunications and ICT Sectors: A Cross-Country Comparison practices in developing policies that managed to convert these countries in knowledge-based economies with an enviable level of development. To understand what happened and how these countries managed to increase their well-being, is imperative to analyse, compare and evaluate their policies and their results. This will provide guidance to the leaders of Arab countries in formulating and adapting their own ICT policies accordingly. To get a better perspective, it is interesting to make a comparative study of each country’s development with respect to its ICT and telecommunications industries. Technological changes, regulatory reforms and investments in information and communication technologies (ICT) in Arab countries have contributed to the modernization of their telecommunications network and created a business environment suitable for sustained economic growth. Table 13 shows the Arab and benchmark countries’ mobile teledensity for the year 2004 and the actual and forecast number of users for the years 2006 and 2010. By any means, Gulf countries dominate the scene. Table 14 shows the number of internet users and host countries in the Arab region and for the benchmark countries. The latter dominate by far the Arab countries. Nonetheless, the countries of the Gulf region and especially the UAE are surpassing Chile and they are very close to Malaysia and Portugal. This is quite impressive, indicating that the policies adopted by the country are bearing fruits and its citizens become technology savvy and more knowledgeable.. CIRST – Note de recherche 2007-02 | page 13.
(18) Anastassios Gentzoglanis Table 13 Mobile users and teledensity in Arab and benchmark countries, 2004-2010 Mobile users, 2004 (millions). Mobile users, 2006 forecast (millions). Mobile users, 2010 forecast (millions). Teledensity, %, 2004. Algeria. 1,45. 1.6. 4,5. 4.51. Bahrain. 443.1. 0,6. 0,6. 65.35. Egypt. 8,5. 10.1. 17,6. 11.28. Iraq. 20.1. 0,9. 3,8. 0.79. Jordan. 1,3. 1,6. 2,0. 23.61. Kuwait. 1,4. 1,7. 2,0. 62.89. Lebanon. 775.1. 2,0. 2,6. 20.52. Libya. 100.2. 0,2. 0,4. 1.78. Mauritania. 300.1. 0,3. 0,4. 9.72. 7,3. 9,6. 11,7. 22.76. Oman. 464.9. 0,8. 1,0. 16.02. Qatar. 376.5. 0,5. 0,5. 44.81. 7,2. 5,6. 6,7. 28.09. 400.3. 0,8. 1,6. 2.22. Tunisia. 1,9. 1,0. 1,6. 19.04. UAE. 2,1. 2,3. 2,5. 83.2. 411.1. 1,0. 1,4. 2.05. Chile. 6,5. 10,0. 11,2. 40.74. Korea. 33,5. 41,3. 42,6. 69.37. Malaysia. 11,1. 14,2. 16,8. 47.29. Portugal. 9,3. 8,6. 8,6. 88.42. Country. Morocco. Saudi Arabia Syria. Yemen Benchmark countries. 16,8 14,2 15,2 38.04 South Africa Sources: World Development Indicators 2004, CIA Fact Book, 2005, UMTS Forum Report, 2004, author’s calculations. Page 14 | CIRST – Note de recherche 2007-02.
(19) International Competitiveness in the Telecommunications and ICT Sectors: A Cross-Country Comparison Table 14 Internet users and hosts in Arab and benchmark countries, 2004 Internet users, 2004(millions). Internet hosts, 2004 (thousands). Internet-user density, 2004 (%). Algeria. 500,000. 897. 1.5. Bahrain. 195,700. 1,334. 27.7. 4.2. 3,401. 4.3. Iraq. 25,000. NA. 0.1. Jordan. 457,000. 3,160. 7.9. Kuwait. 567,000. 3,437. 22.4. Lebanon. 400,000. 6,998. 11.2. Libya. 160,000. 67. 2.7. Mauritania. 300.1. 25. 0.4. Morocco. 800,00. 3,627. 3.2. Oman. 180,000. 726. 7.5. Qatar. 376.5. 221. 18.3. 1.5. 15,931. 6.9. Syria. 220,000. 0,8. 3.3. Tunisia. 630,000. 281. 6.2. 1,110,200. 56,283. 29.6. 100,000. 138. 0.5. Chile. 3.575 (million). 202,429. 25.8. Korea. 29.22 (million). 694,206. 63.3. Malaysia. 8.692 (million). 107,971. 35.9. Portugal. 3.6 (million). 346,078. 34.4. Country. Egypt. Saudi Arabia. UAE Yemen Benchmark countries. 3.1 (million) 288,633 7.3 South Africa Sources: World Development Indicators 2004, CIA Fact Book, 2005, UMTS Forum Report, 2004, author’s calculations. Table 15 shows some economic, demographic and social characteristics of Arab countries and compares them to the benchmarked countries. The Arab countries in MENA region are relatively poorer than the ones in the Gulf region. The disparities are quite evident in all categories and indices used. Nonetheless, even within the MENA group there are still a lot of differences especially at the level of development and openness of the economy. Some MENA countries have a competitive advantage over other countries in the region especially in the area of ICT and telecommunications in particular. Jordan, Tunisia and Morocco compare quite well to other Middle-East countries. Although their literacy rates differ substantially among them, their investments in ICT have been increasing, chiefly because of sound regulatory reforms and strong institutions in the telecommunications and ICT sectors.. CIRST – Note de recherche 2007-02 | page 15.
(20) Anastassios Gentzoglanis Table 15 Demographic, Literacy, and Wealth Indicators for Arab and benchmark countries (2004) Country. Population Population (millions) growth rate (%). Literacy Rate (%). Gross fixed GDP PPP US$ GDP – real investment per capita growth rate % of GDP (%). Algeria. 32,129. 1.22. 70.00. 1.613. 26.2. 6.1. Bahrain. 677,886. 1.51. 89.16. 11,518. 12.8. 5.6. Egypt. 76,117. 1.78. 57.7. 1,424. 15.8. 4.5. Iraq. 25,375. 2.7. 40.4. NA. 3,500. 52.3. Jordan. 5,611. 2.56. 91,3. 11.6. 4,500. 5.1. Kuwait. 2,258. 3.44. 83.5. 8.0. 21,300. 6.8. Lebanon. 3,777. 1.32. 87.4. 26.0. 5,000. 4. Libya. 5,632. 2.33. 82.6. 9.9. 6,700. 4.9. Mauritania. 3,086. 2.9. 41.7. 583,28. 1,800. 3. Morocco. 32,209. 1.57. 51.7. 22.4. 4,200. 4.4. Oman. 2,903. 3.32. 75.8. 13.5. 13,100. 1.2. Qatar. 840,290. 2.61. 82.5. 22.9. 23,200. 8.7. Saudi Arabia. 25,796. 2.31. 78.8. 17.2. 12,000. 5. Syria. 18,017. 2.34. 76.9. 16.3. 3,400. 2.3. Tunisia. 9,975. 0.99. 74.2. 24.5. 7,100. 5.1. UAE. 2,524. 1.54. 77.9. 20.8. 25,200. 5.7. Yemen. 20,025. 3.45. 50.2. 16.1. 800. 1.9. Chile. 15,824. 0.97. 96.2. 23.9. 10,700. 5.8. Korea. 48,426. 0.38. 97.9. 28.7. 19,200. 4.6. Malaysia. 23,522. 1.8. 88.7. 21.7. 9,700. 7.1. Portugal. 10,566. 0.39. 93.3. 22.3. 17,900. 1.1. 44,344 -0.31 11,100 South Africa Sources: World Development Indicators 2004, CIA Fact Book, 2005, author’s calculations. 3.5. Benchmark countries. Table 16 shows the differences between the Arab countries (taken as a group) and some industrialized economies with respect to a number of key IT variables. The numbers show that despite the increase in ICT spending worldwide, most MENA countries still spend very little compared to the more advanced economies of the U.S., U.K., Germany, and Japan. Furthermore, demand in Arab countries for ICT and services are very low compared to other economies. Factors such as low literacy rates, low GDP per capita, and high prices for internet services may explain the differences.. Page 16 | CIRST – Note de recherche 2007-02.
(21) International Competitiveness in the Telecommunications and ICT Sectors: A Cross-Country Comparison Table 16 ICT spending and IT variables in selected Arab countries compared to USA, Japan, UK, Germany and world total, 2001 Telecommu Total IT Total ICT ICT/GDP IT variables nications spending (%) spending (PCs installed) 265,954 546,681 7.9 USA 812,635 227,135,001 UK. 46,370. 91,356. 137,726. 9.7. 20,931,785. Germany. 56,385. 98,260. 154,645. 7.9. 27,367,298. 225,761. 188,012. 413,772. 9.6. 49,239,412. Japan Gulf States & Saudi Arabia Egypt. 3,276. 2,918. 6,194. 3.6. 904,831. 1,337. 1,046. 2,383. 2.5. 651,084. World total. 1,037,877. 1,377,221. 2,415,098. 7.6. 541,177,209. Source: Gentzoglanis, A., 2002. Figure 2 relates GDP per capita, an index of economic growth, to fixed teledensity for the Arab countries. It is an attempt to examine the link between the two variables. The graph indicates that, indeed, MENA countries are in line with the Jipp7 theory. The Jipp curve (ENCIP, 2002) linearly correlates the teledensity ratio and a country’s GDP. It shows how well a country performs in terms of telecommunications equipment compared to other countries with similar GDP per capita. Countries below the curve are over-equipped while the ones above the curve are under-equipped. As far as the fixed lines density is concerned, the countries such as Algeria, Lebanon, Morocco and Tunisia are under-equipped while Jordan, Syria, Egypt and Turkey are over-equipped. With regard the mobile lines density, countries as Algeria, Tunisia and Syria are under-equipped while Jordan, Morocco and Turkey are over-equipped. Both, Egypt and Lebanon are just rightly equipped. Figure 2 Jipp curve for 2000 in MENA countries. Source: Bezzina, J., IDATE, 2003. 7. Jipp A. (1963). Wealth of nations and telephone density. Telecommunication Journal, No.6, 199-201. CIRST – Note de recherche 2007-02 | page 17.
(22) Anastassios Gentzoglanis MENA countries have a tremendous potential in growth in the ICT in general and in telecommunications industry in particular. According to IDATE estimates, the number of fixed main lines throughout the MENA region could grow by over 67% during the five coming years. Tables 17 and 18 show the growth of the online population worldwide and compares it to Arab region. Growth is consequently likely to occur in areas with low levels of teledensity. The number of fixed lines in the MENA15 should only increase by around 106.88%, whereas this figure should more than double in the MEDA area (108.71%). Table 17 Growth of the “online” population worldwide, 2000-02 Year Geographic Region. Europe Canada& USA Latin America Asia/Pacific Africa Middle East World total. 2000 Number online, millions 94.22 157.24 13.4 89.43 3.11 2.4 359.8. 2002 % of total 26 44 4 25 1 1 100. Number online, millions 171.35 181.23 25.33 157.49 4.15 4.65 544.2. Growth rate, % (2000-02). % of total 31 33 5 29 1 1 100. 81.86 15.26 89.03 76.10 33.44 93.75 51.25. Source: Nua Internet Surveys (2000 and 2002).. Table 18 Total population with access to main telephone lines, mobile telephones, Internet and ISP (1996-2000) % of population % of population Internet Service Country with access to Providers (ISP) With mobile Using the main telephone telephones Internet lines 24.89 53.23 7,800 United States 69.77 58.47 21.79 32.64 245 United Kingdom 57.14 25.54 42.55 52 The Netherlands 47.63 50.39 21.35 73 Japan 11.81 6.99 3.10 8.31 Average Arab countries Source: CIA (2001).3. Countries such as Egypt, Morocco, Tunisia, Jordan and the ones in the Gulf region have gone through an important number of macroeconomic and microeconomic reforms and the latter have already contributed to increase their economic performance. These countries are relatively well positioned in the region. Nonetheless, other countries in the world managed (Korea, Malaysia) to reform their telecommunications and ICT industries faster than the Arab countries with great success threatening thereby their emerging regional competitive advantage. The main policy instruments for policy makers can be grouped into five categories: Page 18 | CIRST – Note de recherche 2007-02.
(23) International Competitiveness in the Telecommunications and ICT Sectors: A Cross-Country Comparison • • • • •. Blueprint and clear policy objectives for the economy and the sector Regulatory and institutional reforms of the ICT and telecommunications sectors Commitment on policy objectives and realization of the targets Revamp of the financial markets and FDI rules Tariff level and design to accelerate the fulfillment of the objectives. These instruments are interrelated through their impact on the industry and the economy, and they can be used simultaneously to create an enabling environment for investment and growth in the Arab region.. FDI in the ICT and telecommunication sectors in Arab countries It has been established in economic theory that foreign direct investment (FDI) favours growth and prosperity. A country's capacity to attract FDI is a definite advantage and many developing countries have recently recognized it and adopted policies to promote FDI. Costa Rica, Chile and Argentina in Latin America, China, Korea and India in Asia and Poland, Hungary and Czech Republic in Central Europe are notable examples. For instance, Bangalore, the city at the heart of India's booming information-technology industry attracts most of the country's FDI and has become the hub of the great Indian boom in software and remote services, such as call-centres (known as "business process outsourcing", or BPO). Mumbai has also become a service city and 60% of its recent economic growth is attributed to the city's transformation into a service economy. Costa Rica's recent economic growth is attributed to the adoption of ICTs. The installation of computer laboratories in every rural and urban public school, the introduction of smart cards and their use in many sectors of the economy (health, transportation, public administration, etc.), the development of multipurpose/multimedia mobile units transportable to any rural community providing Internet and e-mail services, training in ICTs and medical services, are some examples of the early adoption and contribution of ICTs to the economy's increase in exports and economic growth. Costa Rica has been the fastest growing economy in the region and the most diversified one. Its conversion from the old to the new economy has been possible thanks to a stable political system and a population with skills and capacity to adjust to the new economic conditions since it is a country with literacy rate of above 98%.. Concentration of FDI in the Arab world FDI contributes, among other things, to the flow of information and the use of ICTs, but the Arab countries receive less FDI relative to other regions. In fact, the Arab countries receive about twenty times lower inflows of FDI compared with the Latin America and the Caribbean and about thirty two times lower than the Asia-Pacific region. Among the Arab countries, Saudi Arabia, Jordan and Egypt had in 2001 the lion’s share of FDI stock in the region. In fact FDI stock in Arab world is mainly concentrated in five countries: Saudi Arabia, Egypt, Tunisia, Bahrain, Jordan and Morocco. These are the countries with a relative economic and political stability and an advanced level of structural reforms. Indeed, during the 1990s almost all Arab countries passed new investment legislation and revamped their capital markets regulations and restrictions limiting foreign ownership. Although the introduction of new legislation aimed at creating an enabling environment for domestic and foreign firms, the degree of reforms and the investment incentives offered vary significantly from country to country. For instance, as far as capital markets legislation and regulation are concerned, the Arab countries in North Africa outpaced the rest of the Arab world, particularly with regard to provisions for new financial instruments such as venture capital and private equity funds. The creation of new institutions aim at facilitating and encouraging the creation of more competitive businesses, deepening financial markets and attract higher levels of FDI. CIRST – Note de recherche 2007-02 | page 19.
(24) Anastassios Gentzoglanis Table 19 Concentration of FDI Stock in Arab Countries (percentage of total stock in Arab world) Country Saudi Arabia Year 2001 Egypt 34% Tunisia 22% Bahrain 14% Morocco 7% UAE 7% Oman 3% Qatar 3% Jordan 2% Algeria 2% Syria 2% Lebanon 1% Yemen 1% Kuwait 1% Mauritania 0% Libya N.A. Source: UNCTAD, 2001. Furthermore, the privatization programmes have had as an effect to increase the FDI inflow to the countries with more advanced levels of reforms. In the early 2000s, Morocco has received the lion's share of FDI when it decided to partially privatize its national telecommunications carrier, Maroc Telecom, while the privatization of the Telecommunications Corporation of Jordan accounted for 28% of existing FDI stock in the country. The privatization policy is an attractive strategy to lure foreign direct investment and increase the capital inflow in the region. A priori, the higher the openness of the market the higher is the penetration ratio of FDI. And the price tag of a privatized telecommunications firm that is granted monopoly rights is higher than the one that operates under competitive conditions. Further, investors are willing to pay more for telecom firms in countries where the regulatory reforms take place before privatization. The establishment of a credible regulatory authority before privatization is also contributing to higher investments in the telecommunications industry and penetration ratios. Morocco, for instance got a quite substantial price from the privatization of its Telecom monopoly firm because it had just applied these basic principles (Gentzoglanis, A., 2002, 2003, 2004). Mauritania, on the other hand, failed in its efforts to privatize its industry on several occasions because privatization, inter alia, preceded the regulatory reforms (Gentzoglanis, A., 2003). At present, plans to liberalize the telecommunications industry are in advanced stages in many Arab countries. Three North Africa Arab countries (Algeria, Tunisia and Morocco) have liberalized their telecommunications industry while Egypt and the GCC countries have their International Long Distance (ILD) communications markets under monopoly (de facto or de jure). Bahrain and Jordan liberalized their Telecom market in 2004 and they expect to grant fixed-line licenses during 2005. Egypt, also, is expected to liberalize its fixed market in 2006 and Saudi Arabia’s two new data licensees both have international gateway rights. The liberalization of the telecommunications industry will make entry easier and as new operators set up this will lead to more bandwidth requirements. Demand for international service will increase as international service rates will go down as a result of tariff rebalancing. High demand, especially with the increased uptake of high speed broadband Internet, will push operators onto obtaining greater international bandwidths from global operators such as FLAG and SEA-ME-WE. Table 20 shows the competitive conditions in the telecommunications industry in selected Arab countries and the average rate for a three minute call. Competition seems to result in an increase in local rates (rate rebalancing Page 20 | CIRST – Note de recherche 2007-02.
(25) International Competitiveness in the Telecommunications and ICT Sectors: A Cross-Country Comparison effect). Table 21 shows the level of openness in the telecommunications industry in Arab countries and compares it to the benchmark countries. Table 20 The status of the International Long Distance (ILD) telecommunications markets and average cost per call in Arab countries Country. Status of the International Long Distance (ILD) telecommunications markets. Average tariff of a local telephone call (US$ per 3 minutes). 2001 Algeria C (competition) 0.02 Morocco C 0.08 Tunisia C 0.08 UAE M (monopoly) NA Bahrain M 0.05 Jordan M 0.04 Egypt M 0.01 Benchmark countries Portugal O (oligopoly) 0.11 Korea O 0.03 Chile C 0.10 South Africa C 0.07 Malaysia C 0.02 Source: http://www.econstats.com/wb/Cnt106.htm and author’s calculations. 2002 0.02 0.08 0.15 NA 0.05 0.04 0.02. 2003 0.04 0.09 0.17 NA 0.05 0.05 0.02. 0.11 0.03 0.10 0.09 0.03. 0.13 0.03 0.10 0.15 0.02. The benchmark group of countries shows more similarities in their level of reforms than the Arab countries. Portugal and Korea have a fair degree of openness of their telecommunications market while Chile, South Africa and Malaysia have a completely open telecommunications industry.. CIRST – Note de recherche 2007-02 | page 21.
(26) Anastassios Gentzoglanis Table 21 The level of structural reforms of the telecommunications market in MENA and benchmarked countries8 Country Very Low Low Fair Quite high (0-3) (3-5.5) (5.5-7.5) (7.5-10) Syria 1998-2001 2001 2004 Saudi Arabia x Qatar x Oman x Libya x Iran x Mauritania x Kuwait x Yemen X (1998) X (2001) Tunisia x x Lebanon x x Egypt x Bahrain X (2001) x Algeria x x x Jordan x x Morocco x UAE Benchmark countries Korea x Malaysia x Portugal x Chile x South Africa x Source: Rossotto et al. (2003) and author's calculations. International competitiveness of Arab countries - measuring the digital divide The lack of a country's capability to participate in advanced ICTs because of problems associated with connectivity and access to information highways is termed "digital exclusion". The difference in the level of deployment of ICTS among countries is termed "digital divide". A digital exclusion or even the existence of a digital divide has significant consequences on the prospects of a country's development in the future. Rapid advances in the ICTs have cumulative effects on economic growth and failure to recognize their importance and to deploy them rapidly would damage the competitiveness of the reluctant country. Erstwhile resource-based economies (Canada, Finland, Sweden, etc.,) managed to grow in the past because of the abundance of these particular resources. In the same vain, some developing countries managed to grow based on their comparative labour advantage, i.e., on cheap industrial labour. Further, the GCC realized high growth rates because of the abundance of oil reserves and sound economic policies. Today the new economy is increasingly based on knowledge and firms base their competitive capacity on 8. Rossotto et al. (2003) measure market openness in the telecommunications industry by examining the degree of effective competition in the industry, the existence of regulation that favours competition, the degree of independence of the regulatory agency and the openness of the country to FDI.. Page 22 | CIRST – Note de recherche 2007-02.
(27) International Competitiveness in the Telecommunications and ICT Sectors: A Cross-Country Comparison factors such as mastering new information technologies and using information to their advantage. This increases the efficiency and the effectiveness of business processes, improves the efficiency of distribution channels and reduces the costs of production and marketing and facilitates the access to new and more global markets. Furthermore, it makes easier the access to capital markets facilitating thereby the finance of investment projects. Both consumers and producers benefit because of the availability of more customized products and services and because of their higher quality. Customization is possible thanks to the ICTs, a method that allows the realization of more profits and a better satisfaction to consumers. E-commerce has become a way of life in some advanced economies, especially in the USA, Europe and parts of Asia but it is still far behind in less developed economies and in Arab countries. Nowadays, in developed economies, it is hard to find new firms to want to get established without implementing the ICTs in their management, production and administrative processes. It is not only because their uses make them more efficient but because customers and especially suppliers demand the use of ICTs. Internet EDI is a fact of life of many traditional and electronic firms. Firms in developing countries not espoused the ICTs would have hard times to get integrated into the global market. The higher the difference in use of ICTs between firms and other organizations in developed and less developed economies, the higher would be the digital divide. Gini coefficients and Lorenz curves are increasingly used to measure the digital divide and the inequality that exists between developed and developing economies. Traditionally, variables such as the number of internet users; PCs, internet host in a country and the number of telephone mainlines and mobile subscribers are used to calculate the Gini coefficients. Gini coefficients compare cumulative shares of each variable of interest (internet hosts for example) relative to the cumulative share of the world's population. A distribution is more equal the lower the value of Gini coefficient. A value of one means that the distribution is perfectly unequal since one individual gets the whole pie. By contrast, a zero (0) Gini value means perfect equality since a given percentage of the population gets the corresponding percentage of the variable in question. For instance, if 20% of the population gets 20% of the Internet usage, the Gini coefficient is equal to one and we have a perfect equality. The evolution of the Gini coefficients for the period 1995 to 2002 worldwide is given in table 22. The results are striking. Mobile telephony has shown a dramatic shift in inequality with a 26% reduction between 1995 and 2002, while Internet hosts remains stubbornly unequal during the same period. As far as the other technologies are concerned, they showed a small decline in inequality. Taking globally, the digital divide persists and apart from the use of mobiles, it remains relatively stable over time (table 22).. Variables Telephone mainlines Mobile subscribers Internet users Internet hosts PCs. Table 22 Gini Coefficients 1995-2002 worldwide Year 1995 1999 2000 0.688 0.614 0.592 0.822 0.735 0.703 0.871 0.786 0.757 0.910 0.913 0.916 0.791 0.764 0.754. 2001 0.567 0.655 0.735 0.915 0.747. 2002 0.551 0.609 0.671 0.913 0.730. Source: The Digital Divide: ICT Development Indices 2004, Geneva, December 2004, UNCTAD. The picture is a bit different if the assessment is done at a regional, i.e., Arab level. BAH analysed the Arab ICT sector and the results show a difference between the GCC nations and the North Africa Arab countries. Exaggerating slightly, it can be said that there is a digital divide between the two groups of countries (table 23).. CIRST – Note de recherche 2007-02 | page 23.
(28) Anastassios Gentzoglanis Table 23 Assessment of the ICT Sector in some Arab Countries. 1 Bahrain Jordan Egypt Lebanon Saudi Arabia Syria UAE Korea Chile Portugal S. Africa Malaysia. Environment 2 3 x x x x x. 4. x. 1. Readiness 2 3 x x x x x. x x. 26 33 27 38 29. 4. 1. 4. x x x x. x 12 34 37 44 29. Uptake/Usage 2 3 x x. x 8 32 38 35 38. Source: BAH Analysis, 2004. Table 23 ranks the Arab countries and compares them to the reference group of countries. International ranking is given as well for comparison reasons. The Gulf Arab countries are ranked higher than the Arab countries in North Africa. UAE is even close to the highest ranked countries of the reference group, being second only to Korea. The GCC countries have nothing to envy from the benchmarked countries. They occupy a similar position internationally. Table 24 WEF’s ranking of the most networked nations: comparison of Arab and benchmarked Countries (Network readiness index 04-05) Ranking Ranking Arab World Benchmark World among Arab among the countries ranking countries ranking countries benchmark countries Qatar 1 Korea 1 20 UAE 2 23 Malaysia 2 26 Bahrain 3 33 Portugal 3 31 Oman 4 South Africa 4 37 Jordan 5 44 Chile 5 35 Tunisia 6 31 Saudi Arabia 7 Morocco 8 54 Egypt 9 57 Algeria 10 80 Lebanon 11 Yemen 12 Source: http://www.rediff.com/money/2005/mar/09wef1.htm. The World Economic Forum (WEF) publishes annually the Global Information Technology Report (GIR). The Report uses the ‘Networked Readiness Index’ (NRI) the degree of preparation of a nation or community to participate in and benefit from ICT developments". The NRI is composed of three Page 24 | CIRST – Note de recherche 2007-02.
(29) International Competitiveness in the Telecommunications and ICT Sectors: A Cross-Country Comparison component indexes which assess the environment for ICT offered by a given country, the readiness of the country’s individuals, business and governments and the usage of ICT among the country’s major stakeholders. The 2004-2005 Report covers a total of 104 countries, among them, the UAE and Qatar. ITU’s digital access index (DAI)9 is more comprehensive and it takes into account affordability and education to construct its index. It classifies the countries in four digital access categories: high, upper, medium and low. This index has the advantage in lumping together countries with similar average scores. For the year 2002, none of the countries examined here could be categorized in the high digital access. Again the GCC (UAE, Bahrain, Qatar and Kuwait) were in the upper category the same as Portugal and Chile from the referenced group countries. The Arab countries from North Africa (Lebanon, Jordan, Libya, Egypt and Morocco) and Oman and Saudi Arabia from GCC were classified as medium digital access countries. Lastly, Syria and Yemen are classified in the low digital access category (table 25).. Arab countries UAE Bahrain Qatar Kuwait Lebanon Jordan Saudi Arabia Oman Libya Egypt Morocco Syria Yemen Benchmark countries Korea Portugal Chile Malaysia South Africa. Table 25 ITU’s ranking of the most digitilized nations: comparison of Arab and benchmarked Countries (2004) High access* Upper access Medium access 0.64 0.60 0.55 0.51 0.48 0.45 0.44 0.43 0.42 0.40 0.33. Low access. 0.28 0.18. 0.82 0.65 0.58 0.57 0.45. http://www.itu.int/newsarchive/press_releases/2003/30.html *High: 1-0.70; upper: 0.69-0.50; medium: 0.49-0.30 and low: 0.29-0.. It is interesting to note that, since the year 2000, almost all selected Arab countries have realized gains in terms of ICT readiness. Nonetheless, differences do exist among themselves and it seems that they will continue to exist because of the difference in policies pursued by each government. Thus, some Arab countries lag far behind the others while some others leapfrog into the future by realizing significant gains in short period of time. UAE for instance, is the most advanced in the region with an overall rating 9. The digital access index (DAI) consists of eight variables grouped into five categories (availability of infrastructure, affordability of access, educational level, quality of ICT services, and internet usage). An indicator is constructed by using each variable. The overall DAI is obtained as a weighted average of each indicator. CIRST – Note de recherche 2007-02 | page 25.
(30) Anastassios Gentzoglanis of three (3) in all of the three dimensions of ICT industry (23). A common characteristic of all of the Arab countries (with the exception of UAE and Lebanon) is that in terms of usage they are still in their infancy. A number of factors may explain the slowness in the use of ICTs. Apart from the low literacy rate in the region and the fact that most of the content is in English, the price to access the ICTs is quite high, despite the progress realized lately. Indeed, telecom services prices, PC prices and internet dial-up rates are quite high for most Arab countries making access to and use of ICTs a luxury good. It goes without saying that privatization, deregulation and the entrance of mobile operators in the region has changed the telecommunications landscape with interesting results. Telephone penetration has increased in these countries dramatically while these changes gave an impetus to the ICT markets. Nonetheless, the telecommunications markets remain quite concentrated, despite the reforms, and service charges have not been reduced sufficiently. The governments should play a more proactive role in favouring more competitive markets which will result in a better quality service and at lower prices. Developing countries in general and Arab countries in particular have a great opportunity and potential to actively participate and compete in the new globalized market, should they invest and develop the necessary know-how in ICTs. The question is not whether they should respond to the challenges of ICTs but how to respond and what are the best means to actively participate and reap the benefits of ICTs. Best practices (Korea, Costa Rica, India, South Africa, etc.,) adopted by developing and in transition economies have shown that the early adoption of ICTs have had positive consequences on many aspects of economic, social and political aspects. The pervasiveness of ICTs is not limited to the traditional means of communication such as radio, television, telephone and the computers but it covers every aspect of life, health and disease prevention, environment, traffic congestion reduction, safety, education, work (teleworking), government, etc. Despite the positive economic contribution of ICTs, many developing and Arab countries are remarkably very slow to use it and adopt it in government and business. The current figures of ICT growth reflect activity by 5% of the world's population. This is particularly striking since the figures show that even for basic services such as telephone and electricity, 70% of the world population has never used a telephone while more than two billion people lack the basic service of electricity. To be effective and capable to use the ICTs a country must have an efficient telecommunications environment and a population with the necessary skills (education, literacy, technical, legislative, etc.) and knowledge. Most Arab countries have a large percentage of young but most of them are unskilled workers. By western standards, women in most Arab countries are marginalized (women constitute 28 percent of the total labour force in the MENA region, the lowest level of female labour force participation in the world) and their contribution to the economic system is negligible. Literacy rates are relatively low despite the recent progress in many Arab countries lately.. Policies to promote ICT development in Arab countries The recognition of the importance of ICTs for development and economic prosperity has sparked a number of initiatives among developed and developing economies to develop and implement policies that promote the diffusion and use of ICTs and encourage the even access to ICTs in urban and rural geographic regions. More precisely, these policies aim at addressing the issues that arise from the impact ICTs have on business, society, labour force, technology and international cooperation. Thus, the ICT policies recognize that coordinated multi-level (government, private sector) initiatives are necessary to address the issues arising from the ever widespread use of ICTS around the world. The policies must be articulated around the following main themes: network infrastructure; technology development and. Page 26 | CIRST – Note de recherche 2007-02.
(31) International Competitiveness in the Telecommunications and ICT Sectors: A Cross-Country Comparison diffusion; development of skills, training and education programmes; and development of cooperation initiatives among international partners. In the past decade or so, many countries made tremendous technological advances and are positioned to become more competitive in technology development because of their investments in R&D, in science and technology and human capital and ICTs infrastructure. Their success in the marketplace may depend on a number of additional factors such as political stability, access to financial capital and an adequate infrastructure capable in supporting technological and economic advancement. A number of leading indicators have been constructed in assessing the potential of a country to become an important exporter in high technology products and services. These indices are classified in four categories and include the indices of national orientation, socioeconomic infrastructure, technological infrastructure and productive capacity. Table 26 Indices for assessing a country’s potential to become an exporter in ICTs Index Description National orientation Explicit or implicit national strategies involving collaboration between the public and private sectors Socioeconomic The existence or not of social and economic institutions supporting and infrastructure developing the economic, social, physical and organizational resources essential to a modern, technology-based industrial economy. Dynamic capital markets, continuous capital formation, increasing levels of FDI (foreign direct investment) and investments in education are some of the indicators of socioeconomic infrastructure. Technological Government institutions that contribute to a country’s capacity to develop, infrastructure produce, and market new technologies. Indicators include the existence of legislation that protects intellectual property rights, competency in hightechnology manufacturing, and the ability to produce qualified scientists and engineers. Productive capacity Physical and human resources allocated to the production of manufacturing products and the efficiency with which those resources are used. Indicators include the quality and productivity of the labour force, the existence of skilled labour, and innovative management practices as well as the current level of high-technology production. The major industrialized countries recognized earlier the importance of ICTs than developing countries and devoted resources in converting their economies to high-technology industries. The latter grew at an inflation-adjusted rate of almost 6.5% during the period 1980-2002, while the other manufactured goods industry grew at 2.4%. The latest data through 2002 show output in high-technology industries to grow faster than output in other manufacturing industries. As late as 2001, high-technology manufacturers accounted for 21% of the USA’s total manufacturing output. The corresponding figures were 17% for the U.K., 16.2% in France, 15.8% in Japan, and 9.3% in Germany. The share of hightechnology industries in the world markets was 32% in 2001 for the USA alone. This indicates that the world ICTs market is dominated by the USA and it is shared by some well-known European industrialized economies. Nonetheless, developing Arab countries can exploit some niche markets and compete with industrialized nations in the ICTs sector. For instance, Taiwan and South Korea transformed their economies over the years and committed to increasing the resources used in the ICTs sector. Thus, in the 1980, high-technology manufactures accounted for a mere 8.2% of Taiwan’s total manufacturing output and by 2001 this proportion reached an CIRST – Note de recherche 2007-02 | page 27.
Figure


Documents relatifs
Our main findings are: (i) in the 1990s Greece sustained heavy competitiveness losses in those sectors where she traditionally held a comparative advantage; (ii) Greek trade
Furthermore, experts from the following stakeholders have been consulted: the Ministry of Higher Education and Research, the Directorate of Immigration of the Ministry of
A Domain Mapping Matrix (DMM) approach was then proposed to help build a 5-matrix chain to describe the complete project ICV creation process and estimate possible ICV strategies
This study identified aspects of fundraising in two high schools in an urban area including: types of activities, amounts raised, distribution of funds, school administrator,
Refining the robustness framework with additional institutional analysis can be helpful to analyze multiple interdependencies, to foresee consequences of adaptation
Second , we depart from the standard practice of analyzing localization employing a single index, by performing a comparative study of different localization indices (E&G
In this relationship, for each country k and year t, the logarithm of the ICT capital coefficient (ratio of ICT capital stock to GDP in current
We consider the impact of the innovative strategies of firms on their reliance upon several external actors (viz. other enterprises of the group, suppliers, customers,
