HAL Id: hal-00298011
https://hal.archives-ouvertes.fr/hal-00298011
Submitted on 2 Jun 2008HAL is a multi-disciplinary open access
archive for the deposit and dissemination of sci-entific research documents, whether they are pub-lished or not. The documents may come from teaching and research institutions in France or abroad, or from public or private research centers.
L’archive ouverte pluridisciplinaire HAL, est destinée au dépôt et à la diffusion de documents scientifiques de niveau recherche, publiés ou non, émanant des établissements d’enseignement et de recherche français ou étrangers, des laboratoires publics ou privés.
Historical and simulated ecosystem carbon dynamics in
Ghana: land use, management, and climate
Z. Tan, L. L. Tieszen, E. Tachie-Obeng, S. Liu, A. M. Dieye
To cite this version:
Z. Tan, L. L. Tieszen, E. Tachie-Obeng, S. Liu, A. M. Dieye. Historical and simulated ecosystem carbon dynamics in Ghana: land use, management, and climate. Biogeosciences Discussions, European Geosciences Union, 2008, 5 (3), pp.2343-2368. �hal-00298011�
BGD
5, 2343–2368, 2008 Historical and simulated ecosystem carbon dynamics Z. Tan et al. Title Page Abstract Introduction Conclusions References Tables Figures ◭ ◮ ◭ ◮ Back Close Full Screen / EscPrinter-friendly Version Interactive Discussion Biogeosciences Discuss., 5, 2343–2368, 2008
www.biogeosciences-discuss.net/5/2343/2008/ © Author(s) 2008. This work is distributed under the Creative Commons Attribution 3.0 License.
Biogeosciences Discussions
Biogeosciences Discussions is the access reviewed discussion forum of Biogeosciences
Historical and simulated ecosystem
carbon dynamics in Ghana: land use,
management, and climate
Z. Tan1, L. L. Tieszen2, E. Tachie-Obeng3, S. Liu1,4, and A. M. Dieye4
1
Science Applications International Corp (SAIC), contractor to USGS Earth Resources Observation and Science Center, Sioux Falls, SD 57198, USA
2
USGS Earth Resources Observation and Science Center, Sioux Falls, SD 57198, USA
3
Ghana Environmental Protection Agency, Accra, Ghana
4
Geographic Information Science Center of Excellence, South Dakota State University, Brookings, SD 57007, USA
Received: 22 April 2008 – Accepted: 7 May 2008 – Published: 2 June 2008 Correspondence to: Z. Tan ([email protected])
BGD
5, 2343–2368, 2008 Historical and simulated ecosystem carbon dynamics Z. Tan et al. Title Page Abstract Introduction Conclusions References Tables Figures ◭ ◮ ◭ ◮ Back Close Full Screen / EscPrinter-friendly Version Interactive Discussion
Abstract
We used the General Ensemble biogeochemical Modeling System (GEMS) to simulate responses of natural and managed ecosystems to changes in land use, management, and climate for a forest/savanna transitional zone in central Ghana. Model results show that deforestation for crop production during the last century resulted in a substantial
re-5
duction in ecosystem carbon (C) stock from 135.4 Mg C ha−1in 1900 to 77.0 Mg C ha−1 in 2000, and in soil organic C stock within the top 20 cm of soil from 26.6 Mg C ha−1 to 21.2 Mg C ha−1. If no land use change takes place from 2000 through 2100, low and high climate change scenarios (increase in temperature and decrease in precipitation over time) will result in losses of soil organic C stock by 19% and 25%, respectively. A
10
low nitrogen (N) fertilization rate is the principal constraint on current crop production. An increase in N fertilization under the low climate change scenario would increase crop yield by 14% with 30 kg N ha−1 and by 38% with 60 kg N ha−1, leading to an in-crease in the average soil C stock by 12% and 29%, respectively, in all cropland by 2100. The results suggest that the climate changes in the future from current climate
15
conditions will not necessarily become a determinant control on ecosystem C fluxes and crop production, while a reasonable N fertilization rate is critical to achieve food security and agricultural sustainability in the study area through the 21st century, and current cropping systems could be optimized to make full use of the rainfall resource.
1 Introduction
20
Tropical terrestrial ecosystems across the African continent may play an increasing role in the global carbon (C) cycle with potentially significant climate change implications (Stephens et al., 2007), especially in sub-Saharan Africa where the role of land use change in controlling CO2 emissions and annual C budgets at regional and global
scale may be more critical than in any other regions (Houghton and Hackler, 2006).
25
BGD
5, 2343–2368, 2008 Historical and simulated ecosystem carbon dynamics Z. Tan et al. Title Page Abstract Introduction Conclusions References Tables Figures ◭ ◮ ◭ ◮ Back Close Full Screen / EscPrinter-friendly Version Interactive Discussion conversion of forest to cropland (Houghton and Hackler, 2001, 2006). In fact, human
activities such as cutting, fuelwood harvest, fertilization, and other factors affecting net primary productivity also play a critical role in regional and global C budgets (Nemani et al., 2003; Sankaran et al., 2005; Reich et al., 2006).
With a special emphasis on the fusion of land use change and land management
5
data into model simulations, Liu et al. (2004) used the General Ensemble biogeochem-ical Modeling System (GEMS) to simulate C dynamics in vegetation and soil in south-central Senegal from 1900 to 2100. They observed a decreasing trend in ecosystem C stock during the 20th century due mainly to deforestation, and predicted that such trends could continue throughout the 21st century and threaten food security and
effi-10
ciency of C sequestration projects. Houghton and Hackler (2006) used a bookkeeping model to estimate the annual C flux associated with historical changes in land use at a country scale across sub-Saharan Africa and suggested that the annual net C flux from changes in land use during the 20th century increased quickly and the total source was equivalent to about 15% of the global net C flux from land use change in the 1990s.
15
By combining data from regional and global inventories with the forward and inverse model analyses, Williams et al. (2007) evaluated C dynamics across the African con-tinent and suggested that Africa is a major source of interannual variability in global atmospheric CO2. Freitag et al. (2007) used an isotope mass balance approach to
es-timate the annual photosynthetic C fluxes over the woodland and savanna-dominated
20
ecosystems of the Volta River basin in West Africa and found that the annual photosyn-thetic C fluxes are associated with water vapor flux and heterotrophic soil respiration. As a result, the terrestrial ecosystem was evaluated as a small annual C source. On the other hand, with a progressive climate change, low soil nitrogen (N) supply is widely thought to be a major limitation to the response of biomass accumulation to climate
25
warming in the future, even though an elevated atmospheric CO2generally enhances the photosynthesis (Nemani et al., 2003; Reich et al., 2006), at least in C3plants.
Ghana is an essential agriculture-oriented country of sub-Saharan Africa where there has been a nutrient depletion of soil N, phosphorous, and potassium at 20–
BGD
5, 2343–2368, 2008 Historical and simulated ecosystem carbon dynamics Z. Tan et al. Title Page Abstract Introduction Conclusions References Tables Figures ◭ ◮ ◭ ◮ Back Close Full Screen / EscPrinter-friendly Version Interactive Discussion 40 kg ha−1yr−1 since the 1950s (Lal, 2007). In this study we selected the
Ejura-Sekyedumasi district of Ghana as a study area because it is a representative for-est/savanna transitional zone. We hypothesize that the changes in land use and land cover (LULC) primarily resulted in C sources at regional or national scales in Ghana during the 20th century. We also propose that the variations of interannual climate and
5
the low rates of N fertilization will be major forces driving terrestrial C dynamics and fluctuation of crop yields in the future. The objectives of this study are to (1) evaluate the spatial and temporal variations in ecosystem C stock at a regional scale in the 20th century and (2) simulate the sensitivity of C stock and crop production to changes in N fertilization with projected warming-drying scenarios through the 21st century.
10
2 Materials and methods
2.1 Study area
The Ejura-Sekyedumasi district in central Ghana (longitudes 1◦15′–1◦ 40′W and lati-tudes 7◦12′–7◦35′N) covers an area of 1244 km2
(Fig. 1). It represents the transitional zone from the moist forest in the south to savannas in the north of Ghana. The mean
15
annual minimum and maximum temperatures between 1971 and 2000 were 21.4◦C (±0.4) and 31.2◦C (±0.5), respectively. The mean annual precipitation was 1226 mm
(±185). The period from April through October had 80% of the annual precipitation and is defined as the wet season (corresponding to the growing season), and the pe-riod from November through March is defined as the dry season in this study. LULC
20
in the 20th century was dominated by several kinds of cultivated savannas (or agri-cultural lands) that were derived from open forest (<60% cover) and closed savanna woodland. Major crops include cassava (Manihot esculenta), cocoyam (Xanthosoma
BGD
5, 2343–2368, 2008 Historical and simulated ecosystem carbon dynamics Z. Tan et al. Title Page Abstract Introduction Conclusions References Tables Figures ◭ ◮ ◭ ◮ Back Close Full Screen / EscPrinter-friendly Version Interactive Discussion 2.2 Modeling system and simulations
2.2.1 General ensemble biogeochemical modeling system
GEMS (Liu et al., 2004) was developed for a better integration of well-established ecosystem models with various spatial databases for simulating biogeochemical cycles over large areas. It has been successfully used to simulate C dynamics in vegetation
5
and soil at various spatial scales. The CENTURY model (Parton et al., 1994) was se-lected as the underlying ecosystem biogeochemical model in GEMS because it has solid modules for simulating C dynamics at the ecosystem level and has been widely applied to various ecosystems worldwide.
Modeling architecture in this study was designed for three scenarios: initial C status
10
around 1900, impacts of human disturbances on C dynamics from 1900 to 2000, and C trends under a changing climate from 2000 to 2100. For initial C status around 1900, it was assumed that the ecosystem C flux and soil organic C (SOC) stock in 1900 were in equilibrium under natural vegetation, even though human presence could be traced back prior to 1900. Estimates of ecosystem C fluxes and SOC stock in
15
1900 were obtained by running GEMS for 1500 years under natural vegetation, climate information from 1971 to 2000, and contemporary soil and drainage conditions.
GEMS consists of three major components: single or multiple encapsulated ecosystem biogeochemical models, an automated stochastic parameterization system (AMPS), and an input/output processor (IOP). AMPS includes two major
interdepen-20
dent parts: the data search and retrieval algorithms and the data processing mech-anisms. The first part searches for and retrieves relevant information from various databases according to the keys provided by a joint frequency distribution (JFD) ta-ble. The data processing mechanisms downscale the aggregated information at the map-unit level to the field scale using a Monte Carlo approach. Once the data are
as-25
similated, they are injected into the modeling processes through the IOP, which updates the default input files with the assimilated data. Values of selected output variables are also written by the IOP to a set of output files after each model execution. The JFD
BGD
5, 2343–2368, 2008 Historical and simulated ecosystem carbon dynamics Z. Tan et al. Title Page Abstract Introduction Conclusions References Tables Figures ◭ ◮ ◭ ◮ Back Close Full Screen / EscPrinter-friendly Version Interactive Discussion grids are created from soil maps, time series of land cover images, and climate themes
at a cell size of 1 km by 1 km, which resulted in a total of 224 JFD cases in this study. 2.3 Input data for mode
The spatial simulation unit of GEMS is a JFD case. A JFD case contains single or multiple, homogeneous, connected or isolated land pixels that represent a unique
com-5
bination of values from the Geographic Information System (GIS) layers. The data for model input primarily consisted of monthly precipitation, monthly minimum and maxi-mum temperatures, LULC changes that were derived from three time series of Landsat images (1972, 1986, and 2000) provided by Ghana Environmental Protection Agency and Center for Remote Sensing and Geographical Information System (CERSGIS),
10
soil inventory taken from the FAO soil database, management data, and the District boundary. GEMS automates the processes of downscaling those data.
2.3.1 Ensemble simulations
GEMS generates site-level inputs with a Monte Carlo approach from regional datasets. Any single simulation of a JFD case is a unique combination of the spatial units in
15
common of all input GIS layers, so the output of a single simulation run of a JFD might be biased. Therefore, ensemble simulations of each JFD are executed to incorporate the variability of inputs. In general, the outputs of ensemble simulations become more stable when increasing the number of simulation runs. We made 20 repeat runs for each JFD case in this study, which was ensured to lead to stable outputs. Values of
20
selected output variables were written to a set of output files after each model execution and then aggregated for the study area using SAS Macros programming. Meanwhile, the simulation uncertainty was evaluated in terms of the coefficient of variation with all model outputs.
BGD
5, 2343–2368, 2008 Historical and simulated ecosystem carbon dynamics Z. Tan et al. Title Page Abstract Introduction Conclusions References Tables Figures ◭ ◮ ◭ ◮ Back Close Full Screen / EscPrinter-friendly Version Interactive Discussion 2.4 Scenarios for the 21st Century
2.4.1 Climate change scenarios
The Model for the Assessment of Greenhouse Induced Climate Change (MAGICC) predicts an increase in mean daily temperature from 2.5◦C to 3.2◦C and a decrease in annual precipitation by about 9 to 27% from 1990 to 2100 in Ghana (EPA, 2000). To
5
evaluate the impacts of future climate change on ecosystem C dynamics during the 21st century, we set three climate change scenarios for the study area based on the predictions provided by Ghana EPA (2000) and Hulme et al. (2001).
1. No Climate Change (NCC): the average values of precipitation and minimum and maximum temperatures from 1971 to 2000 are supposed to stay for the 21st
10
century.
2. Low Climate Change (LCC): the projected minimum changes in precipitation and minimum and maximum temperatures by 2100 are proportionally allocated to each month based on the average monthly values from 1971 to 2000 (i.e., base-lines). Under this scenario, the annual precipitation will decrease by 110 mm in
15
2100, and the minimum and maximum temperatures will increase by 2.7◦C and 2.2◦C, respectively.
3. High Climate Change (HCC): similar to LCC, under this scenario, the annual pre-cipitation will have a reduction of 234 mm by 2100, and the minimum and maxi-mum temperatures will increase by 4.3◦C and 3.4◦C, respectively.
20
2.4.2 Nitrogen fertilization rates
Besides manure, N fertilizer is the dominant N source applied to crops in Ghana. The average N fertilizer application rate across the country from 1970 to 2000 was about 4 kg N ha−1yr−1(EarthTrends, 2003). Therefore, we set three N fertilization scenarios for all crops through the 21st century.
BGD
5, 2343–2368, 2008 Historical and simulated ecosystem carbon dynamics Z. Tan et al. Title Page Abstract Introduction Conclusions References Tables Figures ◭ ◮ ◭ ◮ Back Close Full Screen / EscPrinter-friendly Version Interactive Discussion 1. N4: the average N fertilizer application rate of 4 kg N ha−1yr−1 is supposed to
continue through the 21st century.
2. N30: the N fertilizer rate increases to 30 kg N ha−1yr−1after 2000.
3. N60: the N fertilizer rate increases to 60 kg N ha−1yr−1after 2000.
Model simulations for each scenario addressed above were made with an
assump-5
tion that there is no LULC change.
3 Results and discussion
3.1 Changes in land use and land cover
The LULC types and their changes across the district are presented in Table 1. As-suming all land was covered by open forest (22%) and closed savanna woodland (78%)
10
before 1900, by the year 2000 these classes accounted for only 4.1% and 2.5% of the land area, respectively, due to the cultivation for agriculture and the change or degra-dation to savannas as listed in Table 1.
As a result, the cultivated savanna lands (including closed, open, and widely open cultivated savanna classes) have become a predominant LULC type, occupying 70.4%
15
of all land. About 13.5% of all land area was directly involved in LULC change between 1972 and 2000, with major conversions from open forest and closed savanna wood-land to open and closed cultivated savannas. The major forces driving these changes included extensive cultivation, wildfires, charcoal production, and traditional slash and burn farming methods (Allotey and Tachie-Obeng, 2006)
20
3.2 Carbon dynamics in the 20th century
At the regional scale, there was a significant reduction in ecosystem C stock (i.e., the sum of live and dead aboveground and belowground biomass C and SOC in the top
BGD
5, 2343–2368, 2008 Historical and simulated ecosystem carbon dynamics Z. Tan et al. Title Page Abstract Introduction Conclusions References Tables Figures ◭ ◮ ◭ ◮ Back Close Full Screen / EscPrinter-friendly Version Interactive Discussion 20 cm soil) during the 20th century, from 135.4 Mg C ha−1 in 1900 to 77 Mg C ha−1 in
2000. The spatial and temporal trends are illustrated in Fig. 2. A similar change trend was observed across central Senegal in the 20th century by Liu et al. (2004) using the same simulation approach. Such a reduction could be mainly attributed to the substan-tial removal of aboveground biomass by deforestation for agricultural use. For example,
5
the living biomass was reduced from 100 Mg C ha−1in 1900 to 52.4 Mg C ha−1in 2000,
accounting for 80% of the total reduction in ecosystem C stock, which is comparable to the contribution (88%) estimated by Liu et al. (2004) for south-central Senegal. Mean-while, the total SOC stock decreased from 26.6 Mg C ha−1in 1900 to 21.2 Mg C ha−1in
2000, representing a reduction of about 21%. This kind of SOC loss was directly
asso-10
ciated with cultivation-enhanced emissions after deforestation and is within the range of the reduction rate (20–40%) reported by other investigators on the conversion of forest to croplands (Donigian et al., 1994; Paul et al., 1997; Buyanovsky and Wagner, 1998; DeFries et al., 2002; Houghton, 2003) because the interpretation of time-series Landsat images indicate that agricultural use increased from 7% to 23% between 1972
15
and 2000, while the woody savanna was reduced from 92% to 76%. More than 50% of the croplands had been under mechanized farming. Houghton (2003) concluded that deforestation is the largest contributor to tropical land use emissions, and C losses through deforestation tend to be irreversible in Africa.
However, the dynamics of SOC and the magnitude of SOC loss varied significantly
20
with LULC types. As illustrated in Fig. 3, open forest, savanna woodland, and riverine savanna showed declining trends in SOC stock over the 20th century but with little in-terannual variation. Twenty-six percent of the SOC stock was lost from the open forest during the 20th century (mainly in the first 40 years) probably due to preferable de-forestation of the flat and fertile forested land for cultivation. Very small declines were
25
simulated for the savanna woodland and riverine savanna. On the contrary, the dynam-ics of SOC showed noticeable interannual variations across the herb/bush savanna and all cultivated savannas, especially during the period prior to 1970. We attribute these variations to the following two reasons. First, in the absence of documented LULC data
BGD
5, 2343–2368, 2008 Historical and simulated ecosystem carbon dynamics Z. Tan et al. Title Page Abstract Introduction Conclusions References Tables Figures ◭ ◮ ◭ ◮ Back Close Full Screen / EscPrinter-friendly Version Interactive Discussion prior to 1972, the changes from either the native savanna woodland or the open forest
to any other land uses before 1972 were randomly determined by GEMS, while the initial SOC stock levels considerably differed between the savanna woodland and the open forest. Second, variations in cropping system (or crop rotation) and management practices may play an important role. For example, because of differences in biomass
5
production among cocoyam, cassava, and maize cropping systems, any changes in cropping systems could greatly contribute to the variation in SOC stock at an annual time scale. Averaging for all cropping systems, there was a reduction of 35% SOC by the year 2000.
3.3 Ecosystem C budgets associated with projected climate change scenarios
10
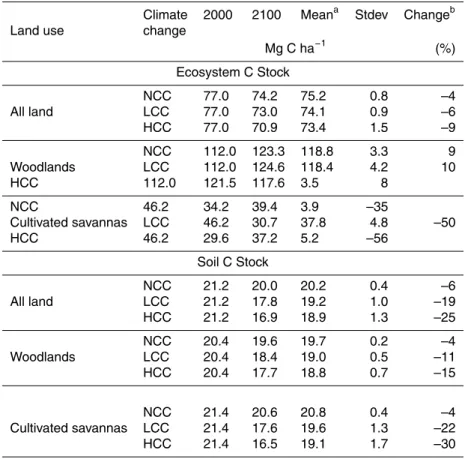
We did simulations for each projected climate change scenario with an assumption that there are no changes in LULC and land management and that the fertilization rate of 4 kg N ha−1remains through the 21st century, and the results are presented in Table 2. There are significant differences in both ecosystem C and SOC stocks among three scenarios, but by the year 2100, the reduction rate of SOC stock is 13% and 16%
15
higher than that of ecosystem C under LCC and HCC, respectively. In other words, SOC (particularly in the cultivated savannas) is more sensitive to the climate change than aboveground biomass production. The trend of declining aboveground biomass production during the 21st century also suggests that a generally positive response of photosynthesis to climate change (or elevated atmospheric [CO2] concentration) is
20
not necessarily true in the study area, especially for the cultivated savannas, probably due to other more critical constraints such as the low soil N availability (see below). The spatiotemporal patterns of both ecosystem C and SOC budgets under the LCC for selected years are illustrated in Fig. 4.
BGD
5, 2343–2368, 2008 Historical and simulated ecosystem carbon dynamics Z. Tan et al. Title Page Abstract Introduction Conclusions References Tables Figures ◭ ◮ ◭ ◮ Back Close Full Screen / EscPrinter-friendly Version Interactive Discussion 3.4 Responses of crop grain yields to N fertilization
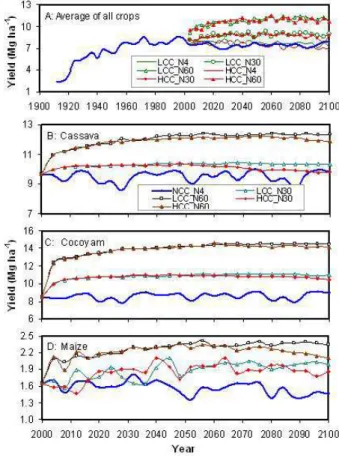
As illustrated by Fig. 5a, there was a continuous increase in the average grain yields of all crops during the 20th century, varying between 6.4 and 9.0 Mg ha−1yr−1 af-ter 1970. Crop yields over the 21st century depend significantly upon the applica-tion rate of N fertilizers. The average yield over the century can be 7.7, 8.8, and
5
10.6 Mg ha−1yr−1 with application of 4, 30, and 60 kg N ha−1yr−1 under LCC, and 7.4, 8.5, and 10.5 Mg ha−1yr−1under HCC. The responses of crop yield to N fertilization
vary among crop species. Our simulations focused on three major crops: cassava, co-coyam, and maize (Fig. 5b, c, and d). If no climate change and the N4 fertilization rate (NCC N4) continue through the 21st century, the yield of maize may decrease by 11%
10
at the end of this century but little change happens to cocoyam and cassava despite interannual variations. Compared to the NCC N4, the average yield under LCC (or similar under HCC) increases 18% with N30 and 42% with N60 for maize, accordingly, 25% and 60% for cocoyam, and 7% and 25% for cassava. As indicated by Fig. 5, no significant differences in crop yield are observed between the two climate scenarios,
15
but significant differences are found with different N application rates. Generally, the response of crop yield to the N60 application rate is cumulative (increase) during the first 30 years and remains consistent for about another 40 years. These results sug-gest that the response of crop yield to N fertilization is much stronger than to climate change. This may be attributed to the low baseline soil N content. The average
to-20
tal soil N content for all cropping systems in 2000 was estimated at 1.95 Mg N ha−1. Onumah and Coulter (2000) reported that the crop yield in the transitional zone rose to 4.8 Mg ha−1 with application of fertilizers but dropped to 1.5–2.0 Mg ha−1 without fertilizers. As recommended by Adiku et al. (2004) for a sustainable production in sa-vanna zones, our results also suggest that a modest N fertilization rate (for example
25
30 kg N ha−1yr−1) would be necessary to ensure food security and healthy cropping ecosystem performance across the Ejura-Sekyedumasi district.
BGD
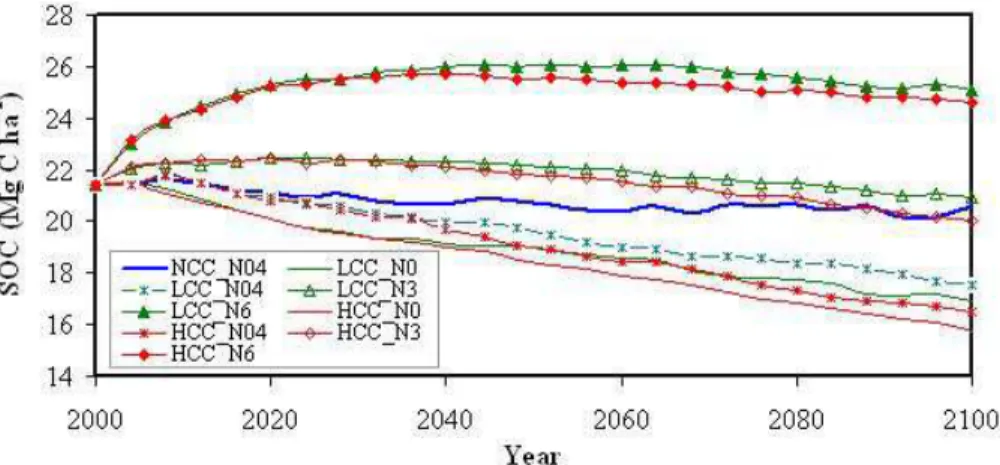
5, 2343–2368, 2008 Historical and simulated ecosystem carbon dynamics Z. Tan et al. Title Page Abstract Introduction Conclusions References Tables Figures ◭ ◮ ◭ ◮ Back Close Full Screen / EscPrinter-friendly Version Interactive Discussion 3.5 Dynamics of soil C stock within cropping systems as related to N fertilization
Figure 6 shows that the SOC budget averaged for all cropping systems (or culti-vated savannas) remains approximately neutral if the NCC-N04 continues through the 21st century. However, no N fertilization will lead to soil C sources at rates of 35 and 47 kg C ha−1yr−1 under LCC and HCC, respectively. Either averaging at the
re-5
gional scale or accounting for individual cropping systems, increasing N fertilization rate can enhance sequestering atmospheric C into soil, depending on N fertilization rates and projected climate change scenarios. In our case, the N30 fertilization rate can marginally offset the decomposition of SOC that results from the projected climate change, with a C sink of 5 kg C ha−1yr−1 under LCC and a C source of 4 kg C ha−1yr−1
10
under HCC. The N60 application rate can help all cropping systems turn out to be a C sink of 50 kg C ha−1yr−1 under LCC and 45 kg C ha−1yr−1under HCC. Note from Fig. 6 that the effects of N fertilizers on maintaining soil fertility at low N fertilization rates and enhancing SOC sequestration at high N fertilization rates seem to be cumulative for the first several decades but deteriorate afterwards. The different projected climate change
15
scenarios result in significant differences in SOC stock with no and very low N fertiliza-tion only. But such differences become insignificant with increasing N fertilizafertiliza-tion rates regardless of climate change scenarios.
Nitrogen fertilization can effectively increase crop production and therefore leads to an increase in SOC stock, or N fertilization can at least offset some SOC losses from
20
tillage and harvesting. However, application of N fertilizers in croplands may enhance N2O (one of greenhouse gases) emissions (Kroeze et al., 1999; Reiners et al., 2002). However, low to modest rates of N fertilization in this study area are not expected to lead to large N2O emissions because crops have a high N use efficiency in low available
N soils.
BGD
5, 2343–2368, 2008 Historical and simulated ecosystem carbon dynamics Z. Tan et al. Title Page Abstract Introduction Conclusions References Tables Figures ◭ ◮ ◭ ◮ Back Close Full Screen / EscPrinter-friendly Version Interactive Discussion
4 Uncertainty analysis
Based on the well-established CENTURY SOM model (Parton, 1994), GEMS simu-lates C spatiotemporal dynamics using the JFD (joint frequency distribution) of major variables driving the C biogeochemical cycle (Liu et al., 2004). Uncertainties of input data are propagated to simulated results through ensemble Monte Carlo simulations.
5
As addressed previously, GEMS simulations were processed for each randomly picked combination (or case) of specific land cover and soil taxon with respective inputs re-trieved from JFD files, and each case was run 20 times to create outputs weighted by the area proportion of each case with standard deviations. Therefore, the inputs and outputs should appropriately represent the spatial and temporal heterogeneity of
10
the driving variables. Meanwhile, the uncertainty of simulations was evaluated along with outputs and expressed in terms of the coefficient of variation. More importantly, we used the field observation data of the ecosystem C and SOC stocks and the grain yields of major crops as references to verify the corresponding outputs and repeatedly ran model simulations by adjusting parameters after each run until the outputs matched
15
the field measurements as closely as possible. Therefore, the results presented in this paper should represent the general patterns of C dynamics across the study area.
5 Sensitivity of SOC dynamics and crop yields to projected scenarios
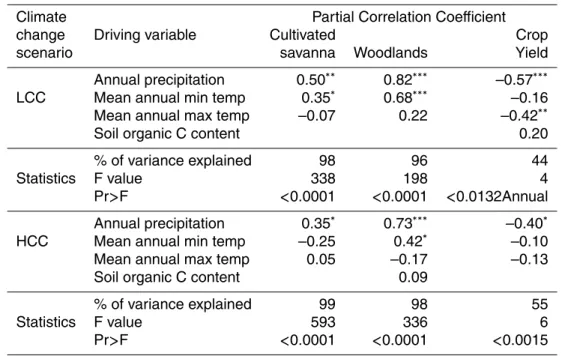
We applied the univariate multiple regression model (SAS Institute, 2003) to identify the correlations of either the SOC budget or crop yield to climate variables. The statistics
20
presented in Table 3 indicate that SOC stock during the 21st century will significantly depend on the changes either in precipitation, temperature, or in both if there is no change in land use and management. The sensitivity, however, depends on the na-ture of ecosystem and climate change scenario. Generally, variation in precipitation determine the SOC budgets in both natural and managed ecosystems, An increase
25
BGD
5, 2343–2368, 2008 Historical and simulated ecosystem carbon dynamics Z. Tan et al. Title Page Abstract Introduction Conclusions References Tables Figures ◭ ◮ ◭ ◮ Back Close Full Screen / EscPrinter-friendly Version Interactive Discussion On the other hand, crop yields show significantly differences in response to these
cli-mate variables. First, crop yields are much less rely on clicli-mate variables than do SOC budgets, implying more critical drivers behind, of which N supply rate must be one as indicated by the simulation results from N fertilization scenarios. Second, less precipi-tation probably favors to increase grain yields of existing crop species because current
5
precipitation during the growing season is high enough, whereas continuing warming likely adversely impact crop production despite not significant (see Fig. 5 and Table 3). Therefore the climate changes in the future from current climate conditions will not necessarily become a determinant control on ecosystem C fluxes and crop production in the study area. In other words, it is not necessary to grow drought-resistant crops
10
there.
6 Summary
Ghana has distinct vegetation zones from moist forest in the southwest to Sudan sa-vanna in the northeast of the country. These diverse land resources are under tremen-dous pressure to meet population growth. The tropical moist forest has degraded to
15
secondary forest, and the savannas and grasslands either have been transformed to open cultivated savanna or are degrading and at risk of desertification. The ecosystem C and SOC budgets are sensitive to climate change, whereas crop yields are more strongly influenced by N fertilization rate and less influenced by climate change, de-pending on the requirements of individual crop species. In general, we conclude:
20
1. Deforestation for agricultural use has resulted in a substantial reduction in both ecosystem C and SOC stocks across the Ejura-Sekyedumasi district of Ghana during the 20th century.
2. The adverse impacts of climate change on SOC stock can be offset by N fertiliza-tion at 30 kg N ha−1yr−1or higher rates on croplands.
BGD
5, 2343–2368, 2008 Historical and simulated ecosystem carbon dynamics Z. Tan et al. Title Page Abstract Introduction Conclusions References Tables Figures ◭ ◮ ◭ ◮ Back Close Full Screen / EscPrinter-friendly Version Interactive Discussion 3. Low N fertilization rate is the principal constraint on current crop production, and
to increase N fertilization would be a critical adaptive management measure to achieve food security and agricultural sustainability in the 21st century.
4. The climate changes in the future from current climate conditions will not neces-sarily become a determinant control on ecosystem C fluxes and crop production
5
in the study area, and current cropping systems could be optimized to make full use of the rainfall resource.
Acknowledgements. This is a contribution of SEMSOC (AEGP00030001300), funded by the US Agency for International Development (USAID)/Climate Change program, Bureaus for Eco-nomic Growth, Agriculture, and Trade (EGAT) and Africa Bureau. Research was integrated 10
with the Geographic Analysis and Monitoring (GAM) and the Earth Surface Dynamics pro-grams of the USGS. The authors appreciate Norman Bliss for valuable technical review and thank Zhengpeng Li for assistance in model implementation.
References
Adiku, S. G. K., Rose, C. W., Gabric, A., Braddock, R. D., Carberry, P. S., and McCown, R. 15
L.: An evaluation of performance of maize and cowpea in sole and intercropping systems at two savanna zones of Ghana: A simulation study, ISHS Acta Horticulturae 476, International Symposium on Applications of Modelling as InnovativeTechnique in the Agri-Food Chain. MODEL-IT, 2004.
Allotey, A. N. and Tachie-Obeng, E.: Agro-Ecological and Land-Cover Trends in Ghana. Un-20
published Project Report, AGRHYMET Regional Centre, Niamey Niger, 2006.
Buyanovsky, G. A. and Wagner, G. H.: Carbon cycling in cultivated land and its global signifi-cance, Global Change Biology, 4, 131–141, 1998.
DeFries, R. S., Houghton, R. A., Hansen, M. C., Field, C. B., Skole, D., and Townshend, J.: Carbon emissions from tropical deforestation and regrowth based on satellite observations 25
for the 1980s and 1990s, Proc Natl. Acad. Sci. USA, 99, 14256–14261, 2002.
Donigian Jr., A. S., Barnwell, T. O., Jackson, R. B., Partwardhan, A. S., Weinreich, K. B., Rowell, A. L., Chinnaswamy, R. V., and Cole, C. V.: Assessment of alternative management practices
BGD
5, 2343–2368, 2008 Historical and simulated ecosystem carbon dynamics Z. Tan et al. Title Page Abstract Introduction Conclusions References Tables Figures ◭ ◮ ◭ ◮ Back Close Full Screen / EscPrinter-friendly Version Interactive Discussion
and policies affecting soil carbon in agroecosystems of central United States, Publication No. EPA/600/R-94/067, US Environmental Protection Agency, Athens, Georgia, 1994. EarthTrends: Agriculture and food-Ghana, EarthTrends Country Profile, available at http:
//earthstrends.wri.org/, 2003.
Environmental Protection Agency (EPA): Ghana’s Initial National Communication, undern the 5
United Nations Framework Convention on Climate Change, EPA, Ghana, 122 pp., 2000. Freitag, H., Ferguson, P. R., Dubois, K., Hayford, E. K., von Vordzogbe, V., and Veizer, J.:
Water and carbon fluxes from savanna ecosystems of the Volta River watershed, West Africa, Global and Planetary Change, 61, 3–14, doi:10.1016/j.gloplacha.2007.08.003, 2008. Houghton, R. A.: Revised estimates of the annual net flux of carbon to the atmosphere from 10
changes in land use and land management 1850–2000, Tellus Ser B-Chem Phys Meteorol., 55, 378–390, 2003.
Houghton, R. A. and Hackler, J. L.: Carbon flux to the atmosphere from land-use changes: 1850 to 1990, Rep. ORNL/CDIAC-131 NDP-050/R1, US Dept. of Energy, Oak Ridge Natl. Lab., Oak Ridge, Tenn., 2001.
15
Houghton, R. A. and Hackler, J. L.: Emissions of carbon from land use change in sub-Saharan Africa, J. Geophys. Res., 111, G02003, doi:10.1029/2005JG000076, 2006.
Hulme, M., Doherty, R., Ngara, T., New, M., and Lister, D.: African climate change: 1900–2100, Climate Research, 17, 145–168, 2001.
Johnson, D. W., Shan, J., Morris, L. A., Van, L. D. H., Kapeluck, P. R., Knoepp, J. D., and Swank, 20
W. T.: Effects of forest management on soil carbon: results of some long-term resampling studies, Environmental Pollution, 116, S201–208, 2002.
Kroeze, C., Mosier, A., and Bouwman, L.: Closing the global N2O budget: a retrospective analysis 1500–1994, Global Biogeochem. Cy., 13, 1–8, 1999.
Lal, R.: Tragedy of the Global Commons: Soil, Water, and Air, CSA (Crops, Soils, Agronomy) 25
News, 52, 10–11, 2007.
Liu, S., Kair ´e, M., Wood, E., Dialloc, O., and Tieszen, L. L.: Impacts of land use and climate change on carbon dynamics in south-central Senegal, J. Arid Environments, 59, 583–604, 2004.
Nemani, R. R., Keeling, C. D., Hashimoto, H., Jolly, W. M., Piper, S. C., Tucker, C. J., Myneni, R. 30
B., and Running, S. W.: Climate-driven increases in global terrestrial net primary production from 1982 to 1999, Science, 300, 1560–1563, 2003.
BGD
5, 2343–2368, 2008 Historical and simulated ecosystem carbon dynamics Z. Tan et al. Title Page Abstract Introduction Conclusions References Tables Figures ◭ ◮ ◭ ◮ Back Close Full Screen / EscPrinter-friendly Version Interactive Discussion
Paper, NRI, Chatham, UK, 2000.
Parton, W. J., Ojima, D. S., and Schimel, D. S.: Environmental change in grasslands: assess-ment using models, Clim. Change, 28, 111–141, 1994.
Paul, E. A., Paustian, K., Elliot, E. T., and Cole, C. V.: Soil Organic Matter in Temperate Agroecosystems: Long-Term Experiments in North America, CRC Press, Inc., Boca Raton, 5
Florida, 1997.
Reich, P. B., Hobbie, S. E., Lee, T., Ellsworth, D. S., West, J. B., Tilman, D., Knops, J. M. H., Naeem, S., and Trost, J.: Nitrogen limitation constrains sustainability of ecosystem response to CO2, Nature (Letters), 440, 922–925, doi:10.1038/nature04486, 2006.
Reiners, W. A., Liu, S., Gerow, K. G., Keller, M., and Schimel, D. S.: Historical and fu-10
ture land use effects on trace gas emissions using an ensemble modeling approach: Costa Rica’s Caribbean Lowlands as an example, Global Biogeochem. Cy., 16, 1068, doi:10.1029/2001GB001437, 2002.
Sankaran, M., Hanan, N. P., Scholes, R. J., and others: Determinants of woody cover in African savannas, Nature (Letters), 438, 846–849, 2005.
15
SAS Institute: SAS User’s Guide, Release 9.1, SAS Institute, Inc., Cary, NC, 2003.
Stephens, B. B., Gurney, K. R., Tans, P. P., Sweeney, C., Peters, W., Bruhwiler, L., Ciais, P., Ramonet, M., Bousquet, P., Nakazawa, T., Aoki, S., Machida, T., Inoue, G., Vinnichenko, N., Lloyd, J., Jordan, A., Heimann, M., Shibistova, O., Langenfelds, R. L., Steele, L. P., Francey, R. J., Denning, A. S.: Weak northern and strong tropical land carbon uptake from vertical pro-20
files of atmospheric CO2, Science, 316(5832), 1732–1735, doi:10.1126/science.1137004, 2007.
Tan, Z., Liu, S., Johnston, C. A., Liu, J., and Tieszen, L. L.: Analysis of ecosystem controls on soil carbon source-sink relationships in the northwest Great Plains, Global Biogeochem. Cy., 20, GB4012, doi:10.1029/2005GB002610, 2006.
25
Williams, C. A., Hanan, N. P., Neff, J. C., Scholes, R. J., Berry, J. A., Denning, A. S., and Baker, D. F.: Africa and the global carbon cycle, Carbon Balance and Management, 2(3), 1–13, doi:10.1186/1750-0680-2-3, 2007.
BGD
5, 2343–2368, 2008 Historical and simulated ecosystem carbon dynamics Z. Tan et al. Title Page Abstract Introduction Conclusions References Tables Figures ◭ ◮ ◭ ◮ Back Close Full Screen / EscPrinter-friendly Version Interactive Discussion Table 1. Land use and land cover type, area, and change rate across the Ejura-Sekyedumasi
district from 1972 to 2000.
1972 2000 Change Change by 2000
Land use and land cover type Code
km2 % km2 % km2 %/yr Plantation cover 610 27 2.2 49 3.9 22 0.06 Moderately dense herb/bush 621/622 207 16.6 220 17.7 13 0.04 Open forest (<60%) 640 106 8.5 51 4.1 –55 –0.16 Closed savanna woodland 650 71 5.7 31 2.5 –40 –0.11 Riverine savanna vegetation 660 82 6.6 42 3.4 –40 –0.11 Closed cultivated savanna 850 50 4.0 100 8.0 50 0.14 Open cultivated savanna 860 463 37.2 541 43.5 78 0.22 Widely open cultivated savanna 870 226 18.2 193 15.5 –33 –0.09
Settlement 500 12 1.0 17 1.4 5 0.01
BGD
5, 2343–2368, 2008 Historical and simulated ecosystem carbon dynamics Z. Tan et al. Title Page Abstract Introduction Conclusions References Tables Figures ◭ ◮ ◭ ◮ Back Close Full Screen / EscPrinter-friendly Version Interactive Discussion Table 2. Consequences of projected climate change to ecosystem carbon and soil organic
carbon (SOC) stocks at the regional scale.
Climate 2000 2100 Meana Stdev Changeb
Land use change
Mg C ha−1 (%) Ecosystem C Stock NCC 77.0 74.2 75.2 0.8 –4 All land LCC 77.0 73.0 74.1 0.9 –6 HCC 77.0 70.9 73.4 1.5 –9 NCC 112.0 123.3 118.8 3.3 9 Woodlands LCC 112.0 124.6 118.4 4.2 10 HCC 112.0 121.5 117.6 3.5 8 NCC 46.2 34.2 39.4 3.9 –35 Cultivated savannas LCC 46.2 30.7 37.8 4.8 –50 HCC 46.2 29.6 37.2 5.2 –56 Soil C Stock NCC 21.2 20.0 20.2 0.4 –6 All land LCC 21.2 17.8 19.2 1.0 –19 HCC 21.2 16.9 18.9 1.3 –25 NCC 20.4 19.6 19.7 0.2 –4 Woodlands LCC 20.4 18.4 19.0 0.5 –11 HCC 20.4 17.7 18.8 0.7 –15 NCC 21.4 20.6 20.8 0.4 –4 Cultivated savannas LCC 21.4 17.6 19.6 1.3 –22 HCC 21.4 16.5 19.1 1.7 –30
aAverage for the 21st century.
bChange percentage of carbon stock by the year 2100 based on that in 2000.
BGD
5, 2343–2368, 2008 Historical and simulated ecosystem carbon dynamics Z. Tan et al. Title Page Abstract Introduction Conclusions References Tables Figures ◭ ◮ ◭ ◮ Back Close Full Screen / EscPrinter-friendly Version Interactive Discussion Table 3. Partial correlations of both SOC stock and crop yields to climate variables under low
and high climate change scenarios projected for the 21st century.
Climate Partial Correlation Coefficient change Driving variable Cultivated Crop scenario savanna Woodlands Yield Annual precipitation 0.50∗∗ 0.82∗∗∗ –0.57∗∗∗
LCC Mean annual min temp 0.35∗ 0.68∗∗∗ –0.16
Mean annual max temp –0.07 0.22 –0.42∗∗
Soil organic C content 0.20
% of variance explained 98 96 44
Statistics F value 338 198 4
Pr>F <0.0001 <0.0001 <0.0132Annual Annual precipitation 0.35∗ 0.73∗∗∗ –0.40∗
HCC Mean annual min temp –0.25 0.42∗ –0.10
Mean annual max temp 0.05 –0.17 –0.13 Soil organic C content 0.09
% of variance explained 99 98 55
Statistics F value 593 336 6
Pr>F <0.0001 <0.0001 <0.0015 LCC, low climate change scenario; HCC, high climate change scenario.
∗,∗∗, and∗∗∗
BGD
5, 2343–2368, 2008 Historical and simulated ecosystem carbon dynamics Z. Tan et al. Title Page Abstract Introduction Conclusions References Tables Figures ◭ ◮ ◭ ◮ Back Close Full Screen / EscPrinter-friendly Version Interactive Discussion Fig. 1. The Ejura-Sekyedumasi district in central Ghana, representing a forest/savanna
BGD
5, 2343–2368, 2008 Historical and simulated ecosystem carbon dynamics Z. Tan et al. Title Page Abstract Introduction Conclusions References Tables Figures ◭ ◮ ◭ ◮ Back Close Full Screen / EscPrinter-friendly Version Interactive Discussion Fig. 2. Spatiotemporal trends of ecosystem C and soil organic C stocks across the
BGD
5, 2343–2368, 2008 Historical and simulated ecosystem carbon dynamics Z. Tan et al. Title Page Abstract Introduction Conclusions References Tables Figures ◭ ◮ ◭ ◮ Back Close Full Screen / EscPrinter-friendly Version Interactive Discussion Fig. 3. Soil organic carbon (SOC) dynamics associated with major LULC types in the
BGD
5, 2343–2368, 2008 Historical and simulated ecosystem carbon dynamics Z. Tan et al. Title Page Abstract Introduction Conclusions References Tables Figures ◭ ◮ ◭ ◮ Back Close Full Screen / EscPrinter-friendly Version Interactive Discussion Fig. 4. Spatiotemporal trends of ecosystem C and SOC stocks under low climate change
BGD
5, 2343–2368, 2008 Historical and simulated ecosystem carbon dynamics Z. Tan et al. Title Page Abstract Introduction Conclusions References Tables Figures ◭ ◮ ◭ ◮ Back Close Full Screen / EscPrinter-friendly Version Interactive Discussion Fig. 5. Simulated responses of crop yields to N fertilization rates under projected climate
change scenarios from 2000 to 2100 (NCC, LCC, and HCC represent no climate change with normal N fertilization rate, low climate change, and high climate change scenarios, respectively. N4, N30, and N60 refer to N fertilization rates of 4, 30, and 60 kg N ha−1yr−1, respectively. Solid
BGD
5, 2343–2368, 2008 Historical and simulated ecosystem carbon dynamics Z. Tan et al. Title Page Abstract Introduction Conclusions References Tables Figures ◭ ◮ ◭ ◮ Back Close Full Screen / EscPrinter-friendly Version Interactive Discussion Fig. 6. Simulated responses of soil organic carbon stock (SOC) in cropping systems to N
fertil-ization rate and climate change scenarios from 2000 to 2100. NCC, LCC, and HCC represent no climate change, low, and high climate change scenarios, respectively. N4, N30, and N60 refer to N fertilization rates of 4, 30, and 60 kg N ha−1yr−1, respectively.