Dostie : Corresponding author. Address : Institute of Applied Economics, HEC Montréal, 3000 chemin de la Côte-Sainte-Catherine, Montréal, QC H3T 2A7; Phone: 514 340-6453; Fax: 514 340-6469; CIRANO, CIRPÉE and IZA
Léger : Institute of Applied Economics, HEC Montréal, CIRANO and CIRPÉE
We acknowledge financial support from the Fonds pour le développement et la reconnaissance des compétences de
la main-d’oeuvre of the Quebec government through the Applied Research Grant Program and from HEC Montréal.
We thank Lene Kromann and Olivier Quirion for research assistance and the team from the Applied Research Grant
Program for detailed comments on previous versions of this paper.
Cahier de recherche/Working Paper 11-36
Firm-Sponsored Classroom Training: is it Worth it for Older Workers ?
Benoit Dostie
Pierre Thomas Léger
We use longitudinal linked employer-employee data and find that the probability of participating in firm-sponsored classroom training diminishes rapidly for workers aged 45 years and older. Although the standard human capital investment model predicts such a decline, we also consider the possibility that returns to training decline with age. Taking into account endogenous training decisions, we find that the training wage premium diminishes only slightly with age. However, estimates of the impact of training on productivity decrease dramatically with age, suggesting that incentives for firms to invest in classroom training are much lower for older workers.
Keywords: Firm-Sponsored Classroom Training, Wages, Productivity, Aging, Linked
Employer-Employee Data
1. Introduction
One of the consequences of a continually increasing life expectancy is its effect on work and retirement decisions. Even though many individuals now stay in the work-force well into their 60s and 70s, many abilities valued in the workplace decline with age (especially after 55 years of age).1 One of the ways in which firms and workers may
attempt to increase worker productivity, or at least slow its decline with age, is through firm-sponsored classroom (FSC) training.2 This is in fact one of the key
recommen-dation of OECD (2006) as part of a synthesis of 21 country-specific reports on aging and employment policies.3 However, previous research suggests that the incidence of
FSC training declines with age (Frazis, Gittleman, and Joyce (2000)) - begging the question as to why firms do not use such a strategy to counteract the aforementioned productivity decline.
There are two basic theories as to why FSC training might decline with age. The main and first one explains lower training incidence as due to a shorter amortization period of investments. In a Becker-type model, human capital investments should occur early on in an individual’s life in order to maximize the returns from such investments over a maximum amount of time.
Second, it is possible that FSC training declines with age simply because its con-temporaneous returns also decline with age. That is, younger workers may benefit more from training than their older counterparts at any moment in time. This could be due to decreased ability to learn with age or simply because younger workers have more to learn from the current forms of FSC training than older workers. Either way, if such is the case, increasing training for older workers will unlikely yield meaningful productivity gains. That is, firms may be optimally setting FSC training at lower rates for older workers simply because of its decreased returns. If such is the case, subsidies to such programs may encourage inefficiently high levels of training for certain groups. In this paper, we start by quantifying the relationship between age and the prob-ability of receiving FSC training. Next, we estimate age-specific (contemporaneous)
1See Skirbekk (2004) for an overview of the literature and Göbel and Zwick (2009) and Cardoso,
Guimaraes, and Varejão (2010) for recent examples.
2Surveys generally distinguish between on-the-job and classroom training. However, studies comparing
the productivity impact of classroom versus job training find low or negligible impact of on-the-job training on productivity. For example, Zwick (2005) finds that formal external and internal courses have a positive impact on productivity while on-the-job training has a negative impact. Barrett and O’Connell (2001) find positive impact for general training but not for specific training. Finally, Black and Lynch (1996) find a positive impact of training only in the case of formal off-the-job training in the manufacturing sector. Hence we focus on classroom training.
returns of FSC training on both the worker’s wage as well as the worker’s productivity - neither of which has been estimated previously in the literature to our knowledge. We estimate the wage-returns using an econometric specification that takes advantage of the panel and linked nature of the data set by incorporating both worker and workplace unobserved heterogeneity. By allowing both sources of heterogeneity to be correlated with the training decision, we can control for the potential endogeneity of the training decision.
We also estimate productivity returns using a value-added production function in which labor inputs are disaggregated by age and training status. Some have argued that estimating the contemporaneous effect of FSC training on productivity provides a better picture of the true returns to training - especially in an environment of com-pressed wages (Acemoglu and Pischke (1999)). While many studies estimate returns to training within such a framework, none of these allow returns to training to vary with age.
In order to map out the FSC age-training profiles and estimate separately the returns of FSC on wages and productivity, we use data from Statistics Canada’s nationally representative Workplace and Employee Survey (WES) from 1999 to 2005. One of the advantages of these longitudinal data is that they follow, and link, workers to firms. As a result, these data allow, among other things, for a rich structure of unobserved heterogeneity at both the firm and worker level.4
Our results show that the likelihood of receiving FSC training declines sharply after age 55. Overall, the probably of receiving classroom training is 4.6 probability points lower for workers aged 55 to 59 relative to their 35 to 44 counterparts (our comparison group). The difference is even more striking for workers aged 60 to 64, whose probability point difference of receiving FSC training is 9.6 relative to the comparison group.
This is comparable to recent results from the US by Frazis, Gittleman, and Joyce (2000) who use the 1995 Survey of Employer Training that shows a concave relationship between age and training. More specifically, they find that the probability of receiving training rises with age but decreases at a rate of 1.3% annually after the age of 55.5 However, we find that the decline with age is even steeper in a robustness check in which we use worker fixed effects in a linear probability model to take into account unobserved differences at the worker level.
4Abowd and Kramarz (1999a) classify WES as a survey in which both the sample of workplaces and
the sample of workers are cross-sectionally representative of the target population.
5Bishop (1997) summarizes earlier results from US data and concludes that training levels do diminish
Our results, taking into account both worker and workplace unobserved heterogene-ity, suggest that the returns to training on wages also decline with age. More specifi-cally, we show that a worker aged 25 to 34 who undertakes FSC training earns 1.2% more than a young worker who do not participate in FSC training. These returns de-cline to 0.7% for workers aged 55 to 64. Moreover, we find that differences in duration of training do not explain this decline. However, our most striking results are obtained when we estimate the varying impact of FSC training on productivity and find that contemporaneous productivity-returns to classroom training diminish more markedly with age. In fact, we find that the impact of FSC training on productivity is close to nil for older workers.
Taken together, these results suggest that the decrease in the productivity impact of training is likely to be the main explanation to declining training incidence with age rather than a Becker-type explanation. Moreover, these results also suggest that the productivity gains to be expected from policies promoting training for older workers are likely to be very small, casting doubts on the viability of such policies in the long run.
In the next section we briefly review the literature on the returns to FSC training on wages and productivity. After describing our data set, we describe our statistical models and show our results - that are separated into three different subsections. We first examine how the incidence of FSC training varies with age, we then estimate age-specific returns to FSC training on wages. Finally, we estimated age-age-specific returns to FSC training on productivity. A short conclusion follows.
2. Literature
Studies of the impact of training on workers’ wages are quite extensive. In general, these studies can be divided into three categories based on the dependent variable stud-ied. More specifically, they can be divided into groups where the dependent variable is: (1) the worker’s hourly wage, (2) the wage growth at the worker level, or (3) the workplace’s wage bill. Studies also vary in how they measure the intensity and the content of firm-sponsored training. Although in most studies training is measured by a single dummy variable indicating whether the worker received training in the past year or not, some allow for more complete information including the duration or money spent on training.
Theory predicts that training will have a positive impact on all three measure (i.e., hourly wage, wage growth and workplace’s wage bill), as long as training increases the worker productivity and that these increases are reflected in wages (Becker (1964);
Mincer (1974)). Nonetheless, it is possible that the impact of training on wages will not fully reflect increases in productivity (i.e., will be smaller) in the presence of a compressed wage structure (Acemoglu and Pischke (1999)).
Despite solid theoretical foundations, it is empirically very difficult to measure the causal impact of training on wages for two main two reasons. First, there is the usual problem of unobserved ability bias, where higher ability workers are more likely to select into training as well as more likely to earn higher wages, causing an upward bias in the estimated returns to training. Second, few data set track both the worker’s wage and training history. If past training is correlated with both current training and current wages, its omission will also likely bias estimated wage returns upwards.
Regardless of the magnitude of its effect, the literature does consistently find positive wage returns to training. As expected, returns are lower once self-selection into training is taken into account (Lynch (1992), Veum (1995), Loewenstein and Spletzer (1998), Loewenstein and Spletzer (1999) and Frazis and Loewenstein (2005)). There is also some evidence that returns are lower in more recent studies and lower outside of the U.S. (Goux and Maurin (2000), Regner (2002) and Bassanini (2006)). In comparison, our own results (discussed at length below) on the impact of FSC training on wages are even lower than the ones from the more recent studies from outside the U.S. On average, we obtain a wage returns close to 1%. This low returns could result from the fact that, unlike previous studies, we take into account how unobserved characteristics at both the employee and employer levels can be correlated to training decisions. Furthermore, we are not aware of any studies presenting differentials returns of training on wages by age, which is the main focus of this paper.
There are relatively few studies measuring the impact of training on an objective measure of worker productivity. This is most likely due to the fact that there are rela-tively few data sets containing information on both the firm’s productivity (measured as sales or value-added per worker) and its training practices (Black and Lynch (1996); Barrett and O’Connell (2001)). Moreover, many studies that do consider the effect of training on productivity, do so using relatively small samples - calling into question their generalizability.6
6This is the case with Holzer, Block, Cheatham, and Knott (1993) who use data from 390 applicants
to the Michigan Job Opportunity Bank-Upgrade program from 1987-1989, Bartel (1994) who use data from 495 American firms, as well as Ballot and Taymaz (2001) who use data from 90 firms in France and 270 firms in Sweden.
Much in the same way as when determining the impact of training on wages, one should consider the fact that workplaces who offer training may be unobservably differ-ent from those who do not. If workplaces who offer training are also more productive for unobserved reasons (for example, because of higher managerial ability), estimated returns to training will be upwardly biased. Many earlier studies do not take into account this likely possibility.7
Not surprisingly, more recent work has shown that controlling for the endogeneity in the training decisions does matter. Recent papers such as Almeida and Carneiro (2009) and Zwick (2006) use a large panel of respectively Portuguese and German firms and still find sizable productivity returns to training even after taking into account en-dogenous firm-level training decisions using a mix of firm fixed effects and instrumental variables. The study by Almeida and Carneiro (2009) is even more interesting as it is one of the very few that provides an estimate of the internal rate of return of firm investments in human capital, using detailed information on the costs of training.
In particular, the impact of training on productivity appears at least as high, if not much higher, than its impact on wages. Estimating how the surplus generated by training activities is divided between firms and workers is the exact focus of a crop of recent working papers that, using firm-level data, replicate the earlier findings of Barron, Berger, and Black (1999), Loewenstein and Spletzer (1998), Barron, Black, and Loewenstein (1989) and Bishop (1991). In Italy, Conti (2005) finds that firms reap more of the returns to training than do workers. For Germany, Kuckulenz (2007) finds that the impact of training on productivity is three times higher than its impact on wages. Lopes and Teixeira (2010) use data from Spain and find that 2/3 of the productivity gains from training are captured by firms.8
We also find that the impact of training on productivity is larger than its impact on wages. We also allow the impact of training to vary according to the age of the workers who receive training, again something that has not been done before and is a primary focus of this paper.
7That is the case for Holzer, Block, Cheatham, and Knott (1993), Bartel (1994)Black and Lynch
(1996) and Barrett and O’Connell (2001).
8However, some other studies find a more equal sharing of the gains (see Dearden, Read, and Reenen
3. Data
Our data come from the Workplace and Employee Survey (WES) conducted by Sta-tistics Canada.9 WES has been conducted annually since 1999 and we use all 7 years of
available data (1999 2005). The survey is both longitudinal and linked in that it doc-uments the characteristics of workers and workplaces over time. The target population for the workplace component of the survey is defined as the collection of all Canadian establishments who paid employees in March of the year of the survey. The sample comes from the “Business Register” of Statistics Canada, which contains information on every business operating in Canada. The survey is therefore nationally representative of Canadian businesses. For workplaces, the initial 1999 sample is followed over time and is supplemented at two-year intervals with a sample of births selected from units added to the Business Register since the last survey occasion.10,11
For the employee component, the target population is the collection of all employees working, or on paid leave, in the workplace target population. Employees are sampled from an employees list provided by the selected workplaces. For every workplace, a maximum number of 24 employees is selected and for establishments with less than 4 employees, all employees are sampled. WES selects new employees and workplaces in odd years (at every third year for employees and at every fifth year for workplaces).
4. The incidence of training over age
Figure 1 summarizes how FSC training incidences vary with age for each 5-years age group between 35 and 65. Referring to the Figure and the following two summary statistics Tables, we keep only workers from the initial and the re-sampling years. For comparison purposes, they show how the incidence of on-the-job training vary with age. Figure 1 shows that the incidence of FSC training is relatively stable until age 50 but then drops precipitously. In contrast, the decline in the incidence of on-the-job training starts even earlier. Irrespective of the type, the incidence of training for workers aged between 60 and 64 is much lower than for younger workers.
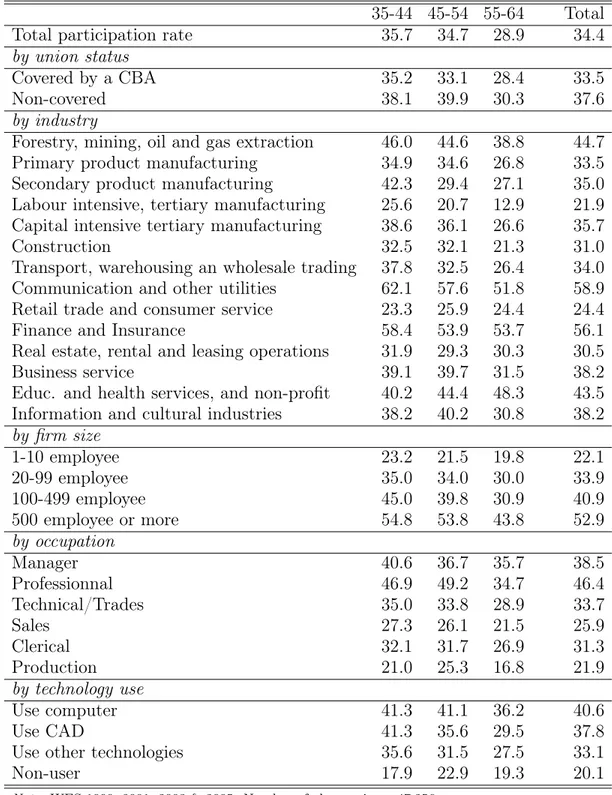
Table 1 shows how the incidence of FSC training varies over three age groups for some subsamples. Overall, close to 37% of workers aged 35 to 44 received FSC training - whereas the incidence drops to about 30% for workers aged 55 to 64. Furthermore,
9This is a restricted-access data set available in Statistics Canada network of Research Data Centers
(RDC). Remote access is also possible.
10Except for those located in Yukon, the Northwest Territories and Nunavut and firms operating in
fisheries, agriculture and cattle farming.
11In order to control for the design effect in our estimations, we weighted our analysis with the final
we observe FSC training participation rates dropping with age for almost all categories of worker, no matter the union status, the industry, the firm size, the occupation or technology use.12
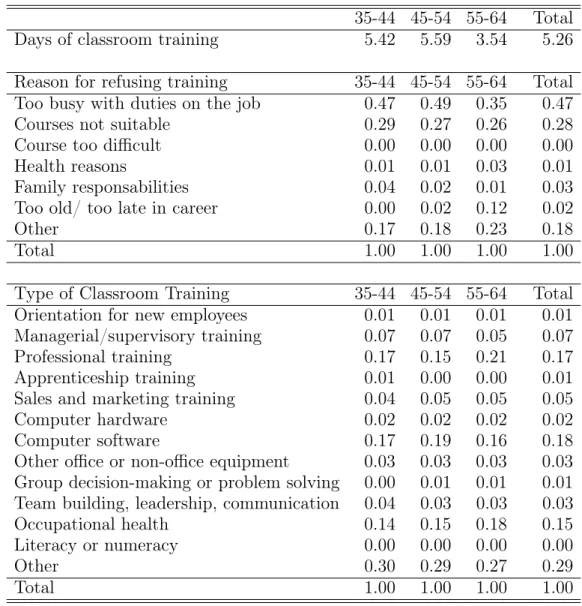
Table 2 shows that the intensity of FSC training measured as its duration in days (conditional on receiving classroom training) also diminishes with age. It is also impor-tant to note that this measure is a lower bound on total number of days of classroom training since the survey only asks for the duration of the two longest training episodes undertaken by the worker in the past year. Numbers shown are obtained by adding the number of days of both episodes.
WES is also one of the very few surveys containing information on two related questions of interest. We first summarize in Table 2 reasons reported by workers for refusing to undertake FSC training that was offered by the workplace. Not surprisingly, older workers are more likely to report refusing FSC training because they are too old. This could be because they do not have time to recoup their investment. However, older workers are also more likely to refuse FSC training because they deem the offered courses not suitable. This might suggest that the current forms of FSC training are not adequate for the needs of older workers. Finally, the last part of Table 2 shows additional information about the type of FSC training undertaken. Older workers appear slightly less likely to follow training on the topic of occupational health and safety and slightly less likely to get managerial or supervisory training - nonetheless, the differences with younger workers are very small in both cases.
4.1. Statistical model. In order to assess whether the fall in the incidence of FSC training with age shown in Figure 1 is due to the confounding effects of other covariates, we estimate the link between the probability of receiving FSC training and age in a regression framework. To measure changes in the probability of receiving FSC training with age, we construct a sample of workers where we exclude workers aged 35 and below (32, 956 observations) as well as workers aged over 65 (6, 926 observations). We also drop workers in non-profit organizations (16, 095 observations) or in part-time work (4, 339 observations). Estimation results for the probability model are thus based on a sample of 75, 644 observations.
We use a probit model in which the dependent variable is a dummy variable indi-cating whether worker i in workplace j at time t undertook FSC training (trcls
ijt = 1) in the past year:
(4.1) P trijtcls = 1 = ( Xijt),
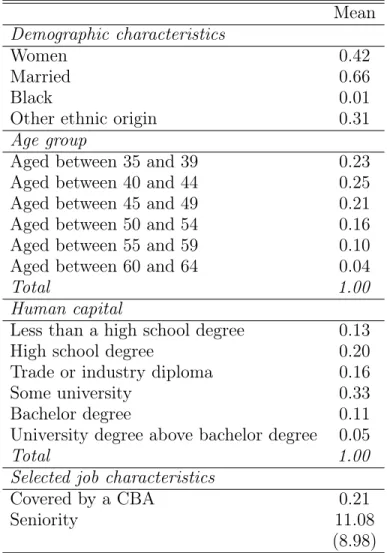
where Xijt is a vector of explanatory variables including demographic characteristics of the worker (sex, ethnicity, marital status and education), some characteristics of the job (seniority, whether the worker is covered by a collective bargaining agreement), firm size as well as complete sets of year, occupation and industry dummies. Table 3 shows summary statistics for demographic and human capital characteristics used in this probit analysis.
The longitudinal and linked nature of WES requires special care in computing the standard errors for the estimated coefficients. As a result, standard errors for equa-tion (4.1), and all subsequent equaequa-tions, are bootstrapped (Donald and Lang (2007)) in order to take into account residual clustering at the worker and workplace levels. Statistics Canada provides sets of average bootstrap weights for such purposes. It is also important to note that this method of computing standard errors also takes into account worker and workplace unobserved heterogeneity as well as the stratified sampling procedure used by Statistics Canada.
4.2. Results. Results from the probit model are presented in Table 4. We present only marginal effects (computed at the average value of each explanatory variables). We find significant drops in the probability of receiving FSC training after age 50, even after taking into account many worker and workplace characteristics. More specifically, we find that the probability of a worker aged 50 to 54 receiving FSC training is 5.7 points lower than for a worker aged 35 to 39. Drops in the probability of receiving FSC training are even bigger for older workers ( 6.4 for workers aged 55 to 59 and 7.9 for workers aged 60 to 64). Given an average training incidence of 37% for workers aged 35 to 44, the magnitude of the estimated marginal effect represents a drop of more than 15% in the probability of receiving classroom training.
Similar results are found using other Canadian data sets (usually using the Adult and Education Training Survey (AETS) or the WES). Using the WES, Lin and Tremblay (2003) examine the link between age and training. Their summary statistics show declining levels of training with age for both classroom and on-the-job training. Hansen and Belzil (2006) confirm these findings in a regression framework, noting that the drop with age seems more acute with on-the-job rather than off-the-job (or general) training.13
13These results are confirmed by other studies using the AETS by Underhill (2006), Peters (2004)
Marginal effects for other covariates are in line with the literature. For example, individuals with more years of education are more likely to receive FSC training, pos-sibly because of higher returns in workplaces that employ such workers (Bartel and Lichtenberg (1987)). We also find a positive link between workplace size and the prob-ability of receiving FSC training, which can be generally explained by more binding constraints in the financing of training faced by smaller workplaces. Furthermore, we find that women are less likely to receive FSC training, that there is no significant impact of seniority on FSC training, and that there is a small positive impact of being covered by a collective bargaining agreement.
4.3. Robustness check: unobserved worker heterogeneity. It should be noted that these results might be biased, for example, if workers who are more productive for unobserved reasons are both more likely to stay active in the job market as they get older and also more likely to undertake training. We are somewhat limited in our ability to use the structure of the data to take such a scenario into account as workers are observed at most for two years in the data and about 20% of the workers are observed only for one year (because they then move to another workplace outside the sample).
Given these limitations of the data, we can nonetheless include worker fixed effects in a linear probability model. If we do so, we observe an even more dramatic decrease in the probability of receiving classroom training with age. The drops in probabil-ity points are 3.0 for individuals aged 45 to 49, 6.0 for individuals aged 50 to 54, 12.4 for individuals aged 55 to 59 and finally 21.2 for those aged between 60 and 64. Consequently, we conclude that our previous results are robust to taking into account unobserved worker effects.
5. Estimating age specific wage returns
5.1. Statistical model. In order to estimate the impact of firm-sponsored classroom training on workers’ wages, we use a typical log-wage specification. Because of the structure of our data, we take into account both individual and workplace heterogeneity, using a two-factor analysis of covariance with repeated observations along the lines of Abowd and Kramarz (1999b):
(5.1) yit = µ + xit +⇢trijtcls+ ✓i+ j+ ✏it, with
where yit is the (log) wage rate observed for individual i = 1, ..., N at time t = 1, ..., Ti. Worker effects are denoted by i, workplace effects by j, and time effects by t. µ is a constant, xit is a matrix containing demographic information for worker i at time t as well as information concerning workplace j to which worker i is linked. trcls
ijt is defined as before and ⇢ is the return to such training. Worker heterogeneity (✓i) is a measure of unobserved (↵i) and observed (ui⌘) time-invariant worker characteristics. Note that one of these unobserved characteristics is the amount of training the worker has received with previous employers. Employer heterogeneity ( j)captures workplace-specific unobserved characteristics common to all workers of the same workplace. ✏it is the statistical residual.
We estimate equation (5.1) using two different methods. First, we drop j and treat ✓i as fixed effects. Recall that distinguishing workplace from individual fixed effects requires that we observe the same worker across different firms. But the WES sampling procedure does not follow workers who move from one firm to another. As such, separate worker and workplace fixed effects are not identified.14 Given the inability of the WES to capture interfirm mobility, ✓i is effectively interpreted as a measure of worker and workplace unobserved characteristics.
Second, we use an estimation method suggested by Abowd and Kramarz (1999b) who propose a mixed model in which worker and firm effects are treated as random. This method involves making some additional distributional assumptions about the unobserved characteristics in order to distinguish between worker and workplace un-observed heterogeneity. However, the model we use is distinct from standard random effects models in that some correlation is permitted between the design matrix of the worker and firm effects with other covariates. In particular, it allows both unobserved worker heterogeneity and unobserved workplace heterogeneity to be correlated with current training decisions.
Allowing for such correlation is important as it is expected that more productive workers are both more likely to receive FSC training as well as earn higher wages. It is also possible that better managed workplaces offer higher salaries and more FSC training. To our knowledge, we are the first to provide estimates of the impact of training on wages while explicitly taking into account how both sources of unobserved heterogeneity affect training decisions. It is expected that not taking these correlations into account will lead to an upward bias in estimated returns to FSC training.
A detailed description of the estimation procedure is presented in Abowd and Kra-marz (1999b) and summarized in the Appendix to this paper. Briefly, parameters 14This data constraint also precludes the inclusion of worker-firm match effects.
estimates are obtained in two steps. We first use Restricted Maximum Likelihood (REML) to obtain parameter estimates for variance components. We then solve the so-called Henderson’s Mixed Model Equations to get estimates for the other param-eters in the full model (5.1). Solving the mixed equations simultaneously yield the Best Linear Unbiased Estimates (BLUE) of the fixed effects and Best Linear Unbiased Predictors (BLUP) of the random effects.
The main drawback of this second method is its use of additional assumptions about the distribution of the unobserved effects. However, the information embedded in these additional assumptions allow a much more precise estimation of the age-specific returns to training, while still allowing FSC decisions to be correlated with worker and workplace observed characteristics.
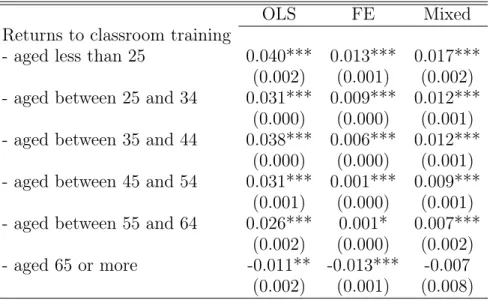
5.2. Results. Results from estimating equation (5.1) are presented in Table 5 as well as those obtained using OLS and FE for comparison. Estimated coefficients can be interpreted as the approximate percentage wage premium for having undertaken FSC training in the past year.
On average, the wage-returns to FSC training are relatively low compared to several previously published estimates while in line with more recent work (for example Bas-sanini (2006)). On average, returns to FSC are close to 3.5% in the OLS model, 0.6% in the FE model, and closer to 1% in the mixed model. However, the three models provide similar conclusions with respect to how the FSC wage premium vary with age: once we allow returns to vary with age, we find that returns to FSC training are lower for older workers.
Focusing on results for the mixed model, we find that for workers aged between 35 and 44, having received some FSC training raises hourly wage by 1.2%. The wage premium drops further to 0.9% for workers aged between 45 and 54 and rapidly even further to 0.7% for workers aged 55 to 64 (and is not statistically different for older workers). Note that the drop in the wage premium with age is steeper in the FE and mixed models compared to OLS results, as expected, as workers who are more productive for unobserved reasons are more likely to received training as well as earn higher wages.
We note that the decline seems modest at best as return to training on wages are low to begin with. Nonetheless, this declining return should be taken into account in addition to the lower time horizon available to recoup the training investment when trying to explaining the declining incidence of FSC training with age.
5.3. Robustness check: taking into account the intensity of FSC. One problem with the previous results is the use of the incidence of FSC training rather than quantity of FSC training. Without duration information, there is no basis for judging whether a coefficient is large or small. We already have shown in Table 2 the the duration of FSC training diminishes with age. Could the drop in FSC training duration explains the lower wage returns for older workers? To verify this, we estimate a modified version of equation (5.1) in which the duration of FSC training (T ) in days as defined in section 3 is allowed to have an impact on wages:
(5.3) yit = µ + xit +⇢f (T ) + ✓i+ j+ ✏it.
By choosing f(T ) = T , we nonetheless find that the returns to an additional day of FSC training is significantly lower for an older worker. More specifically, we find that each additional day of training raises wages by 0.25% for an average worker but only by 0.17% for an older worker, both effects being statistically different from zero at the 1% level.
However, Frazis and Loewenstein (2005) have nicely illustrated how the choice of functional form for f(T ) is important. Once we settle on a cubic root specification, we again find lower returns for older workers. Quite interestingly, we find that for all age groups, the return to an additional day of FSC training decreases as the length of training increases. However, we find no evidence that this decline also accelerates with the length of training.
6. Estimating age specific productivity returns
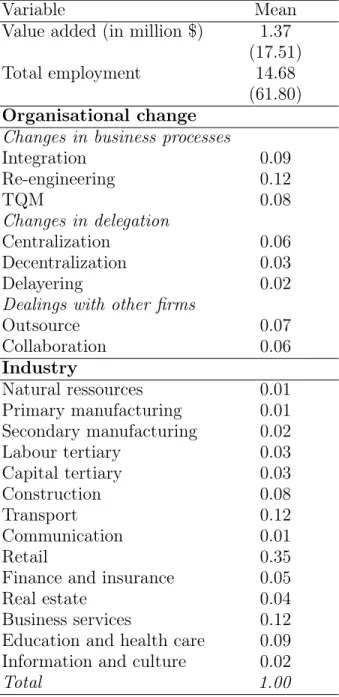
6.1. Statistical model. Estimation of the training productivity premium in a produc-tion funcproduc-tion framework requires informaproduc-tion on the inputs and output at the workplace level. Luckily, we have a relatively precise measure of workplace productivity (our de-pendent variable) in value added - defined as gross operating revenue minus expenses on intermediary inputs, training expenses and additional labor costs. Labor is mea-sured through the number of employees in the workplace (as of the end of March of the current year). Measuring the stock of capital is somewhat more difficult. As with most firm-level data, capital stocks for each firm are not available. We discuss the likely impact of this missing variable in subsection 6.3.
For a measure of the firm’s human capital investments, we use information on the workers linked to the workplace. Specifically, we obtain from the worker part of the survey the worker’s age and whether the worker took part in any FSC in the past year in order to construct shares of workers who received training by age. In estimating the
production function, we distinguish between three age groups: less than 35, between 35 and 54 and more than 54. Using a finer classification is limited by the fact that we only observe a sample of workers from each workplace and sampling errors lead to less precise estimates of the shares as the number of age groups increases. It should be noted that these constructed shares are only an approximation of the real proportion of workers receiving training in each age group. However, since workers are selected at random, they are unbiased estimates of the real shares. Because of the sampling process, it is expected our estimates will be more noisy than those that would be obtained if the complete set of workers were sampled.
It should also be noted that the WES includes detailed information on workplace-level organizational changes. This information allows us to control explicitly for re-organization within the firm that might be correlated with training decisions.
We use a Cobb-Douglas production function where the dependent variable is the value added in workplace j at time t (Qjt)
(6.1) ln Qjt = Lln LEjt+ Zjt+ ✏jt.
LE
jt is a measure of effective labor and Zjt includes controls for industry, year and organizational changes. Summary statistics on Z are presented in Table 6. ✏jt is a residual error term.
Our measure of effective labor (LE) depends on the number of employees who re-ceived classroom training (LT) and the number of employees who did not receive any such training (LN T). If we do not distinguish workers by age, it is then defined as (6.2) LEjt = TLTjt+ N TLN Tjt = N TLjt+ ( T N T)LTjt
where L is the total number of employees. T and N T are load factors converting the number of employees who received and did not receive FSC training into effective labor. By taking the natural log on each side of equation 6.2, we can approximate LE
jt by (6.3) ln LEjt ⇡ ln N T + ln Ljt+ ln ✓ 1 + ✓ T N T 1 ◆ Pjt ◆
where we define Pjt as the proportion of employees who received training.15 Substituting equation (6.3) in (6.1), we obtain
(6.4) ln Qjt ⇡ 0+ Lln Ljt+ Kln Kjt+ LPjt+ Zjt + ✏jt 15The approximation is correct as long as LT
L ⇣ T N T 1 ⌘ is close to zero.
where = ⇣ T
N T 1
⌘
is the parameter of interest and is interpreted as the relative productivity of an employee who received training compared to an employee who did not.
Modifying equation (6.4) to take into account the age of the worker receiving FSC is relatively straightforward. It involves disaggregating Pjtinto shares of workers receiving training into each of the three age groups and adding shares of workers who did not received training for two other age groups.
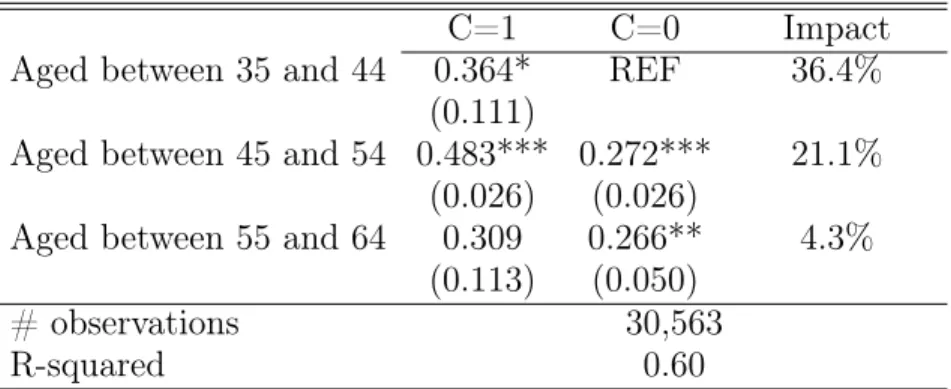
6.2. Results. Production function estimates are presented in Table 7. Given that the coefficient on the natural logarithm of total employment is approximately close to one, other coefficients can be interpreted as the productivity differentials between the given age group relative to the omitted category (workers aged less than 35 who did not receive any classroom training). For example, results show that classroom training raises the productivity of a worker aged less than 35 by 37%.
To obtain the productivity measures of classroom training for a worker aged 35 to 44, one simply needs to subtract from the estimated productivity differential (45%) the amount due to life cycle effects (24.7%). This yields returns for the 35 to 44 age group of 20.3%. We acknowledge the use of the term net return could be misleading: keeping in mind that this return is not a true return on investment as we do not take into account the cost of training.
Together, these results show a significant drop in returns to classroom training with age. The estimated returns on productivity further drops to 5.4% for a worker aged above 55. These results provide strong evidence that the returns to classroom training on productivity decline with age. Moreover, the magnitude of the decline is quite large. 6.3. Robustness check: unobserved workplace heterogeneity. As noted by Bar-rett and O’Connell (2001), productivity is a function of the stock of workers’ skills, not the flow of training. Results obtained by regressing current productivity on training flows are therefore difficult to interpret, given that the stock of workers’ skills is in-cluded in the error term in the previous regression framework.16 In fact, the previous results might provide a good approximation of the age-returns gradient but the returns within age group appear to be rather large.
Given the lack of data on the stock of training or training histories, one possible path to follow is to assume that this stock is included in an unobserved workplace 16This is in addition to the previously mentioned missing capital stock.
fixed effect ( j). Let
(6.5) ✏jt = j + ⌘jt.
Estimating the production function with this specification of the error term provides much more reasonable productivity returns to FSC training. On average, workers who received FSC provide a statistically significant 7.5% more additional value added.
The FSC training returns estimates are, however, much less precise once we allow this return to vary with age. While the fact that we only observe a sample of workers in each workplace does not affect too adversely the standard errors of our OLS estimates, there is not enough within firm variations to precisely estimate the returns to FSC training in the FE model. Nonetheless, by taking the point estimates at face value, they are consistent with the OLS results, namely that the impact of FSC on productivity is dramatically lower for older workers. That is, we find that a worker aged less than 44 provides 5.8% more value added with FSC than a worker with no FSC. Returns for workers aged 45 to 54 are even slightly higher to 6.8% and returns for the oldest age group are slightly negative. Again, we note that these coefficients are not statistically different from zero. Therefore, even after taking into account unobserved heterogeneity at the workplace level, we still observe a very steep decline in the impact of FSC training on productivity for older workers.
It is important to note that these last estimates do not take into account another potential source of bias in estimating the production function. For example, it is likely that a workplace that faces an unexpected increase in the demand for its product will temporarily shift more resources away from training to production. Likewise, a workplace facing a temporary downturn in demand for its product might increase training for its employees. If such is the case, unobserved productivity shocks will be negatively correlated to the proportion of employees who received training and estimated returns will be biased downward.
There are a number of econometric procedures that have been proposed to deal with these particular sources of bias. For example, Levinsohn and Petrin (2003) suggest inverting the demand function for capital or materials in order to infer a value for the unobserved productivity shock. The estimated productivity shock is then used as an additional regressor in the production function.17,18These rely on the assumption that the inversion function is non stochastic. However, this assumption is satisfied if and only if factor prices are the same across firms. But then, this also implies that labor and 17See Levinsohn and Petrin (2003) for complete details.
the good used in the inverse mapping function are collinear. This helps in explaining why the estimates obtained with these methods are generally very imprecise. The proof of this argument is given by Gorodnichenko (2010), but the criticism is also raised by Bond and Soderbom (2005), Ackerberg, Caves, and Frazer (2006) and Basu (1999).
An alternative method is suggestd by Blundell and Bond (2000). They use dynamic panel GMM methods through which lagged inputs are used as instruments for current input choices. However, Gorodnichenko (2010) shows that the Blundell and Bond (2000) estimator is in general weakly identified. In our case, the problem of weak instruments would be compounded by the sampling error of the labor input of the production function as we only observe a sample of workers in each workplace. We can’t find a good reason why unobserved productivity shocks would change our previous conclusion about how returns to FSC would vary with age even though returns within age groups could potentially differ.
6.4. Comparing productivity to wage returns. In this section, we highlight two implications that follows from our findings. First, the estimated impact of FSC training on productivity is much greater than its impact on wages. This suggest that workplaces rather than workers reap the majority of the benefits of classroom training. This finding is consistent with those of Lopes and Teixeira (2010), Kuckulenz (2007) and Conti (2005).
Second, given diminishing probabilities of receiving FSC training with age, we esti-mate both declines in wage and productivity-returns. Results show that productivity returns decline much more drastically with age than do wage returns. This suggests that the workplace’s incentive to invest in classroom training is much lower for older workers, as FSC training is not very effective in raising older workers’ productivity. This further suggests that efforts to increase FSC training for older workers in its current form is unlikely to yield important productivity gains. Whether alternative forms of FSC training tailor made and targetted to older age groups are likely to yield positive returns remains an open question.
7. Conclusion
In this paper, we show that older workers are much less likely to undertake FSC training than their younger counterparts. In addition to the shorter time to recoup their training investment, we underscore two additional, yet related, reasons why this is so: both the wage training premium and the productivity gains to classroom training diminish with age. Furthermore, we show that the decrease in productivity gains is
much greater than the decrease in the wage premium with age. This last result reflects the fact that workplaces reap most of the gains from training for younger workers and that the productivity premium of FSC training for older workers is close to zero. Collectively, these results suggest that increasing the levels of FSC training for older workers is unlikely to yield large productivity gains.
An interesting issue that warrants further investigation is whether the decline in the productivity returns with age is due to reduced abilities to learn by older workers or a lack of productivity enhancing FSC training toward older workers.19
Finally, there are also a number of channels other than productivity through which classroom training could have beneficial effects on the workplace. An interesting possi-bility would be the presence of complementarities in training younger and older workers. It is also possible that classroom training for older workers has beneficial impacts on other measures of workplace performance such as innovation or the retention of older workers (Picchio and van Ours (2011). Such questions are left for future research.
19In fact, there is evidence that older workers need specialized kinds of training - especially to deal
References
Abowd, J. M. and F. Kramarz (1999a). The analysis of labor markets using matched employer-employee data. In O. Ashenfelter and D. Card (Eds.), Handbook of Labor Economics, vol 3B, Chapter 40, pp. 2629–2710. Elsevier Science North Holland.
Abowd, J. M. and F. Kramarz (1999b). Econometric analyses of linked employer-employee data. Labour Economics 6 (1), 53–74.
Acemoglu, D. and S. Pischke (1999). Beyond Becker: Training in imperfect labor markets. The Economic Journal 119, F112–F142.
Ackerberg, D., K. Caves, and G. Frazer (2006). Structural identification of produc-tion funcproduc-tions. Working Paper, University of Arizona, UCLA and University of Toronto.
Almeida, R. and P. Carneiro (2009). The return to firm investments in human capital. Labour Economics 16 (1), 97–106.
Ballot, G. F. and E. F. Taymaz (2001). Firm’s human capital, R&D and performance: A study on french and swedish firms. Labour Economics 8 (4), 443–462.
Barrett, A. and P. O’Connell (2001). Does training generally work? The return to in-company training. Industrial and Labor Relations Review 54 (3), 647–663. Barron, J., M. Berger, and D. Black (1999). Do workers pay for on-the-job training?
Journal of Human Resources 34 (2), 235–252.
Barron, J. M., D. A. Black, and M. A. Loewenstein (1989). Job matching and on-the-job training. Journal of Labor Economics 7 (1), 1–19.
Bartel, A. P. (1994). Productivity gains from the implementation of employee train-ing programs. Industrial Relations 33 (4), 411–425.
Bartel, A. P. and F. R. Lichtenberg (1987). The comparative advantage of educated workers in implementing new technology. The Review of Economics and Statis-tics 69 (1), 1–11.
Bassanini, A. (2006). Training, wages and employment security: an empirical analysis on european data. Applied Economics Letters 13 (8), 523–527.
Basu, S. (1999). Discussion on “Estimating production function using intermedi-ate inputs to control for unobservables” by A. Petrin and J. Levinsohn. NBER Productivity Program Meeting.
Becker, G. S. (1964). Human Capital. A Theoretical and Empirical Analysis with Special Reference to Education. Cambridge: National Bureau of Economic Re-search.
Bishop, J. (1991). On the job training of new hires. In D. Stern and J. Rizzen (Eds.), Market Failure in Training? New Economic Analysis and Evidence on Training of Adult Employees, pp. 61–96. New York: Springer-Verlag.
Bishop, J. H. (1997). What we know about employer-provided training: A review of the litterature. In S. W. Polachek (Ed.), Research in Labor Economics, Volume 11, pp. 19–87. JAI Press, Greenwich, Conn.
Black, S. and L. Lynch (1996). Human-capital investments and productivity. Amer-ican Economic Review Papers and Proceedings 82 (2), 263–267.
Blundell, R. and S. Bond (2000). GMM estimation with persistent panel data: An application to production functions. Econometric Reviews 19 (3), 321–340. Bond, S. and M. Soderbom (2005). Adjustment costs and the identification of
Cobb-Douglas production functions. Working Paper 05/04, Institute for Fiscal Studies. Cardoso, A. R., P. Guimaraes, and J. Varejão (2010). Are older workers worthy of their pay? An empirical investigation of age-productivity and age-wage nexuses. IZA Discussion Paper #4785 .
Conti, G. (2005). Training, productivity and wages in Italy. Labour Economics 12 (4), 557–576.
Dearden, L., H. Read, and J. V. Reenen (2006). The impact of training on produc-tivity and wages: Evidence from british panel data. Oxford Bulletin of Economic and Social Research 68 (4), 397–421.
Donald, S. G. and K. Lang (2007). Inference with difference-in-differences and other panel data. The Review of Economics and Statistics 89 (2), 221–233.
Expert Panel on Older Workers (2008). Supporting and Engaging Older Workers in the New Economy. Ottawa, ON: Supply and Services Canada.
Frazis, H., M. Gittleman, and M. Joyce (2000). Correlates of training: An analysis using both employer and employee characteristics. Industrial and Labor Relations Review 53 (3), 443–463.
Frazis, H. and M. A. Loewenstein (2005). Reexamining the returns to training: Func-tional form, magnitude, and interpretation. Journal of Human Resources 40 (2), 453–476.
Göbel, C. and T. Zwick (2009). Age and productivity: evidence from linked employer employee data. ZEW Discussion Papers 09-020 .
Goldberg, B. (1999). Overcoming High-Tech Anxiety: Thriving in a Wired World. Jossey-Bass: The Jossey-Bass Business & Management Series.
Gorodnichenko, Y. (2010). Using firm optimization to evaluate and estimate produc-tivity and returns to scale. Working Paper, University of Berkeley.
Goux, D. and E. Maurin (2000). Returns to firm-provided training: Evidence from French worker-firm matched data. Labour Economics 7, 1–19.
Hansen, J. and C. Belzil (2006). The determinants of training opportunities: Ef-fects of human capital and firm characteristics. Working Paper, Skills Research Initiative.
Holzer, H., R. Block, M. Cheatham, and J. Knott (1993). Are training subsidies for firms effective? the Michigan experiment. Industrial and Labor Relations Review 46 (4), 625–636.
Hum, D. and W. Simpson (2001). Participation à la formation des adultes au canada dans les années 1990. une analyse multivariée avec les données de l’enquête sur l’éducation et la formation des adultes. Working Paper R-01-9-5F, Direc-tion générale de la recherche appliquée. Politique stratégique. Développement des ressources humaines du Canada.
Konings, J. and S. Vanormelingen (2010). The impact of training on productivity and wages: Firm level evidence. IZA Discussion Paper #4731 .
Kuckulenz, A. (2007). Studies on Continuous Vocational Training in Germany. ZEW Economic Studies.
Levinsohn, J. and A. Petrin (2003). Estimating production function using inputs to control for unobservables. Review of Economic Studies 70 (2), 317–342.
Lin, Z. and J.-F. Tremblay (2003). Employer-supported training in Canada: Policy-research key knowledge gaps and issues. Working Paper 2003-B-01, Skills Re-search Initiative.
Loewenstein, M. and J. Spletzer (1999). Formal and informal training: Evidence from the NLSY. In S. Polachek (Ed.), Research in Labor Economics, Volume 18, pp. 403–38. JAI Press, Greenwich, Conn.
Loewenstein, M. A. and J. R. Spletzer (1998). Dividing the costs and returns to general training. Journal of Labor Economics 16 (1), 142–71.
Lopes, A. S. and P. Teixeira (2010). Productivity, wages, and the returns to firm-provided training: Who is grabbing the biggest share? GEMF Working Pa-pers 2010-05.
Lynch, L. M. (1992). Private-sector training and the earnings of young workers. American Economic Review 82 (1), 299–312.
Mincer, J. (1974). Schooling, Experience, and Earnings. New York: NBER Press. OECD (2006). Live Longer, Work Longer. OECD: Paris.
Olley, G. and A. Pakes (1996). The dynamics of productivity in the telecommunica-tions equipment industry. Econometrica 64, 1263–1297.
Peters, V. (2004). Working and training: First results of the 2003 adult education and training survey. Working Paper 81-595-MIE2004015, Statistics Canada. Picchio, M. and J. C. van Ours (2011, March). Retaining through training: Even for
older workers. IZA Discussion Paper #5591 .
Regner, H. (2002). The effects of on-the-job training on wages in sweden. Interna-tional Journal of Manpower 23 (4), 326–344.
Skirbekk, V. (2004). Age and individual productivity: A literature survey. In G. Fe-ichtinger (Ed.), Vienna yearbook of population research, pp. 133–153. Vienna: Austrian Academy of Sciences Press.
Underhill, C. (2006). Training through the ages. Perpectives on Labour and In-come 7 (4), 17–27.
Veum, J. (1995). Sources of training and their impact on wages. Industrial and Labor Relations Review 48 (4), 812–826.
Zwick, T. (2005). Continuing vocational training forms and establishment produc-tivity in Germany. German Economic Review 6 (2), 155–184.
Zwick, T. (2006). The impact of training intensity on establishment productivity. Industrial Relations 45 (1), 26–46.
Appendix A. Hypotheses of the Wage Mixed Model
With respect to the distributional assumptions, ↵ and are taken to be normally distributed: (A.1) 2 6 4 ↵ ✏ 3 7 5 ˜ N 0 B @ 2 6 4 0 0 0 3 7 5 , 2 6 4 2 ↵IN 0 0 0 2I J 0 0 0 ⇤ 3 7 5 1 C A , where (A.2) ⇤ = 2 6 6 6 6 6 6 4 ⌃1 0 ... 0 ... ... ... 0 ... ⌃i ... 0 ... ... ... 0 ... 0 ⌃N 3 7 7 7 7 7 7 5 , and ⌃i = V (✏i). (A.3) E " ✓ X, trcls # = 0 (A.4) V " ✓ X, trcls # = ⌦ (A.5)
Two important points should be made about the estimates ⇣ˆ, ˆ⇢f, ˆ⌘, ˆ↵, ˆ ⌘
. First, mixed model solutions ⇣ˆ, ˆ⇢f, ˆ⌘, ˆ↵, ˆ
⌘
converge to the least squares solutions for the fixed effects as |⌦| ! 1 (if ⇤ = 2
✏IN⇤). In this sense, fixed effects estimates are a special case of the mixed model solutions. Second, unlike the usual random effects specification considered in the econometric literature, (5.1) and (A.1) do not assume that the random effects are orthogonal to the design (X and U, trcls and U) of the fixed effects ( , ⇢f and ⌘). This in particular allows some correlation between training decisions (trcls
ijt) and unobserved characteristics of the worker (✓) and the workplace ( ).
Appendix B. Tables
Table 1. Incidence of Classroom Training versus Age
35-44 45-54 55-64 Total
Total participation rate 35.7 34.7 28.9 34.4
by union status
Covered by a CBA 35.2 33.1 28.4 33.5
Non-covered 38.1 39.9 30.3 37.6
by industry
Forestry, mining, oil and gas extraction 46.0 44.6 38.8 44.7
Primary product manufacturing 34.9 34.6 26.8 33.5
Secondary product manufacturing 42.3 29.4 27.1 35.0
Labour intensive, tertiary manufacturing 25.6 20.7 12.9 21.9 Capital intensive tertiary manufacturing 38.6 36.1 26.6 35.7
Construction 32.5 32.1 21.3 31.0
Transport, warehousing an wholesale trading 37.8 32.5 26.4 34.0
Communication and other utilities 62.1 57.6 51.8 58.9
Retail trade and consumer service 23.3 25.9 24.4 24.4
Finance and Insurance 58.4 53.9 53.7 56.1
Real estate, rental and leasing operations 31.9 29.3 30.3 30.5
Business service 39.1 39.7 31.5 38.2
Educ. and health services, and non-profit 40.2 44.4 48.3 43.5
Information and cultural industries 38.2 40.2 30.8 38.2
by firm size 1-10 employee 23.2 21.5 19.8 22.1 20-99 employee 35.0 34.0 30.0 33.9 100-499 employee 45.0 39.8 30.9 40.9 500 employee or more 54.8 53.8 43.8 52.9 by occupation Manager 40.6 36.7 35.7 38.5 Professionnal 46.9 49.2 34.7 46.4 Technical/Trades 35.0 33.8 28.9 33.7 Sales 27.3 26.1 21.5 25.9 Clerical 32.1 31.7 26.9 31.3 Production 21.0 25.3 16.8 21.9 by technology use Use computer 41.3 41.1 36.2 40.6 Use CAD 41.3 35.6 29.5 37.8
Use other technologies 35.6 31.5 27.5 33.1
Non-user 17.9 22.9 19.3 20.1
Table 2. Other Correlates of Classroom Training
35-44 45-54 55-64 Total
Days of classroom training 5.42 5.59 3.54 5.26
Reason for refusing training 35-44 45-54 55-64 Total
Too busy with duties on the job 0.47 0.49 0.35 0.47
Courses not suitable 0.29 0.27 0.26 0.28
Course too difficult 0.00 0.00 0.00 0.00
Health reasons 0.01 0.01 0.03 0.01
Family responsabilities 0.04 0.02 0.01 0.03
Too old/ too late in career 0.00 0.02 0.12 0.02
Other 0.17 0.18 0.23 0.18
Total 1.00 1.00 1.00 1.00
Type of Classroom Training 35-44 45-54 55-64 Total
Orientation for new employees 0.01 0.01 0.01 0.01
Managerial/supervisory training 0.07 0.07 0.05 0.07
Professional training 0.17 0.15 0.21 0.17
Apprenticeship training 0.01 0.00 0.00 0.01
Sales and marketing training 0.04 0.05 0.05 0.05
Computer hardware 0.02 0.02 0.02 0.02
Computer software 0.17 0.19 0.16 0.18
Other office or non-office equipment 0.03 0.03 0.03 0.03
Group decision-making or problem solving 0.00 0.01 0.01 0.01 Team building, leadership, communication 0.04 0.03 0.03 0.03
Occupational health 0.14 0.15 0.18 0.15
Literacy or numeracy 0.00 0.00 0.00 0.00
Other 0.30 0.29 0.27 0.29
Total 1.00 1.00 1.00 1.00
Table 3. Summary statistics Mean Demographic characteristics Women 0.42 Married 0.66 Black 0.01
Other ethnic origin 0.31
Age group
Aged between 35 and 39 0.23
Aged between 40 and 44 0.25
Aged between 45 and 49 0.21
Aged between 50 and 54 0.16
Aged between 55 and 59 0.10
Aged between 60 and 64 0.04
Total 1.00
Human capital
Less than a high school degree 0.13
High school degree 0.20
Trade or industry diploma 0.16
Some university 0.33
Bachelor degree 0.11
University degree above bachelor degree 0.05
Total 1.00
Selected job characteristics
Covered by a CBA 0.21
Seniority 11.08
(8.98)
Note. WES 1999-2005. Number of observations: 75,644. Std. dev. in parenthesis (for continuous var.).
Table 4. Marginal Effects - Probability of Receiving Classroom Training
Probit FE LPM
Age group 35-39 years old -
-Age group 40-44 years old 0.013*** 0.010** (0.001) (0.002) Age group 45-49 years old -0.008*** -0.030***
(0.001) (0.002) Age group 50-54 years old -0.035*** -0.060***
(0.001) (0.006) Age group 55-59 years old -0.046*** -0.120***
(0.002) (0.007) Age group 60-64 years old -0.096*** -0.204***
(0.002) (0.012)
Note. Bootstrapped standard errors in parentheses. WES 1999-2005. Number of observations: 75,644. * statistically significant at 10%; ** 5%, *** 1%. Including controls for: demographic characteristics, human capital, occupation, year, and industry.
Table 5. Wage impact of classroom training versus age
OLS FE Mixed
Returns to classroom training
- aged less than 25 0.040*** 0.013*** 0.017***
(0.002) (0.001) (0.002) - aged between 25 and 34 0.031*** 0.009*** 0.012***
(0.000) (0.000) (0.001) - aged between 35 and 44 0.038*** 0.006*** 0.012***
(0.000) (0.000) (0.001) - aged between 45 and 54 0.031*** 0.001*** 0.009***
(0.001) (0.000) (0.001) - aged between 55 and 64 0.026*** 0.001* 0.007***
(0.002) (0.000) (0.002)
- aged 65 or more -0.011** -0.013*** -0.007
(0.002) (0.001) (0.008)
Note. Bootstrapped standard errors in parentheses. WES 1999-2005. R2 in
the OLS model is equal to 0.54. Number of observations: 113,427. * statisti-cally significant at 10%; ** 5%, *** 1%. Including controls for: demographic characteristics, human capital, occupation, year, and industry.
Table 6. Summary statistics - Workplace-level variables
Variable Mean
Value added (in million $) 1.37 (17.51)
Total employment 14.68
(61.80) Organisational change
Changes in business processes
Integration 0.09 Re-engineering 0.12 TQM 0.08 Changes in delegation Centralization 0.06 Decentralization 0.03 Delayering 0.02
Dealings with other firms
Outsource 0.07 Collaboration 0.06 Industry Natural ressources 0.01 Primary manufacturing 0.01 Secondary manufacturing 0.02 Labour tertiary 0.03 Capital tertiary 0.03 Construction 0.08 Transport 0.12 Communication 0.01 Retail 0.35
Finance and insurance 0.05
Real estate 0.04
Business services 0.12
Education and health care 0.09
Information and culture 0.02
Total 1.00
Note. WES 1999-2005. Number of observations: 30,563. Std. dev. in parenthesis (for continuous var.).
Table 7. Productivity impact of classroom training versus age
C=1 C=0 Impact
Aged between 35 and 44 0.364* REF 36.4%
(0.111)
Aged between 45 and 54 0.483*** 0.272*** 21.1% (0.026) (0.026)
Aged between 55 and 64 0.309 0.266** 4.3%
(0.113) (0.050)
# observations 30,563
R-squared 0.60
Note. Bootstrapped standard errors in parentheses. * statistically significant at 10%; ** 5%, *** 1%. Including controls for org. change, year, region and industry.
it for Older Workers - APPENDIX
November 9, 2011
Demographic characteristics
Age group 35-39 years old -Age group 40-44 years old 0.013***
(0.001) Age group 45-49 years old -0.008***
(0.001) Age group 50-54 years old -0.035***
(0.001) Age group 55-59 years old -0.046***
(0.002) Age group 60-64 years old -0.096***
(0.002) Women -0.036*** (0.001) Married 0.025*** (0.001) Black 0.016*** (0.005) Other race -0.021*** (0.001) Immigrant -0.054*** (0.002) Less than a high school degree
-High school degree 0.032***
(0.001) Trade or industry diploma 0.127***
(0.001)
Some university 0.109***
(0.001)
Bachelor degree 0.103***
(0.002) University degree above bachelor degree 0.166***
(0.005)
Note. Bootstrapped standard errors in parentheses. * statistically significant at 10%; ** 5%, *** 1%.
Job Characteristics Seniority -0.000*** (0.000) Seniority squared / 100 0.001*** (0.000) Union Member -0.005*** (0.000) Managers -Professionals 0.010*** (0.003) Technical/Trades -0.038*** (0.002) Marketing/Sales -0.064*** (0.005) Clerical/Administrative -0.081*** (0.003) Production workers -0.128*** (0.003) Workplace characteristics 1-19 employees -20-99 employees 0.128*** (0.000) 100-499 employees 0.231*** (0.001) 500 employees and more 0.323***
(0.001)
Note. Bootstrapped standard errors in parenthe-ses. * statistically significant at 10%; ** 5%, *** 1%.
Forestry, mining, oil and gas extraction -Primary product manufacturing -0.095***
(0.002) Secondary product manufacturing -0.056***
(0.002) Labour intensive tertiary manufacturing -0.140***
(0.003) Capital intensive tertiary manufacturing -0.074***
(0.003)
Construction -0.017***
(0.004)
Transportation -0.006
(0.004) Communication and other utilities 0.137***
(0.002) Retail trade and consumer service -0.077***
(0.004) Finance and insurance 0.204***
(0.004)
Real estate -0.010*
(0.005)
Business service -0.016***
(0.005) Education and health service 0.098***
(0.006) Information and cultural industries -0.071***
(0.004)
Note. Bootstrapped standard errors in parentheses. * statistically significant at 10%; ** 5%, *** 1%.
Year = 1999 -Year = 2000 -0.017*** (0.001) Year = 2001 -0.033*** (0.001) Year = 2002 -0.045*** (0.001) Year = 2003 0.012*** (0.001) Year = 2004 -0.035*** (0.002) Year = 2005 -0.015*** (0.002) Number of observations 75644
Note. Bootstrapped standard errors in parenthe-ses. * statistically significant at 10%; ** 5%, *** 1%.
OLS Mixed Returns to classroom training
- aged less than 25 0.040*** 0.017*** (0.002) (0.002) - aged between 25 and 34 0.031*** 0.012***
(0.000) (0.001) - aged between 35 and 44 0.038*** 0.012***
(0.000) (0.001) - aged between 45 and 54 0.031*** 0.009***
(0.001) (0.001) - aged between 55 and 64 0.026*** 0.007***
(0.002) (0.002) - aged 65 or more -0.011** -0.007
(0.002) (0.008) Demographic characteristics
Aged less than 25 -
-Aged between 25 and 34 0.063*** 0.049*** (0.000) (0.002) Aged between 35 and 44 0.080*** 0.068***
(0.000) (0.002) Aged between 45 and 54 0.084*** 0.077***
(0.000) (0.002) Aged between 55 and 64 0.070*** 0.067***
(0.001) (0.002) Aged 65 or more 0.028*** 0.048*** (0.000) (0.004) Women -0.051*** -0.048*** (0.000) (0.001) Married 0.023*** 0.017*** (0.000) (0.001) Black -0.022*** -0.029*** (0.001) (0.004) Other race 0.004*** -0.005*** (0.000) (0.001) Immigrant -0.015*** -0.015*** (0.000) (0.001)
Note. Bootstrapped standard errors in parentheses. * statistically significant at 10%; ** 5%, *** 1%.
OLS Mixed Less than a high school degree - -High school degree 0.013*** 0.006***
(0.000) (0.001) Trade or industry diploma 0.031*** 0.019***
(0.000) (0.001)
Some university 0.039*** 0.020***
(0.000) (0.001)
Bachelor degree 0.090*** 0.059***
(0.000) (0.002) University degree above bachelor degree 0.125*** 0.082***
(0.001) (0.002) Job Characteristics Seniority 0.008*** 0.005*** (0.000) (0.000) Seniority squared / 100 -0.025*** -0.014*** (0.000) (0.002) Seniority cubed / 100 0.003*** 0.001*** (0.000) (0.000) Union Member 0.011*** 0.013*** (0.000) (0.001) Managers - -Professionals -0.025*** -0.042*** (0.001) (0.002) Technical/Trades -0.101*** -0.090*** (0.000) (0.001) Marketing/Sales -0.146*** -0.131*** (0.001) (0.002) Clerical/Administrative -0.132*** -0.122*** (0.001) (0.002) Production workers -0.173*** -0.134*** (0.001) (0.002) Part-time worker -0.030*** -0.008*** (0.001) (0.001)
Note. Bootstrapped standard errors in parentheses. * statistically significant at 10%; ** 5%, *** 1%.
OLS Mixed Workplace characteristics 1-19 employees - -20-99 employees 0.026*** 0.014*** (0.001) (0.001) 100-499 employees 0.054*** 0.033*** (0.001) (0.002) 500 employees and more 0.071*** 0.051***
(0.001) (0.003)
Natural ressources -
-Primary product manufacturing -0.026*** -0.038*** (0.001) (0.006) Secondary product manufacturing -0.039*** -0.044***
(0.001) (0.005) Labour intensive tertiary manufacturing -0.096*** -0.086***
(0.001) (0.005) Capital intensive tertiary manufacturing -0.022*** -0.041***
(0.001) (0.006)
Construction 0.008*** -0.006
(0.000) (0.005)
Transportation -0.038*** -0.048***
(0.001) (0.005) Communication and other utilities -0.026*** -0.042***
(0.001) (0.006) Retail trade and consumer service -0.138*** -0.106***
(0.000) (0.005) Finance and insurance -0.005** 0.001
(0.001) (0.006)
Real estate -0.061*** -0.034***
(0.001) (0.006) Business service -0.036*** -0.046***
(0.001) (0.005) Education and health service -0.041*** -0.063***
(0.001) (0.006) Information and cultural industries -0.012** -0.040***
(0.001) (0.006)
Note. Bootstrapped standard errors in parentheses. * statistically significant at 10%; ** 5%, *** 1%.
OLS Mixed Year = 1999 - -Year = 2000 0.008*** 0.007*** (0.000) (0.001) Year = 2001 0.024*** 0.020*** (0.001) (0.001) Year = 2002 0.035*** 0.031*** (0.001) (0.001) Year = 2003 0.043*** 0.046*** (0.000) (0.001) Year = 2004 0.053*** 0.058*** (0.000) (0.001) Year = 2005 0.058*** 0.056*** (0.000) (0.001) Constant 0.975*** 1.021*** (0.001) (0.005) Number of sbservations 113427 113427 R-squared 0.54
Note. Bootstrapped standard errors in parentheses. * sta-tistically significant at 10%; ** 5%, *** 1%.
Natural logarithm of total employment 0.945*** (0.014) Proportion of employees aged between 35 and 44 undertaking classroom training 0.364***
(0.084) Proportion of employees aged between 35 and 44 not undertaking classroom training -Proportion of employees aged between 45 and 54 undertaking classroom training 0.483***
(0.070) Proportion of employees aged between 45 and 54 not undertaking classroom training 0.272***
(0.050) Proportion of employees aged between 55 and 64 undertaking classroom training 0.309***
(0.114) Proportion of employees aged between 55 and 64 not undertaking classroom training 0.266***
(0.072)
Note. Bootstrapped standard errors in parentheses. * statistically significant at 10%; ** 5%, *** 1%.
Organisational change Integration 0.118** (0.053) Re-engineering 0.062 (0.044) Downsizing 0.004 (0.052) TQM -0.027 (0.061) Centralization 0.270*** (0.060) Decentralization -0.049 (0.095) Delayering -0.143 (0.107) Outsource 0.091 (0.062) Collaboration 0.153** (0.067) Proportion of employees covered by a collective bargaining agreement 0.173* (0.099) Year = 1999 -Year = 2000 0.008 (0.038) Year = 2001 -0.087* (0.047) Year = 2002 -0.064 (0.052) Year = 2003 -0.114** (0.056) Year = 2004 0.017 (0.055) Year = 2005 0.018 (0.045)
Note. Bootstrapped standard errors in parentheses. * statistically significant at 10%; ** 5%, *** 1%.
Natural ressources -Primary product manufacturing -0.222***
(0.072) Secondary product manufacturing -0.126* (0.070) Labour intensive tertiary manufacturing -0.439***
(0.075) Capital intensive tertiary manufacturing -0.091
(0.094)
Construction -0.200***
(0.075)
Transportation 0.128
(0.079) Communication and other utilities -0.392***
(0.074) Retail trade and consumer service -0.743***
(0.075) Finance and insurance -0.010
(0.081)
Real estate -0.379
(0.093)
Business service -0.269***
(0.082) Education and health service 0.176
(0.073) Information and cultural industries -0.356***
(0.085)
Constant 10.982***
(0.089)
Observations 30563
R-squared 0.60
Note. Bootstrapped standard errors in parentheses. * statisti-cally significant at 10%; ** 5%, *** 1%.