————————————————————————
Development and validation of algorithms for
automatic and real-time
characterization of drowsiness
—————————————————–
Author: Clémentine Fran¸cois
Supervisor: Professor Jacques G. Verly
A thesis submitted in partial fulfillment of the requirements for
the degree of Doctor of Philosophy in Engineering Sciences
October 2018
Department of Electrical Engineering and Computer Science Faculty of Applied Sciences
Drowsiness is characterized by impairments of performance which can lead to disas-trous accidents, in particular in all types of transportation and high-risk industrial plants. Therefore, it is crucial to be able to measure the ability of an individual to perform cor-rectly and safely a task based on his/her level of drowsiness (LoD).
We thus developed a new, objective, automatic, and real-time drowsiness characteriza-tion system based on the analysis of ocular parameters extracted from images of the eye. The use of images of the eye is called, in this thesis, photooculography (POG), and this technique is recognized as one of the most significant and pratical technique to characterize drowsiness. In order to validate our POG-based drowsiness character-ization system, we compared, for a number of participants, the LoD determined by our POG-based system to several references: (1) the LoD obtained by visually analyz-ing polysomnographic (PSG) signals, (2) the performance in the accomplishment of a Psychomotor Vigilance Test (PVT), (3) the performance in the accomplishment of a Driving Session in a professional driving simulator, and (4) the self-assessed LoD using the Karolinska Sleepiness Scale (KSS).
The visual analysis of PSG signals is a very time-consuming task but is essential for the validation of drowsiness characterization systems. PSG is indeed considered by many experts as the gold standard for sleep. Therefore, we also developed, in this thesis, a new, automatic PSG-based system for characterizing drowsiness. This system is primar-ily intended to be used as a reference for the validation of non-PSG-based drowsiness characterization systems. To evaluate the performance of this automatic PSG-based sys-tem, we compared, for a number of participants, the LoD determined by our automatic PSG-based system to (1) the LoD obtained by visually analyzing PSG signals, (2) the performance in the accomplishment of a PVT.
To evaluate the performance of the two systems that we developed, we conducted two experiments. In Experiment A, 30 healthy volunteers performed three visual PVTs un-der increasing sleep deprivation over two days. In Experiment B, 12 healthy volunteers performed three Driving Sessions in a professional driving simulator under increasing sleep deprivation over two days. During each experiment, we recorded, for each partic-ipant, images of the eye, PSG signals, performance data (related to the task performed by the participant) and the self-assessed LoD using the KSS.
• our POG-based drowsiness characterization system has a significant potential for reliably determining the LoD of individuals accomplishing a task and ultimately for preventing drowsiness-related accidents. Furthermore, our POG-based system has the advantage of being non-invasive, usable in any condition, and of requiring no intervention from the individual.
• our PSG-based drowsiness characterization system has a significant potential to become a general reference for drowsiness characterization and to help scoring experts save time.
This work could not have been performed without the help of a large number of people. I would like to thank all those who have been involved in the realization of my thesis.
In particular, I would like to thank my supervisor, Jacques Verly, for having given me the opportunity to realize this thesis. Thank you for your availability, your wise and rel-evant advises (on scientific and technical aspects but also on how to present my research to the scientific community) through all these years. Thank you for your enthusiasm, your encouragements, and also for the careful reading of this manuscript.
I am grateful to Anne-Sophie Nyssen for accepting to be my co-promoter. Thank you for all the interesting discussions we had and that opened my mind to other considera-tions and perspectives. I hope I succeeded in including some of this knowledge in this manuscript.
Thank you also to the members of my jury for accepting the hard task to evaluate this work. I am very honored to have you all on my jury. Thank you especially to Dr. Poir-rier who followed my work, always encouraged me and brought me all his expertise in the domain of sleep and drowsiness.
Many thanks to all my colleagues from the University of Liège (especially Quentin Massoz and Philippe Latour) for their encouragements and all the rich discussions we had, and for bringing a good working atmosphere. I also thank the initial team of the project that led to the development of the innovative POG-based drowsiness character-ization system that is presented in this doctoral thesis. Thank you also to the whole Phasya team for their support and especially to Eva and Jérôme for the proofreading of this manuscript. Jérôme, a particular thank you for all your support, your kindness, and for your courage in all the steps and challenges we have gone through. I am proud to be your partner in Phasya and to have you as a friend.
I also wish to express my gratitude to all the participants who participated in our study and all the students who contributed through their Master thesis work.
I also wish to thank all my friends from the university of Liège and others (especially Sophie, Capucine, Charlotte, Stéphanie, Julie, Dorothée, Mélissa) for their eternal en-couragement and their wonderful friendship during the realization of this work.
son, Maxence) for always believing in me, for supporting me and bringing all the love I needed to get to the end of this job. Xavier, thank you especially for your patience, your unconditional support and for sharing my life for 8 years. Your presence on my side gave me the strength I needed to do this job. A particular thank you also to my son, Maxence, for being the greatest happiness of my life and giving me the motivation and the energy I needed to complete this work.
1 Introduction 1
1.1 Context . . . 1
1.2 Goal of the thesis . . . 3
1.3 Personal contributions in this thesis . . . 5
1.4 Outline of the work . . . 6
2 State-of-the art 8 2.1 Mechanisms of sleep and drowsiness . . . 8
2.1.1 Circadian process . . . 10
2.1.2 Homeostatic process . . . 11
2.1.3 Sleep inertia . . . 12
2.2 Excessive daytime sleepiness and sleep disorders . . . 12
2.3 Methods for drowsiness characterization . . . 14
2.3.1 Methods related to sleep propensity . . . 14
2.3.2 Methods for operational and real-time characterization of drowsi-ness . . . 19
2.4 Analysis of the state of the art and justification of our approach . . . 32
3 Description of our data and acquisition environment 36 3.1 Requirements for the development and test of our real-time drowsiness characterization system . . . 36
3.2 Data acquisition in laboratory . . . 39
3.2.1 Protocol of Experiment A . . . 39
3.2.2 Protocol of Experiment B . . . 41
3.2.3 Material and data acquired . . . 42
3.3 References for performance evaluation . . . 43
3.3.1 Analysis of physiological reference (visual scoring of PSG sig-nals) . . . 44
3.3.2 Analysis of task-performance references . . . 50
3.3.3 Analysis of subjective reference (KSS) . . . 58
3.4 Summary of chapter . . . 59
4 Development and test of an innovative POG-based drowsiness characteri-zation system 60 4.1 Introduction . . . 60
4.3 Material and methods . . . 63
4.3.1 Extraction of features via image processing and analysis . . . . 64
4.3.2 Computation of ocular parameters indicative of drowsiness . . . 65
4.3.3 Conversion into a POG-based level of drowssiness . . . 66
4.3.4 Methods for performance evaluation . . . 67
4.4 Experimental results and evaluation of performance . . . 71
4.4.1 Effect of sleep deprivation on the POG-based level of drowsiness 71 4.4.2 Relations between the POG-based level of drowsiness and all references . . . 74
4.4.3 POG-based level of drowsiness as predictor of lapses . . . 78
4.4.4 Relations with OPs . . . 79
4.5 Discussion . . . 80
4.6 First adaptation to process face images instead of eye images . . . 84
4.6.1 Method . . . 85
4.6.2 Results . . . 86
4.6.3 Discussion . . . 88
4.6.4 Summary . . . 88
4.7 Summary of chapter . . . 89
5 Development and test of an innovative PSG-based drowsiness characteriza-tion system 90 5.1 Introduction . . . 90
5.2 State of the art . . . 92
5.3 Material and methods . . . 94
5.3.1 Preprocessing . . . 95
5.3.2 Extraction of features via signal processing and analysis . . . . 96
5.3.3 Conversion into an automatic PSG-based LoD . . . 103
5.3.4 Performance evaluation methods . . . 104
5.4 Experimental results and performance evaluation . . . 105
5.4.1 Evaluation of the performance of each detector of a sign of drowsiness . . . 105
5.4.2 Relation between the automatic PSG-based LoD and several references . . . 106
5.5 Discussion . . . 108
5.6 Summary of chapter . . . 110
6 Conclusion 111
2.1 Sleep wake cycle [1]. . . 10 2.2 Block diagram of the methods related to sleep propensity. . . 14 2.3 Block diagram of the methods related to the operational and real-time
characterization of drowsiness. . . 20 2.4 Illustration of the nine (9) EEG-based states proposed by Hori and Tanaka
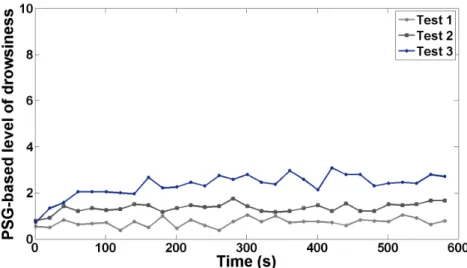
[2]. . . 26 3.1 Data acquisition protocol (Experiment A). . . 41 3.2 Example of a scoring sheet for PSG signals based on the KDS method. . 46 3.3 Evolution of the mean PSG-based LoD as a function of time for PVT
Tests 1, 2, and 3. . . 47 3.4 PSG-based LoD as a function of PVT Tests 1, 2, and 3. . . 48 3.5 Proportions of signs of drowsiness as a function of PVT Tests 1, 2, and 3. 49 3.6 Differences of PSG-based LoD between subjects regardless of their sleep
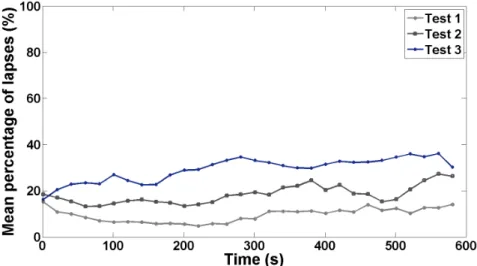
deprivation condition. . . 50 3.7 Evolution of the mean RT as a function of time for PVT Tests 1, 2, and 3. 52 3.8 Evolution of the percentage of lapses as a function of time for PVT Tests
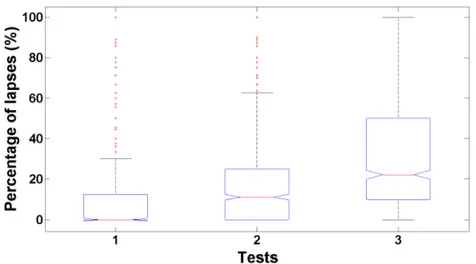
1, 2, and 3. . . 52 3.9 RT as a function of PVT Tests 1, 2, and 3. . . 53 3.10 Percentage of lapses as a function of PVT Tests 1, 2, and 3. . . 53 3.11 Differences of mean RT between participants regardless of their sleep
deprivation condition. . . 54 3.12 Differences of percentage of lapses between participants regardless of
their sleep deprivation condition. . . 55 3.13 Illustration of the Standard Deviation of the Lateral Position (SDLP). . . 56 3.14 Evolution of the SDLP as a function of time for Driving Sessions 1, 2,
and 3. . . 57 3.15 SDLP as a function of driving Sessions 1, 2, and 3. . . 57 3.16 Differences of SDLP between participants regardless of their sleep
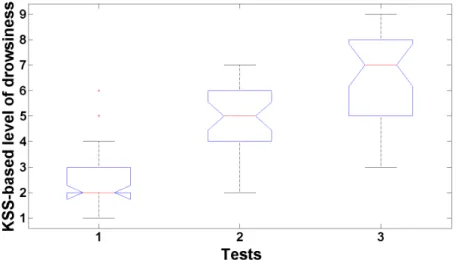
de-privation condition. . . 58 3.17 KSS as a function of PVT Tests 1, 2, and 3. . . 59 4.1 Block-diagram of our POG-based drowsiness characterization system. . 64 4.2 Example of eye image recorded by the prototype of the Drowsimeter
4.3 Example of the extraction of the positions of both eyelids and of the
position of the pupil in an eye-opened image. . . 65
4.4 Example of the extraction of the positions of both eyelids in an eye-closed image. . . 65
4.5 Illustration of the table of confusion. . . 69
4.6 Evolution of the POG-based LoD as a function of time for PVT Tests 1, 2, and 3. . . 72
4.7 POG-based LoD as a function of PVT Tests 1, 2, and 3. . . 73
4.8 Variability of POG-based LoD between participants regardless of their sleep deprivation condition. . . 74
4.9 Relation between POG-based LoD and the corresponding PSG-based LoD. . . 75
4.10 Relation between POG-based LoD and three PSG-based zones repre-senting three different risk-levels. . . 76
4.11 Relation between POG-based LoD and RTs. . . 76
4.12 Relation between POG-based LoD and percentage of lapses. . . 77
4.13 Relation between POG-based LoD and SDLP. . . 78
4.14 Relation between POG-based LoD and KSS. . . 78
4.15 ROC curve describing the relation between POG-based LoD and lapses for the threshold values from 0 to 10. . . 79
4.16 Correlations between selected OPs and POG-based LoD and alpha rhythm, theta activity, and PSG-based LoD. . . 80
4.17 Block diagram of our method to adapt our head-mounted drowsiness characterization system to process face images instead of eye images. . 85
4.18 Mean values of three measures (PERCLOS, RT, percentage of lapses) as a function of the three LoDs. . . 86
4.19 PERCLOS as a function of LoD determined by system B. . . 87
4.20 Reaction time as a function of LoD determined by system B. . . 87
4.21 Percentage of lapses as a function of LoD determined by system B. . . . 88
5.1 High level block-diagram of our automatic PSG-based drowsiness char-acterization system. . . 95
5.2 Representation of an analytic two-components signal with constant am-plitude and frequency in the complex plane [3]. . . 99
5.3 Block diagram of the HVD global method [4]. . . 100
5.4 Example of a dominant component extracted from an EEG signal using the HVD method. . . 101
5.5 Vertical EOG signal (above) and its derivative (below). . . 102
5.6 Detailed block diagram of our automatic PSG-based drowsiness char-acterization system. . . 104
5.7 Results of cross-validation of each detector of a sign of drowsiness. . . 106
5.8 Correlation between the automatic based LoD and the visual PSG-based LoD. . . 106
5.9 ROC curve describing the relation between the automatic PSG-based LoD and the visual PSG-based LoD for several threshold values from 0 (at top right) to 100 (at bottom-left). . . 107 5.10 Relation between the automatic PSG-based LoD and the percentage of
AASM American Academy of Sleep Medicine ANN Artificial Neural Network
AUC Area Under the Curve BCI Brain Computer Interface
BSRT Behavioral Sleep Resistance Task EDS Excessive Daytime Sleepiness EEG ElectroEncephaloGram EMG ElectroMyoGram EOG ElectroOculoGram ESS Epworth Sleepiness Scale FFT Fast Fourier Transform HHT Hilbert Huang Transform HR Heart Rate
HRV Heart Rate Variability HT Hilbert Transform
HVD Hilbert Vibration Decomposition IMF Intrinsic Mode Functions
IR Infrared
JDS Johns Drowsiness Scale JTV Johns Test of Vigilance KDS Karolinska Drowsiness Scale KSS Karolinska Sleepiness Scale LoD Level of Drowsiness
MSLT Multiple Sleep Latency Test MWT Maintenance of Wakefulness Test NREM Non-Rapid Eye Movement
NTSB National Transportation Safety Board OA Ocular Artifact
OOG OptoOculoGraphy OP Ocular Parameter
OSLER Oxford Sleep Resistance Test OSS Objective Sleepiness Scale PCA Principal Component Analysis PERCLOS PERcentage of eye CLOSure POG PhotoOculoGraphy
ROC Receiver Operating Characteristics RT Reaction Time
SDLP Standard Deviation of the Lateral Position SEM Slow Eye Movement
SSS Stanford Sleepiness Scale STFT Short Time Fourier Transform SVM Support Vector Machine VAS Visual Analog Scale
Introduction
1.1
Context
Drowsiness is recognized as being a major cause of several types of accidents, espe-cially for drivers, operators of equipment, and supervisors of large industrial complexes. Drowsiness is indeed an unintentional and uncontrollable need to sleep that can occur at any time of the day and that can affect everyone. There are, however, some specific factors that promote onset and evolution of drowsiness. The appearance of drowsiness during the day depends strongly on the alternation of the sleep/wake cycle, which is regulated by two physiological mechanisms/processes: the circadian process (our in-ternal biological clock) and the homeostatic process (our sleep debt). There are thus some moments more conducive to drowsiness than others. Moreover, drowsiness can also be promoted, among others, by a lack of sleep, taking certain medication, alcohol, or drugs, and suffering from a sleep pathology.
Drowsiness induces hypo-vigilance, which consists in a decrease in reactivity to the environment. The drowsy or hypo-vigilant individual is thus affected by a deficit in information processing and a slowing down of the reaction time which can both cause dramatic accidents. More generally, drowsiness impairs an individual’s judgment and ability to execute a task correctly [5, 6].
In the particular case of road driving, drowsiness is estimated to be responsible for 20 to 30% of road accidents [7]. It can indeed lead to difficulties in maintaining a constant speed, a correct distance between vehicles, and a proper position on the road, resulting in involuntary lane changes among other things. These various manifestations can un-fortunately result in serious accidents. In the USA, more than 72,000 police-reported traffic accidents caused by drowsiness are recorded every year [8]. In France, drowsiness (sometimes loosely referred to as “fatigue”) is the main cause of fatal accidents; drowsi-ness indeed accounts for 27% of fatal accidents [9]. Moreover, it is widely accepted that these figures underestimate the reality. Some drivers indeed die from such accidents, and crash investigators must look for clues that could demonstrate that drowsiness was the, or a, factor leading to the accident, but these clues are not always detectable. Other drivers prefer to hide the real causes because of concern with their vehicle insurance.
In 2007, in France, a study showed that 4% of drivers had at least one “near-crash” due to drowsiness in the past year, which represent 1.5 million motorists [10].
In addition, the results of another study carried out by researchers from the sleep unit of the hospital "Raymond-Poincare de Garches", in France, in 2014, with 375 truckers are alarming. Results show that 30% of drivers felt that they could have an accident due to drowsiness, and that one in ten drivers admitted to having experienced an episode of severe drowsiness that forced them to stop. They also indicate that 28% of drivers have slept less than 6 hours before taking the wheel [11].
In a study by Hakkanen and Summala in 2000 on truckers, 40% of long-haul drivers reported having trouble staying alert for at least 20% of their conduct and 20% admitted dozing at least twice during each trip [12].
Furthermore, the risk of being drowsy while driving is increased by different factors, e.g. if the driver drives in the time interval between 2:00 am and 5:00 am, if the driver suffers from sleep disorders such as narcolepsy or sleep apnea, or if the driver has a sleep debt (as is the case for a driver who slept 5 hours or less on the day before the start of his1 trip) [13]. In addition, after 24 hours of activity without sleep, the effect of drowsiness is equivalent, in terms of reflexes, to having a blood alcohol level of 1 g/l. In Belgium, the legal limit of alcohol concentration per liter of blood that must not be exceeded to be authorized to drive is 0.5 g/l. This means that being active for more than 24 hours is equivalent to exceeding twice the legal limit.
The most affected are drivers under 25 of age, drivers over 50, and irregular workers. Young novice drivers indeed constitute a very vulnerable population in terms of road safety and, in particular, concerning drowsiness at the wheel [14]. This would be due to poor risk assessment, poor lifestyle (young people pay less attention to sleep), and ex-cessive trust in themselves. By contrast, older, more experienced drivers are more likely to be affected by the deterioration in physical and cognitive abilities related to age. Drowsiness is therefore a critical safety problem and contrary to what one might think, this problem will not disappear with the emergence of vehicle automation. Indeed, the automatic driving systems already found in today’s vehicles, such as cruise control, fur-ther increase the risk of drowsiness while driving. Indeed, by replacing the continuous and stimulating activity of regulating speed by a passive surveillance activity, these sys-tems increase the monotony of the task and thus promote the appearance of drowsiness. Virtually, all vehicles today (2018) are at most at level 2 of vehicle automation on a scale from 0 to 5 (the classification was established by the Society of Automotive Engineers). The car manufacturers are now working on level 3 cars, which are expected to appear around 2018-2020. Level 3 would enable cars to drive alone in certain environments such as the highway but a driver would still have to be present and be able to take back
1Throughout, the generic masculin he, his, himself, etc. is used for concisness. He/his also means
the control of the vehicle in a relatively short lapse of time. In order to ensure that the driver is able to take back the control of the vehicle, technologies for monitoring the state of the driver will become essential. At present, some manufacturers offer systems for monitoring the behavior of the driver and the behavior of the vehicle, such as the detection of lane deviations. These systems are very useful at the current automation level (2), but they will become obsolete at the subsequent stages (3-5). Indeed, when the car will drive autonomously, monitoring its behavior will not give any information on the state of the driver, and technologies that directly monitor the driver by analyzing physiological parameters will become a necessity.
Drowsiness affects not only road transport sector but also other types of transport (rail, air, etc.) as well as industry. An impressive series of transportation and industry disas-ters occurred during night work and when the level of human vigilance was low, mainly between 2:00 am and 5:00 am. One can cite, without limitation, the nuclear accidents at Chernobyl in 1986 (around 1:30 am), Three Mile Island in 1979, the Bhopal tragedy in 1984 (around 2:00 am), the explosion of the shuttle Challenger in 1986, or the more recent train accident in 2014 in Chicago (during the day).
The National Transportation Safety Board (NTSB) in the USA has been fighting for years to reduce fatigue-related accidents in transportation and has even made it an im-portant item on its most wanted transportation safety improvements for 2017-2018 [15].
More generally, automation and computerization have transformed human activity. We are more and more assisted in our professional and personal activities. We remain in the system to monitor the process, monitor the devices, and occasionally regain control in unexpected situations but the problem is that it deprives us from some physical and cognitive stimulation, and this encourages the onset of drowsiness and thus makes us less able to make good decisions or perform critical tasks. The solution is not to ban computerization and automation because they allow us to increase our skills and intel-lectual capacities but rather to verify that we are able to work with these technologies while performing the tasks that are still under our responsibility and that are sometimes critical for our safety.
Characterizing drowsiness, monitoring its level, and determining the times when it reaches a dangerous level thus constitute an important “grail” and valuable endeavor in the area of public health and safety.
1.2
Goal of the thesis
The specific problem addressed in this thesis is to study the phenomenon of drowsiness and to develop an automatic and real-time drowsiness characterization1 system, mainly
from physiological parameters, and that would be usable in any operational environ-ment. In order to establish contextualized thresholds that are critical to safety, we also
link the characterization of drowsiness from physiological parameters to the evaluation of the performance of individuals in the execution of a task and of the risks associated with a particular situation. Even though drowsiness is a physiological state that can be characterized by physiological parameters, one cannot ignore the context in which such drowsiness arises. It is necessary to be able to determine the state of drowsiness of an individual based on physiological parameters but the level of the associated risk will vary from one application/situation to another.
Another important concept addressed in this thesis is the validation of drowsiness char-acterization systems. It is indeed essential to prove the effectiveness and the reliability of such systems if one wants to use them in real life. Therefore, we also proposed a validation strategy and used that strategy to validate the drowsiness characterization system that we developed. In addition, we also developed another automatic drowsiness characterization system based on physiological parameters to serve as a reference (i.e. ground truth, gold standard)1 for the validation of other systems.
Our approach for the work reported here thus consisted in several steps.
First, we started, not surprisingly, with a review of the literature to identify the different methods for characterizing drowsiness. In this review, we defined several criteria in order to propose a classification of all the methods identified and we performed an analysis of the literature that enabled us to:
1. Determine that the use of images of the eye, i.e. photooculography (POG), ap-pears to be the best method for characterizing drowsiness in operational settings since it is completely physiology based, task independent, and non invasive. The eye activity reflects brain activity and some ocular parameters are recognized by the scientific community as very good indicators of an individual’s state of drowsi-ness.
2. Realize that there is no universal agreement on the reference to be used to evaluate the state of drowsiness of an individual and thus to validate drowsiness character-ization systems. We therefore decided to use four references to assess the state of drowsiness: a physiological reference, two performance references, and a sub-jective reference. To concentrate our efforts, we carried out our research with the tasks of psychomotor vigilance and driving in a professional driving simulator. However, the methodology and results used in this doctoral thesis can easily be generalized to other critical processes for the safety of individuals and goods in various sectors such as aviation, maritime, nuclear, and medical.
Second, we worked on the development of an innovative POG-based drowsiness char-acterization system that is usable in operational environments, and that continuously, objectively, and automatically determines a level of drowsiness (LoD) on a numerical scale. This system is based on several key ocular parameters, the values of which are
obtained from (video) images of the eye.
Third, we needed to verify that the LoD determined by our POG-based drowsiness characterization system was well related to the several references: (1) the LoD obtained by analyzing visually polysomnographic (PSG) signals (physiological reference), (2) the performance of individuals in the accomplishment of a Psychomotor Vigilance Test (PVT), (3) the performance of individuals in the accomplishment of a driving session in a simulator, and (4) the self-evaluated LoD using the Karolinska Sleepiness Scale (KSS) (subjective reference).
Polysomnography (PSG) is used as a reference because it is considered to be the “gold standard” for quantifying sleep and thus, for most experts, also the best physiological reference to study drowsiness. When experts analyze the PSG signals to determine in which sleep stage an individual is, they visually analyze the signals via consecutive (non-overlapping) time windows. One says that the experts score the signals. This op-eration of scoring is very time consuming and the results may differ from one scorer to another.
Fourth, we therefore also developed an innovative, automatic, PSG-based drowsiness characterization system using signal processing and machine learning techniques, to-gether with a drowsiness characterization method based on the Karolinska Drowsiness Score (KDS). This system aims to have a common, automatic, and objective reference for the assessment of an individual’s state of drowsiness and thus to be able to vali-date other drowsiness characterization systems that would, in general, be less invasive and better suited for the operational environment. Moreover, this automatic PSG-based drowsiness characterization system could also be used as a diagnostic tool for people with excessive daytime sleepiness (EDS), which may be due to sleep disorders.
We thus conducted several experiments to acquire data in order to help us to develop our two drowsiness characterization systems (i.e. POG-based and PSG-based) and to validate them. In each experiment, the healthy participants were asked to perform three tests over two consecutive days, and they were not allowed to sleep between the first and last test, with the result that the successive tests are at increasing levels of sleep deprivation.
1.3
Personal contributions in this thesis
The present thesis includes the following main personal contributions: • Proposal of a classification of methods to characterize drowsiness; • Development of the experimental protocol;
• Definition of the list of ocular parameters to use in our POG-based drowsiness characterization system (not fully disclosed in this thesis);
• Development of methods to compute ocular parameters from the positions of the eyelids and of the pupil in each eye image (not fully disclosed in this thesis); • Development of methods to determine a numerical LoD from a set of ocular
pa-rameters (not disclosed in this thesis);
• Development of a strategy for the validation of the two drowsiness characteriza-tion systems that we developed;
• Development of new criteria for the visual analysis of PSG signals via the Karolin-ska Drowsiness Scale (KDS);
• Validation of our POG-based drowsiness characterization system by comparison with several references;
• Development of an innovative, automatic, PSG-based drowsiness characterization system;
• Validation of the innovative, automatic, PSG-based drowsiness characterization system;
• Proposal of thresholds based on our POG-based drowsiness scale to alert individ-uals before they constitute a risk.
The main results of this thesis were presented in journal publications and conference proceedings. The list of all the publications is given at the end of this report.
1.4
Outline of the work
Chapter 2 introduces the physiological background on drowsiness and reviews the dif-ferent methods for characterizing drowsiness. An analysis and a discussion of the meth-ods are given at the end of the chapter and a justification of the chosen approach for the development of a drowsiness characterization system is also provided.
Chapter 3 presents our data acquisition environment as well as the data that are used later as references to validate our drowsiness characterization systems. The chapter includes a description of the requirements that we established, the protocol that we developed to acquire relevant data, and the analysis of the data related to the references.
Chapter 4 describes the innovative POG-based drowsiness characterization system that we developed. This chapter explains our motivation and gives an overview of the meth-ods that we implemented. We dedicated the main part of this chapter on the evaluation of the performances of our system. We showed the results of (1) the effect of sleep deprivation on our POG-based LoD, (2) the relation between our POG-based LoD and
the references, (3) our POG-based LoD as predictor of failure, and (4) the comparison with well-known ocular parameters. At the end of the chapter, we discuss the results and draw a conclusion.
Chapter 5 is dedicated to the development of the automatic, reference, PSG-based drowsiness quantification system. This chapter gives our motivation and the details of the implemented method. The global method involves a preprocessing step, the ex-traction of features via signal processing, and a conversion step into an automatic PSG-based LoD using a machine learning technique. The two last parts of the chapter then focus on the results and the discussion.
State-of-the art
This chapter describes the state of the art in drowsiness and the existing methods to characterize it. Section 2.1 explains what the drowsiness phenomenon is, why it occurs, and how the sleep-wake cycle is biologically regulated. Section 2.2 contains a descrip-tion of excessive daytime sleepiness (EDS) and of sleep pathologies that can induce drowsiness. Section 2.3 approaches the existing, traditional methods to characterize drowsiness, whether in the sleep clinic or in operational environments. In particu-lar, we distinguish between subjective methods (based on self-evaluation) and objective methods (based on physiological parameters or performance of an individual). Section 2.4 concludes by describing the method selected for the development of our drowsiness characterization system and the methods selected to evaluate and validate it.
2.1
Mechanisms of sleep and drowsiness
The drowsiness of an individual can be seen as a physiological state where this indi-vidual is inclined to sleep and has difficulty to stay awake. This state is intermediate between complete wakefulness (where the individual is fully alert) and sleep. Just as hunger and thirst are the instincts that drive us to eat and drink, drowsiness is the instinct that drives us to sleep; it is a physiological necessity [16].
Drowsiness should not be mistaken with fatigue, especially due to physical or mental effort. Indeed, fatigue is an affect, an emotion experienced in the present. It is a feeling of weakness felt after an effort and it may be associated with a biochemical or phys-iological change in muscle or the brain. Drowsiness is more of a state influenced by various physiological mechanisms, an irresistible tendency to doze. The individual is seized with sleep drive. Drowsiness is characterized by a lack of awareness of the here-and-now, and this is not the case for fatigue. This lack is the reason for the dangers of drowsy driving. We can be drowsy without being tired, and tired without being drowsy, and we can be both tired and drowsy [17, 18].
A sleep specialist at the Centre Hospitalier Universitaire (CHU) of Bordeaux, Philip, said: “Fatigue is the increasing difficulty to accomplish an effort, while drowsiness is
the inability to stay awake” [19].
The term “drowsiness” is often used interchangeably with the words “sleepiness” or “somnolence”, which are considered synonyms in this thesis.
The consequences of drowsiness are numerous: shortened sleep latency, increased at-tention deficits, increased slowed cognitive functions, and increased reaction times with consecutively impaired performance, leading to work or motor accidents. From the per-spective of the individual, drowsiness reduces not only the efficiency at work, but it also leads to problems with concentration, memory, and mood, all of which also affect per-formance and quality of life [5, 20, 21].
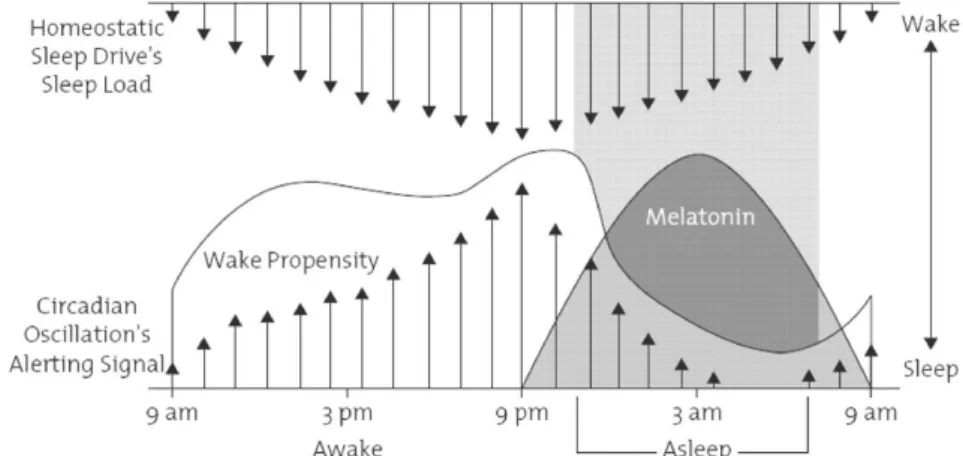
In addition, several physiological mechanisms that regulate periods of wake and sleep, such as the circadian and homeostatic processes, as well as sleep inertia, may favor the appearance of drowsiness at certain times during the day. These three mecha-nisms/processes are described in more details in subsections 2.1.1, 2.1.2, and 2.1.3. Our body indeed needs sleep to maintain good functioning and health. We are pro-grammed to sleep every night like a means to restore our body and our mind. Sleep pressure, or the need for sleep, varies along the day and the alternation between wake and sleep needs to coincide with certain biological processes. Man is indeed a diurnal animal, which is active during the day and inactive during the night. Sleep pressure is thus high at night and increases as we approach the moment of falling asleep. Con-versely, after waking up, the body evacuates its need for sleep [22]. There is therefore a time period conducive to sleep. Two systems interact together to determine the time of the transitions between wake and sleep: the circadian process and the homeostatic process. These processes were modeled and described in the model of Borbely et al. in 1982; he called them Process C (circadian) and Process S (homeostatic), respectively [23]. This model can be illustrated by a balance with, on the one hand, the weight of the circadian process and, on the other hand, the weight of the homeostatic balance. The two processes also explain why, in normal conditions, we stay awake during the day and we sleep during the night. Waking and sleeping alternate in a periodic cycle throughout an individual’s life.
In the brain, when the regions responsible for wakefulness are active, they inhibit the activity of the regions responsible for sleep, and conversely. Several regions in the brainstem and the hypothalamus promote wakefulness by sending signals to the cere-bral cortex. These signals are called neurotransmitters. When the neurons in the wake-fulness regions are active, neurotransmitters are sent to the cortex which is activated and we are awake. Examples of neurotransmitters that are involved in controlling wake and sleep are histamine, dopamine, serotonin, and orexin. Histamine is released by neu-rons present in a region promoting wakefulness (the tuberomammilary nucleus (TMN)). Interestingly, several antihistaminic medications block wakefulness and induce drowsi-ness. Serotonin is notably used by our body under the control of our circadian clock to produce melatonin, also called the “sleep hormone”. The production of melatonin
increases in the evening, thus causing drowsiness [24, 25, 26].
Figure 2.1 shows the interaction of the circadian process and the homeostatic process, together with the secretion of melatonin.
Figure 2.1:Sleep wake cycle [1].
2.1.1
Circadian process
A variety of biological functions - food intake, hormonal secretions (e.g. melatonin, cor-tisol), body temperature - including the sleep-wake cycle obey a circadian process. The term comes from the latin “circa” (meaning “around” or “approximately”) and “dies” (meaning “day”), and refers to functions that operate in a cycle of about 24 hours. These circadian processes are synchronized and coordinated by an internal biological clock that plays the role of conductor.
Our biological clock is located in the heart of the brain, in the hypothalamus organ. This clock has a spontaneous activity and it regulates circadian processes through its connec-tions to various parts of the body. It is our internal clock that determines the “sleep windows”, i.e. the favorable moments to sleep.
This biological clock thus has an endogenous activity, but it must still be synchronized to 24 hours because, in reality, our biological rhythms last more than 24 hours, and specifically 24h10min. For example, in 1962, Michel Siffre, a French speleologist, spent two months at the bottom of Scarasson abyss, without any watch and without any daylight. His cycles shifted daily, and at the end of two months, he took his breakfast around 7:00 pm and went to bed in the late morning [27]. Therefore, our clock needs to be reset to 24 hours and this is the role of the zeitgebers (time donors) such as light and social factors (eating meals, working hours, etc.). The zeitbegers are indeed exogenous environmental cues that help to synchronize our internal clock [26] to the evolution of time in the physical world. The most powerful zeitgeber is light because it inhibits the secretion of melatonin. Melatonin is indeed synthesized from serotonin and secreted by
the pineal gland in response to the absence of light. Melatonin levels are high during the night and zero during the day. Melatonin secretion begins 1-2 hours before sleep with a peak of secretion between 2:00 and 4:00 am, and its levels are very low 1-2 hours after awakening. The light that reaches the retina acts on the suprachiasmatic nucleus via the optic nerve. The light information is then sent to the pineal gland, which blocks the secretion of melatonin. This hormone is secreted with an intensity four times higher in winter than in summer. The effect of the light depends on the light intensity, its du-ration, and its spectral composition. In fact, the more the light is intense and the longer it lasts, the greater the effect is. Exposure to a light of 2,000 lux (which corresponds to the light intensity that does not require one to use a flash to take a picture) for 2 hours is sufficient to significantly reduce melatonin secretion, and thus shift the biological clock and the sleep-wake cycle. In addition, a light of 480 nm wavelength (blue) is the most effective in blocking the secretion of melatonin. It is as effective as a white fluorescent light 100 times more intense [28, 25].
Melatonin therefore acts as a biological marker of the internal time. Indeed, it is through its production that the brain is informed about the relative duration of the hours of dark-ness and light on a period of 24 hours, as well as throughout the year.
The circadian organization (24 hours) of drowsiness is also linked to changes in body temperature. Temperature reaches a minimum in the middle of the night and a maxi-mum late in the day. The cycle of temperature coincides with that of vigilance. The cyclical variation of temperature determines the “sleep windows”. Thus, the decrease in body temperature plays a key role in the onset of drowsiness. We fall asleep more easily when our temperature drops, and we wake up a few hours after the minimum tempera-ture. Moreover, what many call “the nap of the afternoon” actually represents a slight drop in temperature curve around 15h. The drop in core temperature occurs twice per 24h and thus determines the periods of drowsiness. Indeed, the curve of the circadian process has two hollows, one in the early afternoon and one at night, that make us more conducive to sleep and drowsiness [22].
Other factors intervene to prepare sleep such as decreased heart rate and decreased cor-tisol secretion.
All of the above also explains why shift workers or people travelling and changing time zones are more likely to often experience periods of drowsiness because they disrupt their normal cycle of wake and sleep.
2.1.2
Homeostatic process
Sleep is also regulated by homeostatic mechanisms. Specifically, the need for sleep in-creases during wakefulness and dein-creases during sleep; the less we sleep, the more we need to sleep. To describe this homeostatic process, one talks about “homeostatic debt”. A debt that increases with the wake time and decreases with the sleep time. Thus, the more the time awake increases, the more the sleep pressure becomes significant. When
this homeostatic debt reaches its high threshold, sleep occurs. When we sleep, the debt decreases to the low threshold and awakening occurs. In case of sleep deprivation, the return to equilibrium is manifested by increased drowsiness (proportional to the duration of arousal) and by a boost of compensatory sleep (including an increase of the percent-age of slow waves sleep). Adenosine is thought to play a critical role in the homeostatic debt but it may not explain this complete phenomenon [29, 26].
Sleep is especially beneficial for the brain, and acute sleep deprivation (a sleepless night) causes daytime sleepiness and excessive fatigue, mental slowing, and a reduction of at-tention, concentration, and reflexes. In the long term, sleep deprivation causes an in-crease in appetite (with subsequent weight gain), and a dein-crease in alertness, mood, and motivation [6].
Sleep deprivation is unfortunately common in today’s society. Technologies have indeed completely changed the rhythms of our lives; we live in a society where productivity is the key word and where sleep has less and less place.
2.1.3
Sleep inertia
Sleep inertia is a physiological state that occurs directly after awakening (from a night’s sleep or a day’s nap). It is defined as the feeling of grogginess and is characterized by impaired alertness, which can lead to decreased performance in the execution of a task. This state can therefore be dangerous for workers who must take crucial decisions, or act, directly after being awakened [30], e.g. doctors working in hospitals.
Sleep inertia would be caused by the accumulation of adenosine during deep sleep. The duration of sleep inertia varies between 10 and 30 minutes but, in some cases, it can last up to a few hours. The duration and the severity of sleep inertia is influenced by several factors such as the depth of sleep when awakened. If the brain is in the slow-wave sleep stage when awakened, this indeed encourages sleep inertia and reaction times are very slow. Other factors that influence sleep inertia are the phase of the circadian clock of each individual and caffeine intake. Caffeine blocks adenosine receptors in the brain, thus decreasing greatly sleep inertia [31].
2.2
Excessive daytime sleepiness and sleep disorders
All individuals can be normally affected by drowsiness during the course of the day due to the physiological mechanisms/processes described above, but some people have a higher propensity than normal to drowsiness. Indeed, 6 to 11% of the population report a lot of drowsiness during the day, much more than normal. One says that this part of the population suffers from severe excessive daytime sleepiness (EDS) [32].
EDS is a common complaint encountered in the overall population and in neurological practice. In 2001, a study by Guilleminault reported that, according to the “National
Sleep Foundation 2000 Omnibus Sleep in America Poll”, 43% of adults say they are sleepy during the day and that this interferes with their daily activities a few days per month; and 20% of adults report suffering from daytime sleepiness at least a few days a week [33]. In 2009, Powell even showed that a drop in performance due to drowsiness may be worse than that associated with alcohol [34].
It is difficult to find a clear definition of EDS in the literature because it is not a pathol-ogy, it is more a symptom of a sleep disorder (particularly of hypersomnia or narcolepsy) or of insufficient time allowed for sleep. In addition, there is no standardized methods to assess EDS. Some experts use well-known questionnaires (e.g. Epworth Sleepiness Scale) but others prefer to use a clinical evaluation in a sleep clinic (using for example the Maintenance of Wakefulness Test). The methods for assessing drowsiness will be discussed in the next section. What is certain is that sleepiness (or drowsiness) is con-sidered excessive when an individual is unable to remain alert during waking hours and in situations where it is crucial to be attentive [21].
There are many sleep disorders that cause fragmented sleep and that manifest them-selves as drowsiness. The best known is the sleep apnea disorder that affects a large part of the population. One can also cite narcolepsy, for which the prevalence is much lower than for the sleep apnea disorder, and hypersomnia. Individuals suffering from sleep disorders are therefore at risk when they perform a critical task such as driving.
In 2001, a study by Leger and Vecchierini states that chronic sleepiness (or drowsiness) in adults has a prevalence of 15 to 20% of the adult population when it is moderate and 6 to 11% of the adult population when it is severe [32].
Apart from sleep disorders, drowsiness can also be due, among others, to • other diseases such as diabetes, obesity, depression, etc.,
• consuming alcohol, • consuming drugs,
• taking some medications, • performing a monotonous task.
In the next section, we cover the main traditional methods to characterize drowsiness. The review is not exhaustive but it gives a broad view of what exists.
2.3
Methods for drowsiness characterization
For many years, researchers have conducted studies to better understand drowsiness and to try to characterize and monitor this phenomenon. Several methods exist and there are different ways to classify them. The way we selected is as follows.
• First, we partition the methods in two categories on the basis of the nature of the drowsiness measure, i.e. sleep propensity (specific to the field of medical diag-nostics) vs. real-time level of drowsiness (LoD). The methods related to sleep propensity quantify, via a medical evaluation in a sleep laboratory or a question-naire, the risk that an individual falls asleep at some future time. The methods related to the real-time LoD provide, via an analysis of physiological parameters or an analysis of performance parameters or a questionnaire, an indication of the LoD of an individual in the present. The criterion of speed of delivery of the measure (“timescale”) is thus important to discriminate the two categories. • Second, in each category, we consider the dichotomy of objective methods vs.
subjective methods. Subjective methods are mainly based on questionnaires and refer to self reported mesurements while objective methods are mainly based ei-ther on performance measures or on physiological measures.
2.3.1
Methods related to sleep propensity
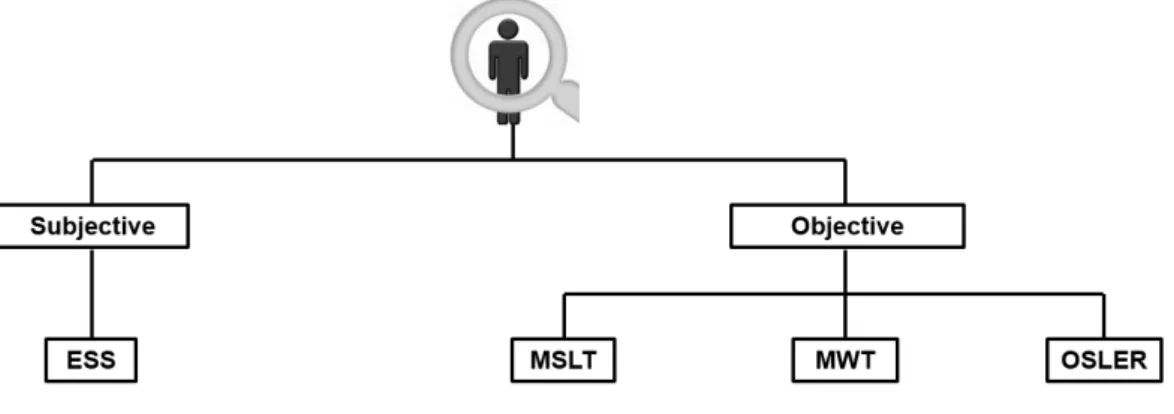
Figure 2.2 shows the block diagram of the different methods related to sleep propen-sity to quantify drowsiness (represented by their acronyms). All methods are detailed hereafter.
Figure 2.2: Block diagram of the methods related to sleep propensity.
Subjective method
The subjective method described below yields a sleep propensity via the use of a ques-tionnaire. The answers to the questionnaire are provided directly by the individual
tested.
Epworth Sleepiness Scale (ESS)
The Epworth Sleepiness Scale (ESS) is a subjective scale that was proposed by Johns in [35]. It measures sleep propensity by asking the individual about the likelihood of dozing off in particular situations of daily life. It does not refer to the subjective feelings of drowsiness at the present time.
The ESS thus provides a propensity to sleep, but neither a state or LoD, nor a sleep latency.
Contrary to what is done for other subjective scales (such as the Karolinska Sleepiness Scale), the ESS is not repeated several times since the answers of the individual tested should in principle remain the same over some extended period of time and should be independent of the present state of drowsiness of the individual.
The ESS test consists in asking the individual to evaluate the chance that he would doze in 8 different situations such as sitting and reading, watching TV, etc. The chance is entered as a number according to;
• 0: no chance of dozing; • 1: slight chance of dozing; • 2: moderate chance of dozing; • 3: high chance of dozing.
The drowsiness score of the individual is obtained by adding all numbers entered. The interpretation of the score is as follows:
• 0-5: lower normal daytime sleepiness; • 6-10: higher normal daytime sleepiness; • 11-12: mild excessive daytime sleepiness; • 13-15: moderate excessive daytime sleepiness; • 16-24: severe excessive daytime sleepiness.
The ESS is highly reliable, easily conducted, and widely used [36]. However, it has the disadvantage of proposing situations that may not be common to everybody, and this could therefore distort the result.
Objective methods
The objective methods described below yield a sleep propensity via the use of clinical tests. These clinical tests use physiological parameters to determine sleep propensity.
Multiple Sleep Latency Test (MSLT)
The Multiple Sleep Latency Test (MSLT) is a diagnostic tool to identify sleep propensity which is used to diagnose sleep disorders. For example, it is used to diagnose narcolepsy and breathing disorders (as well as the effectiveness of their treatments) [37].
The MSLT was proposed in 1977 by Dement and Carskadon [38].
The MSLT’s main goal is to provide an objective measure of drowsiness. The measure provided is that of sleep latency. Sleep latency is defined below in the description of the MSLT test.
The MSLT is generally performed during the daytime, immediately following an overnight sleep with a control polysomnogram to ensure that the individual had adequate sleep during the night and to make sure that there was no sleep disruption that would be the cause of artifacts in the MSLT test.
The test consists of four to five sessions. For each session, the individual is placed in a lying-down position in a quiet, comfortable room. At the beginning of each session, the individual is asked to close his eyes and the experimenter turns the lights off. These conditions are designed to be conducive to sleep. The individual is asked to let himself fall asleep, i.e. without trying to fight sleepiness. In any case, he is awaken after 20 minutes. The test is repeated every two hours (for a total of four or five sessions). For each session, the time between “lights out” (with eye closed) and the moment when the individual falls asleep unequivocally is recorded. This moment presumably corresponds to the end of sleep stage N1, that will be discussed later, and this duration is called the sleep latency. The four or five values obtained for the sleep latency can be used individ-ually, but their average is usually considered to obtain a single value of sleep latency for the individual.
The moment when the individual falls asleep is determined primarily from polysomno-graphic (PSG) recordings, including electroencephalogram (EEG), electrooculogram (EOG), and electromyogram (EMG) [39, 40].
The test is based on the idea that the drowsier an individual is, the faster he will fall asleep. Therefore, people with EDS are expected to fall asleep quite quickly in each session of this test [41]. However, there is a wide range of normal MSLT sleep laten-cies, so that a short one is not necessarily an indication of a sleep disorder.
[42]:
• severe drowsiness: corresponding to a sleep latency lower than 5 min,
• moderate drowsiness: corresponding to a sleep latency between 5 min and 10 min,
• normal drowsiness: corresponding to a sleep latency higher than 10 min (normal).
The MSLT is used in many research protocols.
As indicated above, the MSLT was conceived to be a diagnostic tool and to provide an objective measure of drowsiness in fixed, laboratory conditions. Because of this, the measure that it provides (sleep latency) can be used for the initial diagnosis of a sleep disorder, and to monitor the evolution of a possible pathology and of the effect of a cor-responding treatment.
The MSLT provides a measure of sleep latency in the standard conditions of the test, and thus only provides a rough indication of how fast an individual might fall asleep in other conditions.
For example, the laboratory conditions in which the test is conducted (including lying down, with eyes closed, and in darkness) are not representative of, say, driving condi-tions. It is thus unreasonable to try to draw, from an MSLT, precise conclusions about when the individual might fall asleep while driving. However, it is clear that the di-agnosis provided by the MSLT is useful in identifying individuals suffering from sleep disorders and being thus at risk of falling asleep at the wheel.
Because each MSLT takes a significant amount of time, and because it requires a spe-cialized infrastructure, this test is rather heavy to use, which means that it only makes sense to use it in clinical settings to address potentially significant health issues.
The MSLT is also used to determine whether an individual with short sleep latency suf-fers from narcolepsy. The rational is the following. This rational uses the concept of REM sleep (i.e. rapid eye movement sleep) stage which is a particular deep sleep stage that will be discussed later. In a normal individual, REM sleep stage first occurs about 60 to 90 minutes after sleep onset, and then periodically after that. After a good night sleep, a normal individual would never enter REM within 5 minutes of falling asleep. Therefore, to determine whether a patient might suffer from narcolepsy, the sleep tech-nician just needs to determine whether the patient enters into REM sleep stage within five minutes after falling asleep in a given session. The time between sleep onset and REM sleep is called “latency to REM”. Although even a single early REM occurrence is abnormal, the standard protocol requires latency to REM of less than five minutes at least twice over the set of the four or five sessions for the patient to be declared to suffer from narcolepsy [40, 43].
The MSLT is often considered to be some kind of a gold standard.
Maintenance of Wakefulness Test (MWT)
The Maintenance of Wakefulness Test (MWT) is also a diagnostic tool to identify sleep propensity but, contrary to the MSLT, the MWT measures the ability to stay awake and not to fall alseep [44]. This test is thus typically used for the analysis of sleepiness dur-ing wakdur-ing hours.
The MWT is used to diagnose EDS and difficulties in staying awake.
The MWT’s main goal is to provide an objective measure of drowsiness. The measure provided is that of a sleep latency [37].
The MWT is generally performed 1.5 to 3 hours after the individual wakes up, so he is presumably well-rested.
The test consists of four sessions. For each session, the individual typically sits upright on a bed with his back and head supported. The room is dimly lit, with the source of light just behind the individual’s head and out of his field of vision. The individual is asked to stay awake as long as possible. The session ends when the individual falls asleep or after 40 minutes if he does not. The test is repeated every two hours (for a total of four sessions). The duration between the start of the session and the moment the individual falls asleep is recorded: this duration is called the sleep latency. The four values obtained for the sleep latency can be used individually, but their average is usu-ally considered to obtain a single value of (MWT) sleep latency for the individual [40].
Identically to the MSLT, the moment where the individual falls asleep is determined primarily from PSG recordings, including EEG, EOG, and EMG.
The test is based on the idea that the drowsier an individual is, the faster he will fall asleep, even if he tries to fight sleepiness.
Healthy people fall asleep after about 30 minutes and some may stay awake through the test. Therefore, MWT latencies of less than 8 minutes are considered abnormal. They may be indicative of EDS [33].
While MSLT and MWT both measure sleep latencies, either is not a substitute for the other. Both tests will typically give different latencies for a given individual.
The MWT is often used for legal considerations, e.g. for reinstating a driver’s license.
Oxford Sleep Resistance Test (OSLER)
The Oxford Sleep Resistance Test (OSLER) is a simplified version of the maintenance of wakefulness test (MWT) but it uses behavioral/performance-based parameters rather than EEG-based parameters to assess the sleep latency [45]. The test is performed on an individual in an environment conducive to sleep (dark room isolated from noise). The individual is asked to lie down and to try to stay awake. He must respond to a light stimulus produced by an LED placed at eye level 2 meters away from his head. The test lasts 40 minutes (or, sometimes, only 20) and the LED flashes for 1 second every 3 seconds. The individual is asked to react to the light stimulus by touching a button. The test ends after 40 minutes (or 20) or after 7 unanswered light stimuli (equivalent to 21 seconds of inattention). The analysis of the sequence of reactions to the stimuli allows one to estimate the sleep latency [46].
The OSLER shows good correlation with the MWT based on EEG for the estimation of the sleep latency [45].
The advantages of the OSLER are its simplicity and its low cost. The disadvantage is that, most of the time, the individual performs the test without error. To overcome this limitation, an extended measure of the OSLER has been defined to take into account the changes in the error sequence [46].
The OSLER is also used as a secondary reference in the analysis of drowsiness.
Some authors have also proposed a software-based alternative for the OSLER, the Be-havioral Sleep Resistance Task (BSRT) [47].
2.3.2
Methods for operational and real-time characterization of
drowsi-ness
The main traditional methods for characterizing the LoD in real-time can also be divided in two categories on the basis of their objective or subjective character. Objective meth-ods are based on the direct measurement of physiological parameters of the individual or on the performance of the individual in the accomplishment of a task. Subjective methods are mainly based on questionnaires, interviews, or self reports from the indi-vidual, and they do not use physiological parameters.
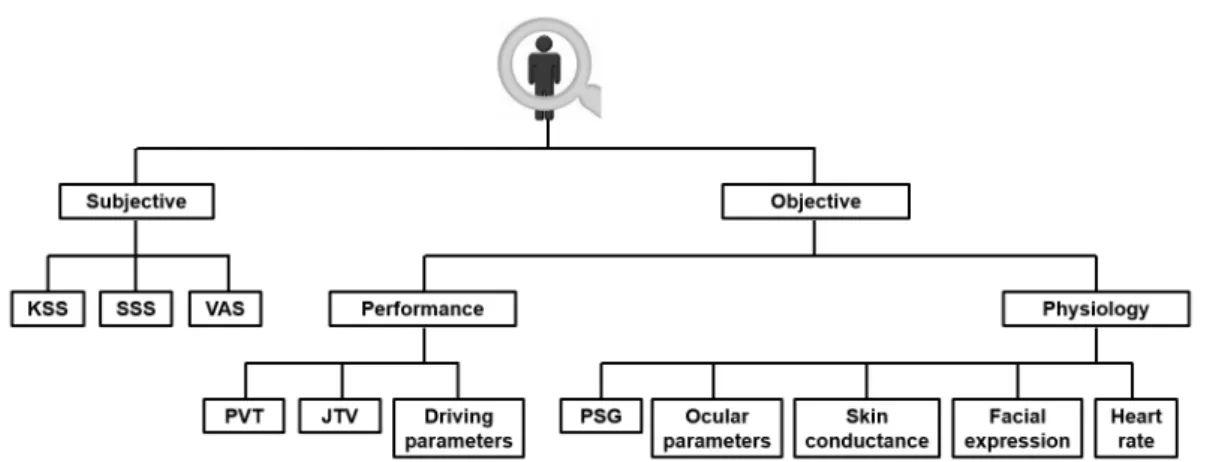
Figure 2.3 shows the block diagram of the different methods related to the opera-tional and real-time characterization of drowsiness (sometimes represented by their acronyms). All methods are detailed hereafter.
Figure 2.3:Block diagram of the methods related to the operational and real-time char-acterization of drowsiness.
Subjective methods
The subjective methods described below yield a state of drowsiness or an LoD, and not a sleep propensity. This is thus in contrast with the ESS. The answers to the different scales/questionnaires must be provided by the individual tested.
Karolinska Sleepiness Scale (KSS)
The Karolinska Sleepiness Scale (KSS) test asks the individual to choose, among the nine states proposed, the one corresponding the most closely to his perceived state of drowsiness over the last few minutes [48].
The KSS is a Likert-type scale with the fifth, middle state “Neither alert nor sleepy” being effectively neutral. Despite its characteristic, the scale is not fully symmetrical in its wording.
Since the answer to the test can be provided quickly, the test can be taken repeatedly and provides only a minor distraction to the individual. Moreover, it is very easy to administer.
The KSS is used as the means of quantifying the state of sleepiness in many experiments and it is the most prevalent scale in the drowsiness-related literature.
Karolinska Sleepiness Scale Rate State 1 Extremely alert 2 Very alert 3 Alert 4 Rather alert
5 Neither alert nor sleepy 6 Some signs of sleepiness 7 Sleepy, but no effort to remain awake 8 Sleepy, some effort to stay awake
9 Very sleepy, great effort to stay awake, fighting sleep
The KSS was validated against EEG features extracted from individuals performing a driving test in a simulator with sleep deprivation [49]. Another study also showed good correlation between high KSS scores and the risk of accidents [50]. However, the KSS showed low reliability for the diagnosis of sleep disorders [51].
Stanford Sleepiness Scale (SSS)
The Stanford Sleepiness Scale (SSS) [52] is similar in spirit to the KSS. One difference is that the SSS uses seven states rather than nine.
It is not clear whether the SSS is truly a Likert-type scale. Indeed, it is not obvious that its fourth, middle state is neutral. The wording of the other states certainly does not exhibit any symmetry.
Murray W. Johns indicates in [37] that the SSS has the disadvantage of using some words that are either not universally known (such as “woozy”) or that are quite vague (such as “vital” and “foggy”). We agree that it is difficult to grasp quickly the exact meaning of each of the SSS “degrees”.
Similarly to the KSS, since the answer to the test can be provided quickly, the SSS can be taken repeatedly and provides only a minor distraction to the individual. However, it is difficult for an individual to keep a precise picture of the scale in his head. The SSS was validated and showed high reliability but, as for KSS, not for the diagnosis of sleep disorders, notably the obstructive sleep apnea syndrome [53].
Stanford Sleepiness Scale
Rate State
1 Feeling active, vital, alert, or wide awake
2 Functioning at high levels, but not at a peak; able to concentrate 3 Awake, but relaxed; responsive but not fully alert
4 Somewhat foggy, let down
5 Foggy; loosing interest in remaining awake; slowed down 6 Sleepy, woozy, fighting sleep; prefer to lie down
7 No longer fighting sleep, sleep onset soon; have dream-like thoughts
Visual Analog Scale (VAS)
A Visual Analog Scale (VAS) is a universal scale that can be used easily and anywhere as it is a simple, linear, visual scale [54]. The VAS is a horizontal line segment of 10 cm in length. The two extremities of the segment correspond to two extreme opposites. For example, the extreme could be “very satisfied” and “very dissatisfied”. In the context of alertness and drowsiness, the extremes could be “very alert” and “very drowsy”.
The individual must make a mark at a point that he feels corresponds to his level of alertness/drowsiness in the last few minutes. The position of the mark can then be con-verted into a score, for example on a scale from 0 to 10, possibly rounded to an integer. Instead of making a mark, one could imagine that the individual simply picks a number (or an integer) from 0 to 10. This value could be provided in writing, orally, etc.
The major advantage of the approach is that one does not need to think about, and in-terpret, the description, sometimes complicated, of the “states” (as in the SSS). To the extent that the “states” of the KSS and SSS are linear in the sleepiness, a VAS is, for all practical purposes, virtually equivalent to the KSS and the SSS [33, 37].
Again, since the answer to the VAS test can be provided quickly and easily, the test can be taken repeatedly and provides only a minor distraction to the individual. The VAS has the significant advantage of being instantaneously obvious. However, a disadvantage of the VAS is that the terminology used by different experts for the extremities of the scale may vary, thus limiting the reproducibility of results from one study to another.
Objective methods
Among the objective methods, we first consider the ones that are independent of the task performed by the individual, i.e. the physiology-based methods (polysomnogra-phy, ocular parameters, etc.), and then the ones that are dependent of the task, i.e. the performance-based methods (Psychomotor Vigilance Test, driving performance, etc.).
Physiology-based methods
Polysomnography (PSG)
Polysomnography (PSG) may prove to be another method for characterizing drowsi-ness. PSG is indeed a recording of different physiological signals that enable one to detect changes during wake and sleep. These changes are refered here as activity. We in-deed use the term activity to refer to changes in certain frequency bands over time. PSG monitors, via the use of electrodes, several body activities such as the brain (electroen-cephalogram (EEG)), the eye (electrooculogram (EOG)), the muscles (electromyogram (EMG)), and the cardiac activity (electrocardiogram (ECG)).
PSG is the reference for the study of sleep. Therefore, we first present the characteri-zation of sleep using PSG and, second, we present the charactericharacteri-zation of drowsiness using PSG.
Characterization of sleep using PSG
Before the era of modern sleep research, in the 1920s, scientists regarded sleep as an inactive brain state. In 1924, Hans Berger recorded the first human EEG. From EEG recordings, scientists then discovered that during sleep, the brain stays active with a dynamic behavior. Each EEG recording indeed measures electric potentials, i.e. volt-ages, between two electrodes, which is the result of the electrical currents generated by synaptic activity (neurons) in the brain. The EEG activity is characterized by its shape, amplitude, and frequency. There are four frequency bands of interest for the study of sleep:
• Delta (δ): 0.5-3 Hz • Theta (θ): 4-7 Hz • Alpha (α): 8-12 Hz • Beta (β): 13-25 Hz.
Over time, research revealed two main types of sleep. These were defined by some particular electrical patterns in the brain of a sleeping individual and by the presence or absence of eye movements. The two main types of sleep are the Rapid-Eye-Movement sleep (REM sleep) and the Non-Rapid-Eye-Movement sleep (NREM sleep). In 1968, Rechtschaffen and Kales described the structure of sleep using several stages [55]. This has been the reference in sleep labs until the arrival, in 2007, of the new scoring manual published by the American Association of Sleep Medicine (AASM) [56].
The AASM nomenclature gives three categories of sleep stages:
• Non-Rapid Eye Movement (NREM) sleep stage; • Rapid Eye Movement (REM) sleep stage.
The wake stage represents almost two thirds of an individual’s life time. This stage can be further partitioned into two (sub)stages:
• Active wake, eyes open;
• Passive wake (or calm), eyes closed.
During the active wake, the electroencephalogram (EEG) activity is fast and of low voltage. It is usually characterized by beta frequencies (13-25 Hz) or even gamma fre-quencies (25-100 Hz) depending on whether the individual is very active or not. There is also presence of body movements and eye movements that often create artifacts. The passive wake can be associated with a state of rest, relaxation, eyes closed. Under these conditions, the EEG activity is characterized by the presence of alpha frequencies (8-12 Hz) which are higher in the occipital regions. Normally, there is no body move-ment but muscle tone is still present, especially at the chin, where the tone is of great amplitude on the EMG.
The NREM sleep represents, on average, each night, 80% of total sleep. It is divided into three stages of increasing depth of sleep denoted by N1, N2, and N3. In the pro-gression from N1 to N3, brain waves become slower, higher in amplitude, and more synchronized, and the eyes remain still. We now give descriptions of these three stages.
• N1 stage (NREM 1):
The N1 stage includes an EEG activity slightly slower than in the wake stage. The EEG activity consists of mixed frequencies, usually in the alpha and theta frequency bands with a strong increase of activity in the theta band. The EOG usually shows slow eye movements, as opposed to the blinking of the wake stage. In the EEG, specific patterns also appear under certain channels and the EMG on the chin decreases because the individual feels more relaxed. The N1 stage is usually associated with the state of drowsiness.
• N2 stage (NREM 2):
The N2 stage is also characterized by a mixed frequency EEG activity. Special patterns appear under the central EEG channels. These are the “spindles” (which are sinusoidal waveforms with frequency between 12 and 16 Hz) and the “K com-plexes”, not associated with awakenings (which are biphasic waveforms with a large negative wave followed immediately by a positive wave). There is no longer any EOG activity and the EMG is still existent but reduced.
• N3 stage (NREM 3):