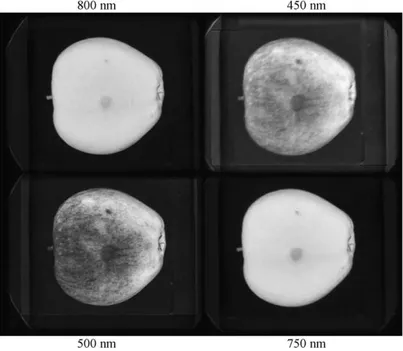
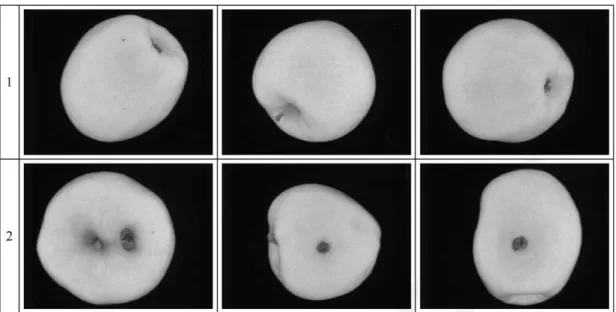
Development of a multi-spectral vision system for the detection of defects on apples
Texte intégral
Figure


Documents relatifs
La DLSM s’appuie sur les r´ esultats de la Generalized Linear Sampling Method (GLSM) dont la mise en œuvre n´ ecessite que le probl` eme de transmission int´ erieur (PTI) soit
itively, the scale of a defect is the smallest scale at which one sees, after blowup, non constant functions.) This suggests that boundary defects are significantly larger than
EFFECT OF DEFECT ANGULAR-POSITION ON THE WAVE REFLECTION AND TRANSMISSION COEFFICIENTS: NUMERICAL INVESTIGATION BY THE WAVE FINITE ELEMENT
From transmission electron microscopy and heat capacity measurements radiation induced da- mage in A-15 compounds was found to be inhomogeneous, consisting of samll disordered
L’archive ouverte pluridisciplinaire HAL, est destinée au dépôt et à la diffusion de documents scientifiques de niveau recherche, publiés ou non, émanant des
In a few cases where the wave- number of an O 2 rotational line differs only by a fraction of a cm -1 from the wavenumber of a silicon line at which the measurement takes
- Although hydrogen is the simplest atom, it is not the simplest adsorbate because, for some metals, it seems that the Hartree-Fock ground state of the Haqiltonian
We have studied magnetc-optical (Faraday) rotation II, 2] in the vicinity of the magnetic dipole (Ml) transitions 876 nm and 648 nm in atomic bismuth; the work gives a determination
