Preliminary analysis of Martian dayglow observed by the Imaging Ultraviolet Spectrograph onboard MAVEN. S.K. Jain1, A.I. Stewart1, N.M. Schneider1, J. Deighan1, A. Stiepen1, J.S. Evans2, M.H. Stevens3, M. Chaf-fin1, W.E. McClintock1, J.T. Clarke4, G.M. Holsclaw1, B.M. Jakosky1
1Laboratory for Atmospheric and Space Physics, University of Colorado at Boulder, 3665 Discovery Drive, Boul-der, CO 80303, 2Computational Physics, Inc., 8001 Braddock Road, Suite 210, Springfield, VA 22151, 3Space Sci-ence Division, Naval Research Laboratory, 4555 Overlook Ave., SW, Washington, DC 20375, 4Astronomy Depart-ment, Boston University, Boston, MA 02215
Introduction: The Imaging Ultraviolet Spectro-graph (IUVS) is one of the remote sensing instruments on the Mars Atmosphere and Volatile EvolutioN (MAVEN) spacecraft. It measures Far and middle ul-traviolet emissions emanating from the Martian upper atmosphere. These emissions constitute an important diagnostic tool to study atmospheric regions, which are otherwise difficult to study. With its unique observa-tion configuraobserva-tion, IUVS can measure Martian day-glow at different lighting conditions with a wide spa-tial and temporal coverage [1]. This study shows the preliminary analysis of Martian dayglow observed by the IUVS.
Observations: The MAVEN satellite is in an ellip-tical orbit with apoapsis near 6,000 km altitude and periapsis near 160 km. IUVS instrument carries two detectors: FUV detector (115-190 nm) with a spectral resolution of ~0.6 nm and MUV detector (180-340 nm) with a spectral resolution of ~1.2 nm [1]. In its limb-observing mode, IUVS measures the Martian UV air-glow layer in the altitude region of 80 to 220 km with vertical resolutions of ~5 km. The data set chosen for this study span between Oct. 18, 2014 and Oct. 22, 2014 (orbits 109-128).
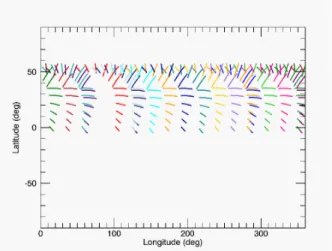
Figure 1: The tangent point of the IUVS line of sight from
19 orbits (orbits 109 to 128) plotted versus latitude and east longitude. Each color represents a single orbit.
These observations were made in the northern hemi-sphere. Figure 1 presents the latitude and longitude coverage of the tangent point of the IUVS line of sight, which clearly shows the wide spatial coverage of IUVS within two weeks of observations.
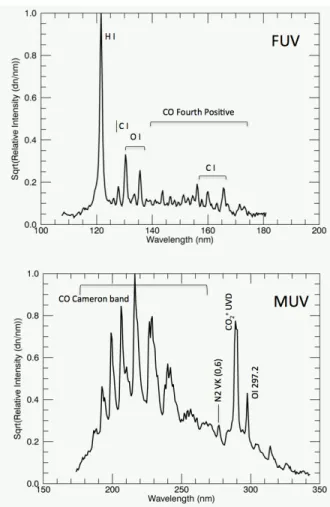
Figure 2 shows the detector images of MUV and FUV detectors taken during the very first observations of the Martian airglow layer. The horizontal axis repre-sents wavelength and vertical axis depicts the altitude from 80 to 250 km. Figure 3 shows averaged spectra in the FUV and MUV observed at altitudes between 120 and 130 km during orbit 109. Martian dayglow spectra as seen by the IUVS show similar features as observed by Mariner [2-3] more than 40 years ago and recently by SPICAM onboard Mars Express [4]. Several atomic and molecular features are seen the detector images, e.g., H Lyman alpha, oxygen emissions at 130.4 and 135.6 nm, carbon emissions at 156.1 and 165.7 nm, and CO Fourth Positive bands in the FUV, and CO Cameron, CO2+ UV doublet bands in MUV, and the OI 297.2 nm line in the MUV.
Figure 2: The IUVS detector images for single swath of
orbit 113.
We have been able to identified N2 VK band emission in the IUVS spectra [5]. Detection of these features are important and it will help us constrain the N2 density in the atmosphere of Mars, since N2 VK bands are mainly produced by electron impact on N2 [6-7].
Analysis and Results: Figure 4 presents the rela-tive brightness of CO Cameron band (180-260 nm) for single swath of orbit 109. The shape of the profile and
2761.pdf 46th Lunar and Planetary Science Conference (2015)
altitude of maximum emission are consistent with the earlier measurements by Mariner and SPICAM [2-4]. Altitude profiles observed by IUVS will be used to retrieve the density of various atmospheric constituents of Mars, and the temperature of the upper thermo-sphere.
Figure 3: FUV (top panel) and MUV (bottom panel)
spec-trum obtained by IUVS between SZA = 70 and 35 deg. Av-erage of 15 individual spectra obtained between 120 and 130 km.
Figure 5 shows the variation of peak intensity of CO Cameron band with solar zenith angle. The relative peak intensity at SZA = 30° is about 0.8 and it de-creases to value of 0.3 at SZA = 70°. The variation with SZA closely follows cos(SZA).
Chapman layer theory also predicts a variation of peak altitude with SZA as H × ln (sec(SZA), where H is scale height of the atmosphere, but we have not seen any significant variation of altitude of peak emissions with SZA in our preliminary analysis. We have also not seen any variation in the altitude of maximum emission with the longitude.
Future Work: A detailed analysis of Martian day-glow and its variation with various physical
parame-ters. Future work includes density retrieval of major atmospheric constituent of Mars. Scale heights and temperature of neutral upper atmosphere will be re-trieved to understand the dynamics of Martian Ther-mosphere-Ionosphere region.
Figure 4. The altitude profile of CO Cameron band obtained
from a single swath of orbit 109.
Figure 5: Relative peak intensity of CO Cameron plotted
versus solar zenith angle (SZA).
References: [1] McClintock, W. E. et al. (2014), Space Sci. Rev., doi: 10.1007/s11214-014-0098-7. [2]. Barth et al. (1971), J. Geophys. Res. 76, 2213-2227. [3] Stewart et al. (1972), Icarus, 17, 469-474. [4]. Leblanc, F. et al. (2006), JGR, 111, E09S11, doi:10.1029/2005JE002664. [5] Stevens, M. H. et al. (2015), LPS XLVI. [6] Jain, S.K. and A.Bhardwaj (2011), JGR, 116, E07005,doi:10.1029/2010JE003778. [7] Fox, J.L. and N.E.F. Hac (2013), Geophys. Res. Lett., 40, 2529-2533, doi:10.1002/grl50435. [8] Hantsch, M. H. and Bauer, (1990), Planet. Space Sci., 10038, 539-542.
2761.pdf 46th Lunar and Planetary Science Conference (2015)