Documentation on the Terrestrial Observatory of Lonzée (OTL)
1. Owners/Authors
Principal Investigator (PI): Bernard Heinesch
Manager of eddy covariance fluxes and continuous meteorological measurements: Anne De Ligne Manager of biomass measurements: Tanguy Manise
This report was written by Anne De Ligne and Tanguy Manise.
2. Site description
The Lonzée site is a cropland (the land has been cultivated for more than 75 years) with a 4-year rotation : sugar beet (Beta vulgaris L.), winter wheat (Triticum aestivum L.), potato (Solanum tuberosum L.), winter wheat (Triticum aestivum L.) (Beginning in 2000).
Here is the schedule of crops since 2004 with sowing/planting and harvest dates : Years Crop Sowing/planting - harvest
2004 Sugar beet 30.03.04 / 29.09.04 2004-2005 Winter wheat 14.10.04 / 03.08.05 2006 Patato 01.05.06 / 15.09.06 2006-2007 Winter wheat 13.10.06 / 05.08.07 2008 Sugar beet 22.04.08 / 04.11.08 2008-2009 Winter wheat 13.11.08 / 07.08.09 2009 Mustard 01.09.09 / 01.12.09 2010 Patato 25.04.10 / 05.09.10 2010-2011 Winter wheat 14.10.10 / 16.08.11 2012 Maize 14.05.12 / 13.10.12 2012-2013 Winter wheat 25.10.12 / 12.08.13 2013 Mustard 05.09.13 / 15.11.13 2014 Patato 07.04.14 / 22.08.14 2014-2015 Winter wheat 15.10.14 / 02.08.15 2015 Mustard 26.08.15 / 09.12.15 2016 Sugar beet 12.04.16 / 27.10.16 2016-2017 Winter wheat 29.10.16 / 30.07.17 2017 Mustard 07.09.17 / 08.12.17 2018 Patato 23.04.18 / 11.09.18 2019 Winter wheat 10.10.18 / ???
3. Site localisation
Site geographical coordinates are 50°33'5.8"N - 4°44'46.5"E
The plan view below shows the sub-plots of the site where samplings are conducted. There are two sub-plots (in blue on the plan) of 5 meters radius. The orange lines indicate where the tractor was moving in 2018.
Main wind : 225°
Mean peak footprint : 60 m
Location of sub-plot 1 : 234,4° - 32,89 m Location of sub-plot 2 : 184,8° - 30,61 m
4. Flux measurements
4.1 List of sensors variables
Variables Code List :TABLE 1: Base names for data variable labels
1Variable Units Description
TIMEKEEPING
TIMESTAMP YYYYMMDDHHMMSS ISO timestamp - short format
GASES
CO2 umolCO2 mol-1 Carbon Dioxide (CO2) mole fraction H2O mmolH2O mol-1 Water (H2O) vapor mole fraction
CH4 nmolCH4 mol-1 Methane (CH4) mole fraction NO nmolNO mol-1 Nitric oxide (NO) mole fraction NO2 nmolNO2 mol-1 Nitrogen dioxide (NO2) mole fraction N2O nmolN2O mol-1 Nitrous Oxide (N2O) mole fraction O3 nmolO3 mol-1 Ozone (O3) mole fraction
FC umolCO2 m-2 s-1 Carbon Dioxide (CO2) flux FCH4 nmolCH4 m-2 s-1 Methane (CH4) flux FNO nmolFNO m-2 s-1 Nitric oxide (NO) flux FNO2 nmolFNO2 m-2 s-1 Nitrogen dioxide (NO2) flux FN2O nmolN2O m-2 s-1 Nitrous oxide (N2O) flux FO3 nmolFO3 m-2 s-1 Ozone (O3) flux SC umolCO2 m-2 s-1 CO2 storage flux
SCH4 nmolCH4 mol-1 Methane (CH4) storage flux SNO nmolNO mol-1 Nitric oxide (NO) storage flux SNO2 nmolNO2 mol-1 Nitrogen dioxide (NO2) storage flux SN2O nmolN2O mol-1 Nitrous oxide (N2O) storage flux SO3 nmolO3 mol-1 Ozone (O3) storage flux
FOOTPRINT
FETCH_MAX m Distance at which footprint contribution is maximum FETCH_90 m Distance at which footprint cumulative probability is 90% FETCH_80 m Distance at which footprint cumulative probability is 80% FETCH_70 m Distance at which footprint cumulative probability is 70% FETCH_FILTER adimensional
Footprint quality flag: 0 identifies data measured when wind coming from direction that should be discarded
FC_SSITC_TEST adimensional Quality check - Mauder and Foken 2004 FCH4_SSITC_TEST adimensional Quality check - Mauder and Foken 2004 FNO_SSITC_TEST adimensional Quality check - Mauder and Foken 2004 FNO2_SSITC_TEST adimensional Quality check - Mauder and Foken 2004 FN2O_SSITC_TEST adimensional Quality check - Mauder and Foken 2004 FO3_SSITC_TEST adimensional Quality check - Mauder and Foken 2004
HEAT
G W m-2 Soil heat flux
H W m-2 Sensible heat flux
LE W m-2 Latent heat flux
SG W m-2
Heat storage in the soil above the soil heat fluxes measurement
SH W m-2 Heat storage in the air
SLE W m-2 Latent heat storage flux
SB W m-2 Heat storage in biomass
H_SSITC_TEST adimensional Quality check - Mauder and Foken 2004 LE_SSITC_TEST adimensional Quality check - Mauder and Foken 2004
WD Decimal degrees Wind direction
WS m s-1 Wind speed
WS_MAX m s-1 maximum WS in the averaging period
USTAR m s-1 Friction velocity
ZL adimensional Stability parameter
TAU Kg m-2 s-1 Momentum flux
MO_LENGTH m Monin-Obukhov length
U_SIGMA m s-1
Standard deviation of velocity fluctuations (towards main-wind direction after coordinates rotation)
V_SIGMA m s-1
Standard deviation of lateral velocity fluctuations (cross main-wind direction after coordinates rotation)
W_SIGMA m s-1 Standard deviation of vertical velocity fluctuations TAU_SSITC_TEST adimensional Quality check - Mauder and Foken 2004
MET_ATM
PA kPa Atmospheric pressure
RH % Relative humidity, range 0-100
TA deg C Air temperature
VPD hPa Vapor Pressure Deficit
T_SONIC deg C Sonic temperature
T_SONIC_SIGMA deg C Standard deviation of sonic temperature PBLH m Planetary boundary layer height
MET_SOIL
SWC % Soil water content (volumetric), range 0-100
TS deg C Soil temperature
WATER_TABLE_DEPTH cm Water table depth
MET_RAD
ALB % Albedo, range 0-100
APAR umol m-2 s-1 Absorbed PAR
FAPAR % Fraction of absorbed PAR, range 0-100 FIPAR % Fraction of intercepted PAR, range 0-100
NETRAD W m-2 Net radiation
PPFD_IN umolPhoton m-2 s-1 Photosynthetic photon flux density, incoming PPFD_OUT umolPhoton m-2 s-1 Photosynthetic photon flux density, outgoing
PPFD_BC_IN umolPhoton m-2 s-1 Photosynthetic photon flux density, below canopy incoming PPFD_BC_OUT umolPhoton m-2 s-1 Photosynthetic photon flux density, below canopy outgoing PPFD_DIF umolPhoton m-2 s-1 Photosynthetic photon flux density, diffuse incoming PPFD_DIR umolPhoton m-2 s-1 Photosynthetic photon flux density, direct incoming SW_IN W m-2 Shortwave radiation, incoming
SW_OUT W m-2 Shortwave radiation, outgoing
SW_BC_IN W m-2 shortwave radiation, below canopy incoming SW_BC_OUT W m-2 shortwave radiation, below canopy outgoing SW_DIF W m-2 Shortwave radiation, diffuse incoming
SW_DIR W m-2 Shortwave radiation, direct incoming LW_IN W m-2 Longwave radiation, incoming LW_OUT W m-2 Longwave radiation, outgoing
LW_BC_IN W m-2 Longwave radiation, below canopy incoming LW_BC_OUT W m-2 Longwave radiation, below canopy outgoing SPEC_RED_IN umolPhoton m-2 s-1 Radiation (red band), incoming
SPEC_RED_OUT umolPhoton m-2 s-1 Radiation (red band), outgoing SPEC_RED_REFL adimensional Reflectance (red band)
SPEC_NIR_IN umolPhoton m-2 s-1 Radiation (near infra-red band), incoming SPEC_NIR_OUT umolPhoton m-2 s-1 Radiation (near infra-red band), outgoing SPEC_NIR_REFL adimensional Reflectance (near infra-red band)
SPEC_PRI_TGT_IN umolPhoton m-2 s-1 Radiation for PRI target band (e.g., 531 nm), incoming SPEC_PRI_TGT_OUT umolPhoton m-2 s-1 Radiation for PRI target band (e.g., 531 nm), outgoing SPEC_PRI_TGT_REFL adimensional Reflectance for PRI target band (e.g., 531 nm)
SPEC_PRI_REF_IN umolPhoton m-2 s-1 Radiation for PRI reference band (e.g., 570 nm), incoming SPEC_PRI_REF_OUT umolPhoton m-2 s-1 Radiation for PRI reference band (e.g., 570 nm), outgoing SPEC_PRI_REF_REFL adimensional Reflectance for PRI reference band (e.g., 570 nm) NDVI adimensional Normalized Difference Vegetation Index
PRI adimensional Photochemical Reflectance Index R_UVA W m-2 UVA radiation, incoming
R_UVB W m-2 UVB radiation, incoming
MET_PRECIP
P mm Precipitation
P_RAIN mm Rainfall
P_SNOW mm Snowfall
D_SNOW cm Snow depth
RUNOFF mm Run off
BIOLOGICAL
DBH cm
Diameter of tree measured at breast height (1.3m) with continuous dendrometers
LEAF_WET % Leaf wetness, range 0-100
SAP_DT deg C Difference of probes temperature for sapflow measurements SAP_FLOW mmolH2O m-2 s-1 Sap flow measurement
STEMFLOW mm Stemflow
THROUGHFALL mm Excess water from wet leaves reaching the ground
T_BOLE deg C Bole temperature
T_CANOPY deg C Temperature of the canopy
PRODUCTS
NEE umolCO2 m-2 s-1 Net Ecosystem Exchange RECO umolCO2 m-2 s-1 Ecosystem Respiration GPP umolCO2 m-2 s-1 Gross Primary Productivity
Source : http://www.europe-fluxdata.eu/home/guidelines/obtaining-data/variables-and-formats In addition of the variable name it is requested to use a 3 figures code which identifies univocally the location within the site where measurements are taken. The importance of this code is related to the possibility to associate to each variable a set of metadata like the method or instrument used, the measurement depth/height, the last calibration of the sensor etc.
Generally, the name of the variable has to be indicated as:
VAR_x
1_x
2_x
3 VAR= variable name (refer to the list of input variables)The first figure stands for the position of the sensors on a 2D space. For instance, if soil temperature is measured at 3 different locations, these can be numbered as 1, 2, 3.
TS_1_x_x
TS_2_x_x
TS_3_x_x
location 1 location 2 location 3
The second figure represents the vertical level (height above the ground/depth of the soil) of the sensors. Supposing to measure soil temperature at 3 different depths along a vertical profile at each location, then each variable can be identified as follows:
TS_1_1_x
TS_2_1_x
TS_3_1_x
depth 1TS_1_2_x
TS_2_2_x
TS_3_2_x
depth 2TS_1_3_x
TS_2_3_x
TS_3_3_x
depth 3location 1 location 2 location 3
Numeration increases moving downwards along a vertical profile but same number at two different locations can indicate different height/depth, that is specified in the metadata. So for example the deeper soil temperature measurement point in two different profiles of 4 sensors each will be
indicated as TS_1_4_1 and TS_2_4_1 even if the first is at 80cm and the second 120cm below ground. The third figure identifies the presence of replicated measurements in the same location. For
instance, given 2 replicates of soil temperature measurements at position 1 and depth 1 (i.e. for sensors comparison), these would be indicated as:
TS_1_1_1
TS_1_1_2
Another example where the third figure should be used is for measurements at tree level like sap flow sensors. In this case the first figure indicate the tree (again specified in the metadata), the second the measurement height if you have for example sap flow measurements on the same tree at different heights and the third can be used to identify different sensors at the same height, commonly used in sap flow measurements.
The timestamp of data is 30 minutes.
Since February 2017, meteorological data are acquired every 20 seconds except for soil and rainfall sensors which are recorded every 60 seconds. They are then averaged by 30 minutes.
Data found on the European Fluxes Database Cluster are in Local Time without daylight saving time (UTC+1).
The timestamp of variables found in internal files (MET, FLX, BRUT, UNCOR) are in the UTC time until April 2015. On the 1st May 2015, those internal files are in UTC+1.
L2 files are always in UTC+1.
4.3 Sensors
The sensors used are listed below for different periods.
2018 : installation for the labelling of the station in the ICOS network 2014 to 2017: installation of sensor with ICOS project.
2004 to 2013: first installation
The list is complete for 2014 and further. Additional and more precise information is available in the station logbooks available by contacting Anne De Ligne (Anne.DeLigne@ulg.ac.be).
Before 2014, an investigation has been conducted to gather a maximum of previous information in this document; it’s possible that some information is missing before 2014. If you have any question or comment, please contact us (Anne.DeLigne@ulg.ac.be).
Since 2018: Labelling of the station in the ICOS network
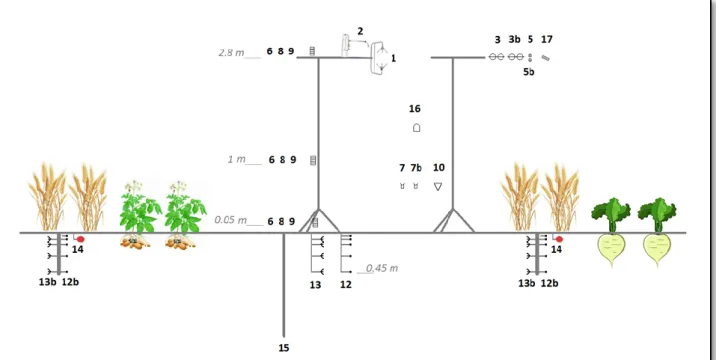
Figure 1 : Sensors on Lonzée station in 2018
Date of
installation Device Reference Variable Code
Heigh t (m) nbr. 1 1.01.2014 Sonic anemometer Solent Research HS-50, Gill Instruments Lymington, UK Wind velocity WS_1_1_1, WD_1_1_1 2 or 2.4 1 2 1.01.2014 Infrared gas analyzer LI-7200, LI-COR, Lincoln, NE, US Concentration of CO2 and of H2O CO2_1_1_1, H2O_1_1_1 1.96 or 2.06 1
3 28.08.2014 Pyrradiometer CNR 4, Kipp and
Zonen, Delft, NL Solar radiation
SW_IN_1_1_1, SW_OUT_1_1_1, LW_IN_1_1_1, LW_OUT_1_1_1, LW_T_BODY_1_1_1 2.9 1
3b 4.10.2005 Pyrradiometer CNR1, Kipp and Zonen, Delft, NL Solar radiation (Back up) SW_IN_1_1_2, SW_OUT_1_1_2, LW_IN_1_1_2, LW_OUT_1_1_2, LW_T_BODY_1_1_2 2.9 1 5 1.07.2014 Photo-receptor Cells PAR Quantum sensor SKP 215, Skye Instruments Limited, Llandrindod Wells, UK Photosynthetic Photon Flux Density PPFD_IN_1_1_1 2.9 1 5b 1.07.2014 Photo-receptor Cells PAR Quantum sensor SKP 215, Skye Instruments Limited, Llandrindod Wells, UK Reflected Photosynthetic Photon Flux Density PPFD_OUT_1_1_1 2.7 1 7 20.06.2014 Weighing Rain Gauge TRwS415, MPS system sro, Bratislava, SK Precipitation P_1_1_1 1.05 1
7b 19.04.2004 Tipping Bucket Rain Gauge 52202, R.M. Young Company, Traverse city, MI, US Precipitation (Back up) P_1_1_2 1.35 1 8 1.07.2014 Resistive platinium thermometer and electrical capacitive hygrometer HMP155, Vaisala Oyj, Helsinki, FI Air temperature, Air humidity TA_1_1_1, RH_1_1_1, TA_1_1_2, RH_1_1_2 2, 2.9 2 10 9.08.2013 Barometer PTB110/CS106, Campbell Scientific, Logan, UT, US Atmospheric pressure PA_1_1_1 0.9 1
12 05.2018 Platinum resistance thermometer Temperature Profile Probe MTPP, MicroStep spol. s r.o., Bratislava, SK Soil temperature TS_1_2_1 to TS_1_6_1, TS_2_2_1 to TS_2_6_1, TS_3_2_1 to TS_3_6_1, -0.05, -0.15, -0.25, -0.55, -0.85 3 12b 05.2018 Platinum resistance thermometer PT100D Digital Thermometer, MicroStep spol. s r.o., Bratislava, SK Soil temperature TS_1_1_1, TS_1_1_1, TS_3_1_1, TS_4_1_1 to TS_4_2_1, TS_5_1_1 to TS_5_2_1, -0.01, -0.05 7 13 15.04.2015 Silicon bandgap temperature sensor (transistor) and capacitance sensors (FDR) EnviroSCAN Probe, Sentek Sensor Technologies, Stepney, SA, AU Soil water content SWC_1_1_1 to SWC_1_5_1, SWC_2_1_1 to SWC_2_5_1, SWC_3_1_1 to SWC_3_5_1 -0.05, -0.15, -0.25, -0.55, -0.85 3 13b 05.2018 Time domain reflectometer ML3 ThetaProbe Soil Moisture Sensor, Delta-T Devices Ltd, Cambridge, UK Soil water content SWC_1_1_2, SWC_2_1_2, SWC_3_1_2, SWC_4_1_1, SWC_5_1_1 -0.05 5 14 1.09.2014 1.04.2015 2016 Self-Calibrating Soil Heat Flux Plate
HFP01SC, Hukseflux Thermal Sensors
B.V., Delft, NL
Soil Heat Flux G_1_1_1 to
G_5_1_1 -0.05 3 15 11.04.2018 Pressure Transducer CS451, Campbell Scientific, Logan, UT, US Water table depth WCP_1_1_1, WTD_1_1_1 -2.34 1 16 1.07.2014 Sonic Ranging Sensor SR50A-L, Campbell Scientific, Logan, UT, US
Snow depth D_SNOW_1_1_1 2.13 1
17 1.07.2014 Infra-red Remote Temperature Sensor IR 120, Campbell Scientific, Logan, UT, US Canopy temperature T_CANOPY_1_1_1 2.15 1
18 07.11.2006 NDVI sensor Labo ESE Unif Paris NDVI NDVI_1_1_1 2.15 1
19 6.08.2004 Photo-receptor Cells Sunshine sensor type BF3, Delta-T Devices Ltd, Cambridge, UK diffuse PPFD PPFD_DIF_1_1_1 2.5 1
2014 to 2017
Figure 3 : Sensors on Lonzée station in 2014
Date of
installation Device Reference Variable Code
Heigh t (m) nbr. 1 1.01.2014 Sonic anemometer Solent Research HS-50, Gill Instruments Lymington, UK Wind velocity WS_1_1_1, WD_1_1_1 2.8 1 2 1.01.2014 Infrared gas analyzer LI-7200, LI-COR, Lincoln, NE, US Concentration of CO2 and of H2O
CO2_1_1_1,
H2O_1_1_1 2.8 1
3 28.08.2014 Pyrradiometer CNR 4, Kipp and
Zonen, Delft, NL Solar radiation
SW_IN_1_1_1, SW_OUT_1_1_1, LW_IN_1_1_1, LW_OUT_1_1_1, NETRAD_1_1_1 2.8 1
3b 4.10.2005 Pyrradiometer CNR1, Kipp and Zonen, Delft, NL Solar radiation (bis) SW_IN_1_1_2, SW_OUT_1_1_2, LW_IN_1_1_2, LW_OUT_1_1_2, NETRAD_1_1_2 2.8 1 5 1.07.2014 Photo-receptor Cells PAR Quantum sensor SKP 215 Skye Instruments Limited, Llandrindod Wells, UK Photosynthetic Photon Flux Density PPFD_IN_1_1_1 2.88 1
5b 1.07.2014 Photo-receptor Cells PAR Quantum sensor SKP 215 Skye Instruments Limited, Llandrindod Wells, UK Reflected Photosynthetic Photon Flux Density PPFD_OUT_1_1_ 1 2.65 1 6 Waiting for protocol CO2 concentration CO2_1_1_2, CO2_1_2_1, CO2_1_3_1 2.8, 1, 0.3 3 7 20.06.2014 Weighing Rain Gauge TRwS415, MPS system sro, Bratislava, Slovakia Precipitation P_1_1_1 1.1 1
7b 19.04.2004 Tipping Bucket Rain Gauge 52202, R.M. Young Company, Traverse city, MI, US Precipitation (bis) P_1_1_2 1.4 1 8 1.07.2014 Thermistor and electrical capacitive hygrometer RHT2nl, Delta-T Devices Ltd, Cambridge, UK Air temperature, Air humidity TA_1_1_1 to TA_1_3_1, RH_1_1_1 to RH_1_3_1, TA_1_1_2, RH_1_1_2 2.8, 1, 0.3 4 10 9.08.2013 Barometer PTB110/CS106, Campbell Scientific, Logan, UT, US Atmospheric pressure PA_1_1_1 0.9 1 12 1.09.2014 1.04.2015 2016 Electrical resistance thermometer PT 107, Campbell Scientific, Logan, UT, US Soil temperature TS_1_1_1 to TS_1_5_1, TS_2_1_1, TS_3_1_1, TS_1_1_2 -0.01, -0.05, -0.15, -0.25, -0.45 8 13 1.09.2014 Time domain reflectometer CS616, Campbell Scientific, Logan, UT, US Soil moisture SWC_1_1_1 to SWC_1_4_1, -0.05, -0.15, -0.25 -0.45 4 12b - 13b 1.04.2015, 1.04.2015, 15.04.2015 Silicon bandgap temperature sensor (transistor) and capacitance sensors (FDR) EnviroSCAN Probe, Sentek Sensor Technologies, Stepney, SA, AU Soil temperature and moisture TS_1_2_2 to TS_1_5_2, TS_2_2_1 to TS_2_5_1, TS_3_2_1 to TS_3_5_1, SWC_1_1_2 to SWC_1_4_2, SWC_2_1_1 to SWC_2_4_1, SWC_3_1_1 to SWC_3_4_1, -0.05, -0.15, -0.25 -0.45 3
14
1.09.2014 1.04.2015
2016
Self-Calibrating Soil Heat Flux Plate
HFP01SC, Hukseflux Thermal Sensors
B.V., Delft, NL
Soil Heat Flux
G_1_1_1, G_2_1_1, G_3_1_1 -0.05 3 15 1.12.2014 Pressure Transducer ED752, Baumer, Frauenfeld, CH Water table depth WATER_TABLE_ DEPTH_1_1_1 -3 1 16 1.07.2014 Sonic Ranging Sensor SR50A-L, Campbell Scientific, Logan, UT, US
Snow depth D_SNOW_1_1_1 2 1
17 1.07.2014 Infra-red Remote Temperature Sensor IR 120, Campbell Scientific, Logan, UT, US Canopy temperature T_CANOPY_1_1_ 1 2 1
- 07.11.2006 NDVI sensor Labo ESE Unif Paris NDVI NDVI_1_1_1 1.7 1
- 6.08.2004 Photo-receptor Cells Sunshine sensor type BF3, Delta-T Devices Ltd, Cambridge, UK diffuse PPFD PPFD_DIF_1_1_1 2.7 1
2004 to 2013
Figure 4 : Sensors on Lonzée station in 2006
List of sensors, made in 2004:
Date of installatio n
Device Reference Variable Code Height
(m) nb r. 1 1.04.2004 Sonic anemometer Solent Research R3, Gill Instruments Lymington, UK Wind velocity WS_1_1_1, WD_1_1_1 2.7 1 2, 15 1.04.2004 Infrared gas analyzer LI-7000, LI-COR, Lincoln, NE, USA
Concentration of CO2 and of H2O
CO2_1_1_1,
H2O_1_1_1 2.7 1
3 1.04.2004 Pyranometer CM21, Kipp and Zonen, Delft, NL Global solar radiation SW_IN_1_1_1* 2.7 1 4 1.04.2004 Pyrradiomete r Q*7.1, REBS, Seattle, WA, USA
Net solar radiation NETRAD_1_1_1 2.7 1 5 1.04.2004 Photo-receptor Cells PAR Quantum sensor SKP 215 Skye Instruments Limited, UK Photosynthetic Photon Flux Density PPFD_IN_1_1_1 2.7 1 6 6.08.2004 Photo-receptor Cells Sunshine sensor type BF3, Delta-T Devices Ltd, Cambridge, UK diffuse PPFD PPFD_DIF_1_1_1 2.7 1 7 19.04.200 4 Collector + Tipping Bucket Unit of physics, FUSAGx, Gembloux (B) Precipitation P_1_1_1 1 1
8 - 9 1.04.2004 Thermistor and electrical capacitive hygrometer RHT2nl, Delta-T Devices Ltd, Cambridge, UK Air temperature
Air humidity TA_1_1_1, RH_1_1_1 1.3 1
10 1.04.2004 Barometer
MPX4115A, Motorola, Phoenix, AR, USA
Atmospheric pressure PA_1_1_1 1 1 11 1.04.2004 Thermometer with platinium resistance
PT 100, Jumo Soil temperature
TS_1_1_1, TS_1_2_1, TS_1_3_1, TS_1_4_1, TS_1_5_1 -0.03, -0.055, -0.09, -0.26, -0.56 5 12 1.04.2004 Time domain reflectometer ML2 ThetaProbe, Delta-T Devices Ltd, Cambridge, UK Soil moisture SWC_1_1_1, SWC_1_2_1, SWC_1_3_1 -0.05, -0.2, -0.4 3
13 1.04.2004 Soil Heat Flux Plate
HFP01, Hukseflux Thermal Sensors
B.V., Delft, NL
Soil Heat Flux G_1_1_1 -0.06 1
14, 17 30.08.200 4 Infrared gaz analyser Gascard II, Edinburgh Sensors Ltd, UK CO2 concentration CO2_1_2_1 - CO2_1_5_1 1.8, 1, 0.5, 0.2 1 * SW_IN_1_1_1 is the CM21 until CNR1 installation
Additional sensors
4.10.2005 Pyrradiomete r
CNR 1, Kipp and
Zonen, Delft, NL Solar radiation
SW_IN_1_1_1, SW_OUT_1_1_1, LW_IN_1_1_1, LW_OUT_1_1_1, NETRAD_1_1_1 2.7 1
7.11.2006 NDVI sensor labo ESE Unif Paris,
F NDVI NDVI_1_1_1 2 1 7.11.2006 PRI sensor SKR1800, Skye Instruments Limited, UK PRI PRI_1_1_1 * 2 1
* PRI_1_1_1 is not included in L2 files, see UNCOR files
4.4 Process
Soft
The soft used to process data has been from the beginning up to now : Eddysoft . (using : Block average, 2D coordinate rotation).
Canopy Height
The canopy height varies from year to year and depending on the species.
Since 2004, vegetation reaches maximum 0.62 meters height for sugar beet, 0.85 meters height for potato and 0.97 meters height for winter wheat.
High frequency correction
The procedure of high frequency correction is described in the available internal report, Method for high frequency correction for CO2 and water vapour fluxes, written by A. De Ligne.
5. Biomass measurements
Sub-plots for ICOS (Integrated Carbon Observation System) biomass measurements were installed in early 2014. Before this, above and belowground biomass, leaf area index and nutrient content of foliage and root (N, P, K and C) were measured each year since 2004.
The table below lists variables that are and will be measured from 2014.
Variables Unit Technique Spatial scale Temporal scale 2014 2015 2016 2017 2018 Above and belowground biomass G dry matter / m² Destructive sampling Sub-plots
6 times per growing
season x x x x x
Leaf area index m²/m² Destructive
sampling Sub-plots
6 times per growing
season x x x x x
Number of plants
per hectare N / ha - Sub-plots
Once at the beginning of
the growing season x x x x x Leaf area to mass
ratio
G dry matter / cm²
Destructive
sampling Sub-plots Once a year x x x x x C and N mass
fraction
G element / kg dry matter
Destructive
sampling Sub-plots Once a year x x - x x Canopy height m - Sub-plots 6 times per growing
season - x x x x Remaining biomass after harvest G dry matter / m² Destructive
sampling Sub-plots Once just after harvest x x x x x Soil carbon content Kg/m² Motor corer Whole field Once every 10 years - - - x -
Phenology Days of the beginning and the end of growing season
- Sub-plots Every year x x x x x
Information (Management and
disturbance)