HAL Id: hal-00341987
https://hal.archives-ouvertes.fr/hal-00341987
Submitted on 26 Nov 2008HAL is a multi-disciplinary open access
archive for the deposit and dissemination of sci-entific research documents, whether they are pub-lished or not. The documents may come from teaching and research institutions in France or abroad, or from public or private research centers.
L’archive ouverte pluridisciplinaire HAL, est destinée au dépôt et à la diffusion de documents scientifiques de niveau recherche, publiés ou non, émanant des établissements d’enseignement et de recherche français ou étrangers, des laboratoires publics ou privés.
Simulation for Product Driven Systems
André Thomas, Pierre Castagna, Rémi Pannequin, Thomas Klein, Hind El
Haouzi, Pascal Blanc, Olivier Cardin
To cite this version:
André Thomas, Pierre Castagna, Rémi Pannequin, Thomas Klein, Hind El Haouzi, et al.. Simulation for Product Driven Systems. Caroline Thierry, André Thomas, Gérard Bel. Simulation for Supply Chain Management, ISTE and John Wiley & Sons, pp.221-255, 2008, Control Systems, robotics and manufacturing series. �hal-00341987�
Chapitre 8: Simulation for
Product Driven Systems
CASTAGNA Pierre, THOMAS André
BLANC Pascal, CARDIN Olivier, EL HAOUZI Hind, KLEIN
Thomas, PANNEQUIN Rémi
8.1. Introduction
Due to globalisation, companies have to become more and more agile in order to face demand fluctuations and growing customisation needs. Indeed, the mass production market moves to a mass customization one, which could be defined as the production of a wide variety of end products at a low unit cost. This market typology evolution implies to ensure a quick answer to customers needs. The main problem for an efficient response seems to come from the global system inertia. During last years, many efforts have been done in order to improve operating system reactivity (with the Flexible Manufacturing initiative for example), but the manufacturing decision process did not really change, and then doesn’t enable to fully make the most of these new operating system skills.
On the other hand, several new technologies and software development appear, offering new skills potentially useful to increase flexibility and reactivity. Facing these new trends, a lot of new research works are focusing on identification technologies, like Auto-ID, biometry or vision ones. Radio Frequency Identification technology (RFID) represents a quick and safe way to track products, opening the way of linking informational and physical flows, and providing an accurate, real time vision of the shop floor. These new technologies appear like a catalyst to change the fifty years old way of controlling production through traditional MRP² systems.
There is a large consensus in the IMS community between holonic control, production management and virtual enterprises [1] that the combination of both agent and infotronics technologies (such RFID) may enable to meet flexibility and adaptability issues as required by the increasing customization of goods and services.
As addressed by Marik [5], there is still a long way to make these heterarchical architectures efficient in real industrial environment. Among many issues to be solved, embedded devices as well as agent technologies are not yet sufficiently reliable and powerful to handle the scalability problems for fully distributing decision-making.
Another issue is then to demonstrate the correct balance between centralized and distributed control capabilities of decision-making agents able to digitally interact ones with the others from the operators throughout the processes down to the products and vice-versa. That means to analyse hierarchical versus heterarchical control system architectures. Simulation seems the only recourse to analyze and compare alternative decision-making scenarios with regards to traditional ones.
8.2. Control Architectures of Manufacturing
Systems
8.2.1. Hierarchical Control architectures
The traditional enterprise organisation seems to be hierarchical. This structure enables high level components to take decisions with a global vision of the whole system. Most of the business functions of a company are structured according to a hierarchical manner. Our main interest sides in flow management, so the core function studied in this report is Planning function. The well used model to the planning function is based on the five steps Manufacturing Planning and Control System (MPCS) structure (Vollmann, 1988). The MPCS’s aim is to answer to what, when and how many to produce, according to sales forecasts, customers’ demand and production capacities. The decision frame at the highest level is macroscopic and long–term orientated, and become more and more detailed through successive steps to finally give the shop floor schedule.
Materials Requirements Plan Master Production Schedule Sales And Operations Planning
Production Activity Control Strategic Business Plan
Sales forecasts Resources req. plan Rough-cut cap. plan Capacity req. plan
Cell 1 Cell 2 Cell 3
M. 1 M. 2 M. 3 M. 4 M. 5 M. 6 M. 7
Materials Requirements Plan Master Production Schedule Sales And Operations Planning
Production Activity Control Strategic Business Plan
Sales forecasts Resources req. plan Rough-cut cap. plan Capacity req. plan
Cell 1 Cell 2 Cell 3
M. 1 M. 2 M. 3 M. 4 M. 5 M. 6 M. 7
Figure 1 : Manufacturing Planning and Control System
This hierarchical way ensures to reach optimal and co-ordinated plans, by enabling the decision makers to take relevant decision, function of synthetic and pertinent information (figure 1). This top down process ensures coherence between load and capacity (load/capacity balancing problem) at each decision level, by splitting the complex problem in several easier problems. On the other hand, when a special event occurs at the workshop level, the information has to go back to the upper level, to fix a new decision frame, and this information transmission process could take a lot of time, cutting down the system reactivity. To reduce this lack of flexibility, architectures have evolved to less rigidly linked nodes through heterarchical auto-organising structures.
8.2.2.
Heterarchical Control architectures
Heterarchical production control systems rely on the distribution of every decision capacities, without any centralised view of the shop floor status. One of the most studied heterarchical architecture is based on Multi Agents Systems (MAS), which radically change from the usual hierarchical architecture. Research in this domain began in the eighties, in particular with suggestions like YAMS – Yet Another Manufacturing Systems (Parunak, 1987) at the factory level. Multi Agent architecture relies on the overall system intelligence, emerging from interactions between agents. Enabling such interactions suppose agents being able to perceive their environment and to act on it. A heterarchical manufacturing system is usually composed of workstations and order agents, using an inter-agents negotiation protocol, like the Contract Net protocol (Smith, 1980), to plan the work load on different resources.
The main problem in multi-agents systems is that every decision is taken locally, by one or more agents, each one having a partial vision of the global system. Consequently, it is impossible to ensure that the solution elaborated is the optimal one. As (Valckenaers et al., 1998) pointed out, « the independence of agents
prohibits the use of global information » in heterarchical control architectures,
making « central scheduling or resource planning impossible ». Moreover,
problems like deadlocks could appear when systems size increase (a deadlock is a situation wherein two or more competing actions are waiting for the other to finish, so neither ever does).
8.2.3.
Product Driven architectures
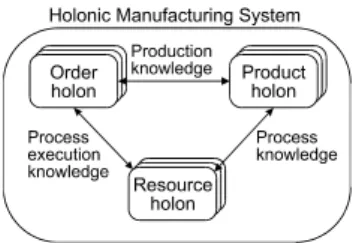
As exposed in sections 8.2.1 and 8.2.2, both hierarchical and heterarchical approaches share benefits and drawbacks. As a consequence, the idea of coupling both systems emerged, with the aim of ensuring a global optimum while keeping the heterarchical systems reactivity. One of the major issue in that way is Holonic Manufacturing Systems (HMS) (McFarlane et al, 2003) (Valckenaers et al, 2002) (Norrie et al, 2002)(Morel et al, 2003). The term holon is a combination of the Greek word holos, meaning whole, and the suffix –on, meaning particle. The holon concept was suggested by (Koestler, 1967) to describe a basic unit of an organisation in biological or social systems. Koestler observed that there aren’t any non-interacting entities in living organisms or social organisations. Every identifiable unit of organisation consists of more basic units while at the same time forming a part of a larger unit of organisation. HMS paradigm lies on the transposition of this concept in a production system, integrating hierarchy into distributed systems to combine reactivity to disturbances with high quality predictable performances. One of the existing holonic architecture is PROSA (Product Resource Order Staff Agents) (Valckeners et al, 1998), based on four agent types, three representing manufacturing entities (figure 2), that are Orders, Products and resources, and one Staff that co-ordinate the others.
Figure 2 : Basic building blocks of a HMS and their relations
The order, product, and resource holon are respectively in charge of logistical concerns, product and process technological aspects, and resource control optimisation, such as driving the machine at optimal speed and maximising its capacity. The fourth type of agents, the staff holon, advises the basic holons about some features of the production system, like scheduling priorities.
The emergence of Auto-ID technologies, like Radio Frequency Identification (RFID) during last decade, enables to consider real implementation of these architectures, by authorising products to hold a unique identifier, and sometime to compute treatments.
Auto-ID systems are usually constituted of two types of components : readers and transponders. Physical principle of RFID technology is out of the scope of this paper, so we could summarise it as a tag (also called transponder), held by a product and able to share data about him. Those data are at least an identifier, and could represent several kilobytes. On the other hand, there are some readers, thatreaders, which are in charge of establishing a contactless link between tag holders and the information system. As a new technology, many types of physical materials co-existsco-exist at this time : for example, several frequencies are used, some of them are usable all around the world when others are restricted in some areas.
At the current time, some ISO standards define air interfaces between reader and transponders, in particular ISO 18000 (ISO, 2004). But the standardisation of information system is still in progress. The EPC Global1 proposition seems to be the major one but is not yet admitted as a standard.
Potentially, unique item identification dramatically increases the supply chain visibility (Mac Farlane, 2002). Neglecting reading errors, RFID technology enables to thoroughly synchronise information system with the physical world, by always monitoring the position of each item, detecting changes in real-time. Considering this, unique item identification allow to ensure every decision making process is done with data really reflecting the real world, which avoid to sell to clients products that are not in stock, or to produce again something already produced. Most of works done in this domain deal with static analytical studies, which show that using RFID improves shelf availability (Kang et al, 2004) (Sahin, 2005). (Lee et al, 2004) note that static studies did not consider dynamics effects of information accuracy and availability. They shown, using simulation, that the increasing precision raised by RFID technologies enables to reduce to half the average finished good inventory, putting an end to out of stock. (Joshi, 2000) also used a simulation approach to evaluate information visibility all along the supply chain.
We could note that major issues dealing with RFID technologies sides on the impact of current information system accuracy improvement, but does not consider any option to radically change usual control architectures. Few works deal with the evaluation of different system architectures working with the same controlled system. (Brennan, 2004) proposed a performance comparison tool, based on simulation, but the represented system wasas adapted to fully meet requirements. For example, a RFID enabled postulate is that embedding intelligence into the product could lead to some types of product-driven systems. (Wong et al., 2002) (Morel et al, 2003). First, it will enable collaboration mechanisms by associating
any product entity with a computing agent. Moreover, the product role could be enhanced from a basic manufactured entity to the synchronisation tool between information and physical flows. Indeed, information about a product couldn’t be de-synchronised when it is held by the product itself. Moreover, the “intelligent product” could take some shop floor control decisions, according to shop floor events. These kinds of decisions could be, through this product, synchronized with those coming from the business functions (the centralised ERP).
Some research works see have shown that in the product could be the solution to Business to Manufacturing (B2M) Integration problems (Gouyon et al,2004), changing the usual pyramid vision of enterprise structure (figure 3).
Business Functions Manufacturing Functions Informational part Physical part Product flow Business Functions Manufacturing Functions Business Functions Manufacturing Functions
Supplier Enterprise Client
Figure 3 Product-Driven Enhanced Supply Chain.
The simulation tools can meet two different aims:
• To validate the holonic concept, and then to study its true adaptation to real system. The simulation will allow us to show its better performances than hierarchical ones. In the heterarchical manufacturing, the global behavior emerges starting from the local behaviors. Apart from simulation, we do not have any means of envisaging this global behavior.
• To create computer aid decision systems for holonic manufacturing
systems. A significant problem of holonic manufacturing systems,
concerning the decision-making, is the local vision of the context. Consequently, it is impossible to ensure that the solution elaborated is the optimal one. Simulation can be an invaluable tool to help the decision maker while enabling him to see in the future the consequences of its decision. It’s the concept of proactive simulation.
8.3. Validation with simulation in HMS or
Product Driven Systems
Using holonic manufacturing system to control its shop floor is quite different of using a traditional hierarchical system. Indeed, using an emergent system, with which the solution is generated at run time is something new compared to classical predictive structures, were solution is computed off-line using powerful algorithms. There is a need to validate such a concept, and then to study its true adaptation to real system, as to show its better performances than hierarchical ones. Valckenaers
et al. [7] identified three kinds of approaches in order to validate the relevance of a
control system before its industrial use: • Implementation on a lab test bed
• Implementation of a pilot project on the shop floor • Use of a simulation model
Debugging and setting of a control system need stable and reproducible experimental conditions. However, physical systems are hard to bring under control and repeatability of experiences is not guaranteed. Adding the cost of hardware to build a pilot implementation and the implementation of a pilot on the shop floor seems to be a bad solution at this time. But only using simulation could lead to subdue some problems the modeller don’t know.
The use of a lab test bed could underline some interesting problems, coming from hardware and environmental disturbances, but building an industrially sized test bed is quite expensive. Indeed, it is really important to apply the technology in order to understand physical phenomenon and to take them into account, for example, using the RFID technology, the unperfected read rate.
Using a simulation model enable to study the scalability of a control system when the model is reflecting a complex industrial case study. If properly developed, a simulation model could be used as an emulator, in order to set-up the control system before to ‘plug’ it on the shop floor.
8.3.1. Concept of emulation
The emulation model does not integrate any decision rule, that is to say each point where decision have to be done is converted to a synchronisation point: a message, called synchronisation event, is sent to the control model, and the execution is paused until a resume order is received. On the synchronisation event reception, the control model could compute and send some information or parameters to the emulation model, in order to realise the control of it. For example, in front of a machine, the control model send back the machining program, or at the exit point of a stock, the next step where the pieces batch have to been sent.
The proposed methodology for building an emulation model is based on a systemic vision of the shop-floor system (Le Moigne, 1984). As we focus on products, we aim at representing their physical evolution. According to systemics, these evolutions can be modeled as shape, space and time transformations (Pannequin and Thomas, 2007), (Klein and Thomas, 2007).
So the first step of the modeling methodology is a shop floor analysis, in order to determine every physically possible product life-cycle. A state-transition approach is used: states correspond to stables product position and shape while transitions model physically possible spacial and morphological transformations.
In the second step, we aim at modeling actuation on products. Transitions between products states are implemented by shop floor equipments. Therefore we introduce two modeling constructs, shape and space transformations. These constructs must take into account physical constraints like cycle and setup time, capacity, etc... Moreover a third construct is defined, time transformation, dedicated to model products waiting between transformations.
Each shape and space transformation bloc offers an interface, which enable an external system to interactively control it. Control messages enable to request the transformation to setup, or to begin operating. Conversely, reports messages enable to know the transformation current state.
Using these tree kinds of modeling constructs, we are able to describe the shop floor structure in a generic way.
Finally, the emulation model would not be complete without a way to observe products. So the third step of the methodology is concerned with product sensing. These modeling constructs includes physical laws like limited scope and sensing accuracy. A RFID transponder is a concrete example of shop floor equipment modeled as a product sensor.
In conclusion, these modeling constructs enable to build an emulation model from the point of view of logistics. They aim at modeling the physical laws constraining products actuation, transformations and sensing, while offering interfaces to actuators and sensors.
8.3.2. Simulation modelling with emulator and control
system
8.3.2.1. Emulation Model
As previously evoked, every type of elements is represented by a basic element, that could be tuned function of the physical system it represents (batch size, transfer time…). A basic element is constituted of five components (figure 4):
• an entrance label,
• a first synchronisation point, called pre-synchronisation, in charge of correctly setting up the corresponding resource,
• a macro block representing the process performed by the resource, like in standard simulation model,
• a second synchronisation point, called post-synchronisation, managing the piece way and launching the next work on the machine,
• An exit point, where the entity is routed to the next step of the process. The synchronisation procedure is quite simple: when a moving entity comes in a synchronisation block, a message holding entity and localisation identifier is sent to the control system, then the entity is held until an order is sent back by the control system. This procedure is shown on figure 5. The number of event type is finite: we could define one for the pre-synchronisation and one for the post-synchronisation for each type of resource.
Element Input Pre-Synchro Post -Synchro Operatio nal Proces s Elem ent Ou tput Stocki ng Unit Transpo rt Unit Processin g Uni t
Figure 4 Components of basic element
Opposite to usual simulation models, moving entities only hold a unique identifier, which refers to corresponding data in the control model. As a consequence, the emulation model couldn’t run without a control model, because entity related data are not stored like attributes of an entity but in a database integrated to the control model. Emulation Model Control Model Simulation running A moving entity reach a synchronization point Sync. Event Computing Tuning Simulation running - Pre_Sync. - Post_Sync. Resume Emulation Model Control Model Simulation running A moving entity reach a synchronization point Sync. Event Computing Tuning Simulation running - Pre_Sync. - Post_Sync. Resume
Figure 5 Synchronisation procedure
8.3.2.2. Control Model
Control model is a discrete event system, which reacts to external events coming from the emulation module, from the user or from any other source. To enable control decisions making, the control model needs a physical world representation and a decision making process. These components could be or not separated.
To ensure the ability to exchange control model, we defined the communication interface between emulation and control model: that is to say to standardise messages between emulation and control models. Such a message contains following information’s:
• Synchronisation point identifier, which enable to identify the resource, its type, and the synchronisation type (pre or post synchronisation).
• Entity identifier, which is like a pointer on the entity description in the database.
This information enable the control model to update the information system, and then to compute the attempted decision. This decision would lead to a parameterisation of the emulation model (route or process tuning), and then a “resume signal” would enable the simulation to resume.
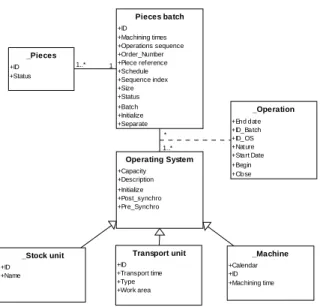
The first control model we designed represents the current industrial control system. We chose an object-oriented modelling method, where system components and moving entities are modelled like class objects (figure 6). Data about objects are stored like attributes when decision processes are included into methods.
Products are represented like “Piece” and “Pieces_Batch” classes. They only hold attributes and methods to initialise or updates these attributes. On the other hand, resources support attributes and decision methods, corresponding to pre and post synchronisation.
Generally, pre-synchronisation procedure relies on an update of product status and a tuning of the resource (operation time, capacity, lot size, breakdown laws). Decision rules are integrated in post-synchronisation procedure that computes to drive the pieces batch and to affect a new task to the resource.
Pieces objects are dynamically linked with the location object corresponding to where they are, via the operation class. The set of Operation object enables to implement some traceability, as about resources (tracking) REF than about products (tracing) REF + Définitions. This information could of course being enriched by a description of the operation and other relevant information’s.
_Pieces +ID +Status Pieces batch +ID +Machining times +Operations sequence +Order_Number +Piece reference +Schedule +Sequence index +Size +Status +Batch +Initialize +Separate 1 1..* Operating System +Capacity +Description +Initialize +Post_synchro +Pre_Synchro 1..* * _Operation +End date +ID_Batch +ID_OS +Nature +Start Date +Begin +Close _Stock unit +ID +Name Transport unit +ID +Transport time +Type +Work area _Machine +Calendar +ID +Machining time
Figure 6 Industrial control system model
8.4. Simulation: a computer-aid tool for
products driven systems
Due to its distributed intelligence, product-driven control replaces predictive decisions by reactive and local ones. We could think that global decisions disappeared. It is not true. Indeed, at the root of the concept of supply chain, there is a necessary global vision of the industrial system. A major goal of the supply chain is to "improve the flow of material between suppliers and customers at the highest speed" (Proth, 2006). This goal suggests making global management decisions, which are not removed by product-driven control. In addition, the local decisions sometimes require the knowledge of the global behaviour of the system.
In a product-driven control system, the product utilizes decision rules. To make its decision, the product applies these rules to its parameters to know what has to be chosen. But in the majority of the situations, the product is not the only actor of the decision-making. The decision is made by both the product and the production line decision centre. Let us present the example of a ranking criterion in a queue. A product arriving in a queue has to decide its rank in this queue. From its parameters (Due date, priority...), it applies a ranking criterion (SPT, EDD, CR/SPT...) to know its position in the queue. But it is the decision-making centre of the production
system that chooses the ranking criterion which has to be used by the product. Thus, the decision is made on two hierarchical levels.
In the problem solving procedure, a decision centre has a set of given alternatives and is aware of the consequences of each. In a general way, a decision requires two conditions. First, it is necessary to know the whole parameters influencing the decision-making. Then, the decision maker must have a forecasting tool allowing him to foresee, in the future, the consequences of his decision.
To make these global decisions, the managers need to have a global vision of the production system behaviour.
The problem, in product-driven systems, is that the global behaviour results from the whole local decisions which will be made in real time. It is thus very difficult for the manager to know the current state of his production system (Vision) and foresee its future evolution (Forecasts).
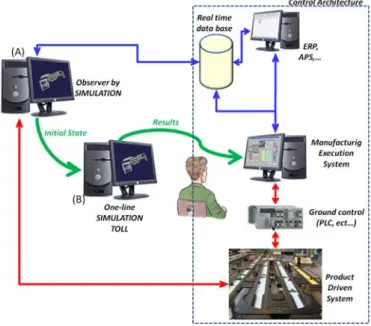
Figure 7: Architecture for aid-decision by simulation in a product driven system.
A new perspective is to consider simulation as a decision-aid tool in the context of product driven system. In the end of the 90s, several studies were lead about the future of discrete event simulation. Their main idea was to switch from a design aimed simulation to a decision support simulation. This concept was named in (Davis, 1998) as “online simulation”.
The major problem of this proposition is the initialization of the simulation. The majority of simulation tools begin their execution with an empty and inactive
system. However, the state of the system when the pilot wants to launch a simulation is not empty. There are works in process. So, it is necessary to initialize simulations with a non empty state.
In (Cardin, 2007), Olivier Cardin proposes to utilize two simulations to realize a decision-aid tool based on simulation. The first simulation (A) is an observer of the system. It reproduces the behaviour of the real system. Its connection with the M.E.S. makes it possible to correct a possible drift during time. When the pilot wants to foresee the system behaviour, he launches a online simulation (B). Then, the observer (A) gives to the simulator (B) the actual state of the system to initialise the simulation. At the end of the simulation (B), results are sent to the M.E.S. to allow to the pilot to take his decision.
8.5. Industrial applications
8.5.1. Furniture company Case study
8.5.1.1.. Context
The case study is based upon the workshop of a ready-to-assemble furniture manufacturer (figure 8). This workshop is composed of 8 machines, organised in production cells. The first machine is a disjunctive process: big particle panels come in and are cut to the final piece sizes. This process is out of the scope of this paper. What particularly interests us are the following drilling and grooving machines. Each one has particular features, and is able to complete several operations. Consequently, there are many possible operation sequences, and the pieces diversity (more than 1800 furniture references, so more than 10,000 piece references) makes physical flows and their control much complex. Moreover, about 70 batches are released every day, which average size is about 400 units, imply several different and sizeable batches at the same time in the workshop. The end of the process is the packaging line, where pieces have to be grouped by furniture reference. Of course, all the pieces of the bill of material of furniture have to be completed before starting to package. Three intermediary stocks, composed of several FIFO stacks, enable to buffer physical flow between machines.
We could summarize considering that the goal of the whole workshop is to deliver ready-to-assemble furniture on time to the client. The factory throughput is hardly linked with the packaging line throughput: any rate losses on the packaging line decrease the global throughput. On the other hand, pieces are pushed in the workshop by the cutting tool. Logistic service considers as a rule that the aim of machining machines is to keep the edging stock before the packaging line between a
low boundary and an upper one. So, decisions taken about the schedule of machining machines are quite important regarding to the level and the nature of this WIP. This led us to focus, in a first time, on the inventory located between the cutting tool and the first machining cell, and then the feeding of following machines. The machining cell we studied is composed of three drilling machines (1, 2 and 3). Most of the pieces have to be drilled in this cell, after what they could be finished or need another machining in the second cell. Consequently, scheduling decision taken relatives to drilling machines have an impact as on other machines than on the packaging line efficiency. We could classify the objectives of scheduling decision about the feeding of drilling machines in two groups: local impacts and global impacts. Big particle panels Cutting tool WIP 1 Drilling Machine 1 Drilling Machine 2 Drilling Machine 3 Drilling Cell WIP 2 Machine 4 Machine 5 Machine 6 Machining Cell WIP 3 Packaging line Ready to assemble furnitures Rolling ways
Figure 8: Synthetic view of the workshop
On the one hand, local impact is about drilling machines productivity:
•
T
he schedule could be modified in order to reduce set-up times, which arenot taken into account when computing the detailed schedule. Grouping is done considering available orders and pieces plans.
• The choice could be done to use an alternative route, in order to face a breakdown or to balance the load between drilling machines. Indeed, predictive scheduling is statically computed without any visibility on the WIP evolution across time, which could lead to a physical inventory congestion.
• Due to physical infrastructures, some lots are more easily accessible than others, so feeding operator could decide to change the schedule function of pieces location in order to reduce handling.
On the other hand, we could identify a global impact, which is about others machines and the packaging line:
• If the pieces lot is finished after the drilling operation, it would straight be placed in the edging stock in front of the packaging line, having an impact on its level,
• If the pieces lot have to be machined in the second cell, it could be urgent, for example in order not to starve a machine. Opposite, it could be better to wait in order not to congest the flow in front of a slowest machine.
If feeding operators could easily evaluate the local impacts of their decision (if they have the knowledge), it seems difficult to evaluate the global impact, because they don’t have the visibility on the global WIP of the workshop.
8.5.1.2. Proposed architecture
The pilot implementation aims at improving decision relevance in front of the drilling cell (WIP 1), as about their local impact than about their global one, giving to the feeding operator much important information, without necessarily swamping it with a mass of information.
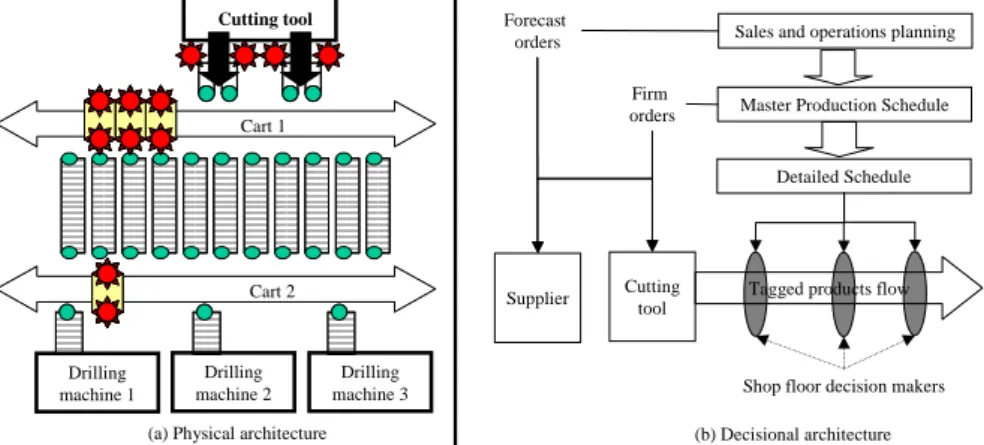
The global physical architecture of the pilot project is (figure 9.a):
• Pallets are tagged, and they are associated to the lot they hold on output of machines,
• Carts are equipped with reading points, and detect every pallet movement, • A middleware concentrate outputs form every readers, and transmit them to
the location application,
The location application updates the area map and displays it to operators, and support the gap with the company information system. This piece of software is developed using a three-tier architecture.
In a first time, we propose to maintain the Sales and Operations Planning (SOP) and the Master Production Schedule (MPS) elaboration processes following the MPCS. Indeed, these are long terms plans, which aims are, for the SOP, to size the production system according to the demand forecast, and for the MPS, to spread the load through time in order to smooth it. These processes, about the whole shop floor, need to be done with a global view, and then it seems to be logical to establish them following a centralized process.
At the detailed scheduling level, both solutions are possible. Having a global view on the system will enable to compute an optimised schedule which will be impossible to follow if a problem occurs. On the other hand, building a schedule with a distributed way at runtime doesn’t ensure its optimality. We propose to centrally generate a detailed schedule which becomes a framework, and distributed agents try to follow it. However, their intelligence will enable them to dynamically adapt it according to events occurring on the shop floor. This solution presents the advantage to follow, as it is possible, the globally optimised schedule, and to minimize performances losses when differing from it.
We could distinguish two elements useful to have an efficient control on products flow (figure 9 b):
• A globally optimised framework, centrally computed, using many data from different company department,
• Dynamic information, coming from products and resources, which give a view on the global situation, on real time. Resources transmit information about their status and current performances, when product give technical information about their manufacturing sequence, their options or the position they are, which enable to have a view on the global WIP.
The control system relies on an unchanged MPCS system (SOP, MPS and detailed Schedule), so current information system is ever suitable. The question is about what information and procedure, particularly the ones held by the product, will enable an efficient shop floor control of manufacturing flows. This control system is not yet implemented, and to validate the future autonomous decision making process, operators still have to take decisions according to information from tagged products. Cutting tool Cart 2 Cart 1 Drilling machine 2 Drilling machine 3 Drilling machine 1
Sales and operations planning
Master Production Schedule
Detailed Schedule Cutting tool Forecast orders Firm orders
Shop floor decision makers (a) Physical architecture (b) Decisional architecture
Supplier Tagged products flow
Figure 9: Proposed architecture
The main benefits seats in the automation of data sensing. Firstly, this would leads to cancel any capture time, and ensures event capture time coincide with event occurring time. This architecture provides a real time sensing of shop floor events. Secondly, pallets tagging reduces data aggregation level. Previously, only beginning and ending of an operation were tracked. Consequently, an operation had a binary status, began or over. Now, the ability to know the number of processed pallets for a lot enables to more precisely evaluate task progress, for example in order to apply tasks overlapping. Also, identifying any lots enable to have a view on WIP level, but too on the nature of this WIP. For example you could have a high WIP level but being unable to package any lot. Thirdly, data reliability improvement is strongly
linked with RFID system performances. A fine set-up will enable to reach a near hundred percent reading rate, and consolidations procedures will lead to a relevant view of the WIP. The only remaining weakness is about quantity: tags being on pallets imply the quantity to be keyboarded by an operator, with all errors risks it implies.
Operators previously didn’t have any decision support systems at theirs disposal. Previous tries of giving them a simulation tool failed due to two reasons: the model maintenance and its feeding. The new availability of accurate data about the shop floor evolution will enable to continuously track gap between reality and model evolution, giving the way to finely and continuously refine model parameters, improving its relevance. Moreover, another reason of errors in results given by previous simulations was due to a bad initialisation. Data captured by RFID system will represent a relevant information source to initialise the model. An indirect effect of the RFID implementation seats in the computerization of the shop floor, enabling the operators to access technical data (like alternative routes) and decision support system.
The decision implementation will be improved by speeding up the appliance process and giving a detailed following of a decision impact. Firstly, the instantaneous location of pieces lot will reduce decision appliance time, removing lot research time, and avoiding the machining of an incomplete lot. Secondly, the feeding operator will now be able to quantitatively evaluate the impact of decision he takes a few hours before, instead of the previously perception, which was a quite qualitative appreciation coming from the packaging line responsible. This will provide it the ability to learn about the system dynamics, and then influence its reaction on next time a similar situation occurs. The tracking could lead to feed the technical database too, for example by noticing a new possible alternative route.
Finally, the first and obvious benefit of using Auto-ID is to give information to shop floor decision maker in order to improve its efficiency. But this could lead to reach a local optimal, with a quite good efficiency for drilling machine, but leading to load shortage on packaging line for example. A need emerged to enrich the static information (technical data) with dynamic information, about flows, deadlines or resource status, in order to drive drilling cell function of others cells, that are seen like clients. In a first time, we identified useful information, by listing every impact a decision on this decoupling point could had, and giving them to local decision makers. The analysis of the design and selection needed rules, in order to model them, to improve them when possible and then to develop a adapted distributed decision support system, have to be done using the simulator presented precedingly. In practical terms, intended benefits of such an implementation are:
• Shortest time for machine feeding, due to the instantaneous location of pieces lot, which remove the searching time. We note that, when WIP1 level is quite high, dead time between two lots were often near about 150% of set-up time, due to lots research time.
• Real time accurate visibility on WIP, which will lead to reduce shortages on packaging line. Simulation studies shown that controlling drilling machines function of WIP3 level AND nature led to reduce to half the number of idle time for the packaging line, which represents ten operators. • Reducing paper, and associating data to the product, improving data
reliability and synchronism,
• Improved control of resources, function of the packaging line needs and situation, seeing it like a client, and with an evaluation tool enabling to evaluate effects of different solutions.
• Improved quality, due to the automated checking of references on packaging line feeders. Indeed, the RFID system immediately generates an alarm if feeders are wrongly fed. Confusions were not really current, but each occurrence was really expensive, implying to stock out all the corresponding packages and then to manually check each of them.
8.5.2 Multi-lines Synchronisation
8.5.2.1 Industrial Context
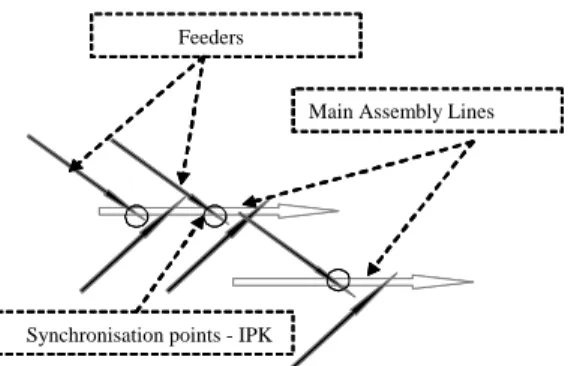
Trane Company provides indoor comfort systems and comprehensive facility solutions for residential, commercial and industrial building needs. The 29 production sites are designed according to DFT concepts. This Just in Time methodology leads having strictly similar assembly line organization (figure 10).
Figure 10: DFT structure
The objective is to optimize production through processes standardization. The production context is as follows: the shop floor is organized in pull production, and each finish product is assembled on a main assembly line.
To be sure that a needed component (semi-finished) arrives at the right time and thus avoids shortage there is the same inventory between assembly line and each feeder (called in process kanban - IPK).
The others components are managed by the basic kanban. In addition the control management must respect the objectives defined monthly by the tactical planning
Main Assembly Lines
Synchronisation points - IPK Feeders
suggested by the ERP (Entreprise ressource planining). These objectives are detailed weekly at MPS (master production system).
To summarise this presentation, although, this organization allows a great flexibility and reactivity on the level of materials flow it has many challenges: the first one, is how to better synchronise assembly lines and its feeder, the second, is how to give more visibility on the informational systems for example what will be the actual consumption of component because today 80% of components are managed by kanban and the consumption of inventories is realised in the backfluching phase. The third question is how to improve reactivity in case of disturbance? Consequently, that leads to synchronise the simulation/emulation used models to assure physical system control.
8.5.2.2 System architecture at TRANE Company 8.5.2.2.1 Pilot presentation
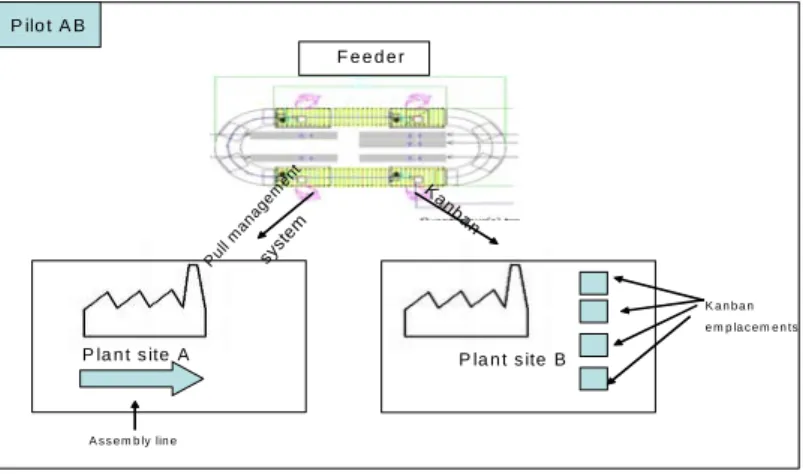
To answer the questions presented in introduction a pilot was chosen to evaluate the Product Driven System hypothesis pertinence. The pilot called PilotAB is composed by an assembly line and with 4 workstations and a feeder with 4 workstations also. This feeder must feed the main assembly line on site A and to satisfy the need for another production site called B (managed by basic Kanban) (figure 11).
F e e d e r P la n t s ite A P la n t s ite B Pul l m anag em ent syst em K an ban P ilo t A B K a n b a n e m p la c e m e n ts A s s e m b ly lin e
Figure 11: Pilot AB view
To summarize this part the need for site A is managed by pull management system; and in kanban for the site B. We must satisfy in priority the need for site A and to be able produce all the kanban requirements per day for the site B.
Discrete Event Simulation was chosen as the key question required assessment of process cycle time and queuing time. Arena was selected due to its ease of use and ability to deploy the model for future operational use at no addition cost. Indeed the Arena software makes it possible to simulate the behaviour of an assembly line and the statistics generated give to the engineer’s good indicators to integrate an effective system of traceability and control.
8.5.2.2.2 Proposed Architecture
In this case, we use the same architecture as presented previously. The control system is composed by a communication system connected with Oracle and the ERP (manufacturing orders and information traceability) and users interface to help human operator in his work by displing the method sheet and the bill of materials (figure 12). Arena Web Page Web Serveur Emulation Emulation System System Socket XMLHttpRequest VBA VB.NET ASP.NET Javascript Oracle Technical data Serveur
Oracle applications CINCOM
Demand Plan Socket Demand Plan Operating Operating System System Control Control System System
System TRANE General Architecture
Figure 12: the general architecture of the developed emulation testbed.
8.5.2.2.3 Control system description:
The control system is developed as a web application with ASP .Net and VB.Net due to the multi-sites context.
Concerning the pilot, the industrial aim is to produce ventilators according to components routings on different work stations. To assure product traceability and control material flow between the two sites, the web application is connected to an Oracle data base.
The operator screen proposes the following information:
• Information specifying the demand (Work Order Number, item part number, quantity, etc…)
• Bill of Material (these data come from the ERP)
• OMS (Operation Manufacturing Sheet) it is the description of the operations
• Information zones useful in case of breakdown in bar code or RFID tag scaninig
The figure 13 presents the Oracle Data base model where item and component are described and, on the other hand, where control process information specifies how traceability and demand follow up are made. In particular, we follow-up the components life cycle as the time spent in each workstion, the human operator working in this workstation.
Figure 13: Oracle Data base model
8.5.2.2.4 Communication interface
Following we describe the communication interface protocol (figure 14) useful to assure communication between the two sites (the two emulation models), the web application and the human interface.
0..* 0..* 0..* 0..* 1..1 0..* 1..1 0..* 1..1 0..* 1..1 0..* 1..1 0..* 1..1 0..* 1..1 0..* 1..1 0..* 1..1 0..* 1..1 0..* TRN_BOM + + + + + ID_BOM NUMERO_POSTE QUANTITE_COMPOSANT PARTNUMBER_COMPOSANT DESCRIPTION_COMPOSANT : int : int : int : int : String TRN_SOE + + ORDRE_OPERATION DESCRIPTION_OPERATION : int : String TRN_CONCERNE + + + QTE_A_REALISER QTE_REALISEE QTE_EN_COURS : int : int : int TRN_VENTILATEUR + + PARTNUMBER NOM_VENTILATEUR : int : String TRN_DEMANDE + + + NUMERO_DEMANDE STATUT_DEMANDE DATE_DEMANDE : int : String : Date TRN_OPERATEUR + + + NUMERO_BADGE_OPERATEUR NOM_OPERATEUR PRENOM_OPERATEUR : int : String : String TRN_POSTE + + NUMERO_POSTE ID_POSTE : int : int TRN_OPERATION + + + DATE_DEBUT_OPERATION DATE_FIN_OPERATION ID_OPERATION : Date : Date : int TRN_LIGNE_ASSEMBLAGE + + + NUMERO_LIGNE DESCRIPTION_LIGNE LOCALISATION_LIGNE : int : String : String TRN_CYCLE_VENTILATEUR + + + NUMERO_SERIE_TRANE STATUT_VENTILATEUR NUMERO_HELICE : int : String : int TRN_DEMANDEUR + + ID_DEMANDEUR NOM_DEMANDEUR : int : String TRN_AUTHORISATIONS + + + NTUSER ADMIN REPORTING : String : double : double TRN_PARAMETRES + + KEY VALUE : String : String
Web application Model A Human Interface i Model B 1: select (OF) 1: send (OF) 2: Product_Att(P1) 3 :Product_Att (Pn) Répeter n
4: Send (finished product) 5: send (OF) 2: Product_Att(P1) Send (info) Send (info) Web application Model A Human Interface i Model B 1: select (OF) 1: send (OF) 2: Product_Att(P1) 3 :Product_Att (Pn) Répeter n
4: Send (finished product) 5: send (OF) 2: Product_Att(P1)
Send (info) Send (info)
Figure 14: A UML diagram for communication protocol
The web application send the OF parameter to Arena wich create entities with the resceived attributes then, the emulation system (Arena) emules the item bar code scan and sends, via a socket scanned information (Trane reference number, WO number, etc…). When Arena data are receipt, in the meantime operator work center send a request (via a XMLHttpRequest object), the control system store them in the data base.
As soon as Web application is launched, it sets up a server socket thanks to SocketClient DLL writed in VB.Net. Socket is the only communication way between Arena models and Control system and XMLHttpRequest objects are the only ones between work centers and Control system.
This system made it possible to obtain a efficient communication between the architecture components but it does not make it possible to validate the correct operation of the Web application
8.5.2.3 Limits and Perspectives
In term of synthesis, we were able to propose an effective way to synchronize several simulation models. We proposed a special architecture to manage the material flow between two sites and to assure traceability. This architecture is composed by a real control application connected with the physical manufacturing system, on the one hand, and with an emulation system, on the other. Thanks to this last system, it is possible to evaluate the decision making process effect before to actually implement it in the operating (real) system.
The main weakness of this proposition lies in the time management. Effectively, time schedule periods are different in emulation model (Arena) and the web application and in certain circonstancies it could be a problem. HLA is a good way to solve this problem and the following chapter is dedicated to this subject.
8.5.3. AGP Case study
This work was realized by Pascal BLANC at the time of his thesis (Blanc, 2006). In this industrial case, a make-to-order management policy is used to manufacture a highly customisable product. This product is very sensitive to quality problems. The process is mainly manual and is subject to numerous random events. Moreover, the firm has a high activity in prototype design. As a result, numerous normal and corrupted flows, due to rejection or reworking, intermix. In addition, the use of raw material and the maximisation of the productivity are also a main objective. As a consequence, dynamic cooperative and\or competitive lot-sizing and scheduling mechanisms have to be developed. Controlling such a complex system at such a level requires the coordination of various complex models as well as the integration of this control in an existing control structure. A simulation model of this industrial application was made which utilize both ARENA to model the physical system and a MAS platform to model the control system.
8.5.3.1.. Context
Figure 15: The product of AGP
American Glass Product (AGP), in Curitiba, Brazil, produces laminated security glass for automotive application. The product is defined by its geometry (dimensions, curve), printed characteristics (logo of the client, black outline frame, antenna, demisting grid) and its composition (figure 15). AGP manages mostly a design-to-order and a make-to-order policy.
The process is decomposed in three main parts (figure 16): glass pre-process, plastic cutting and final assembly. The glass pre-process aims at preparing the glass lites: glass cutting, edge grinding and polishing, silkscreen printing and glass bending are the operations performed during this step. The plastic lites are then cut, in function of a recipe and the whole is finally assembled. For additional information, an extensive description of the process, is available in (Blanc et al. 2004).
Figure 16: Synoptic diagram of the process
8.5.3.2. Proposed architecture
To build the HMS, various multi-agent system development generic methodologies have been considered. The Vowel (AEIO) approach developed by (Demazeau, 1995) aims at defining a conceptual frame for the multi-agent system specification. AEIO stands for: Agent (structure, functions and behaviours), Environment (set of existing objects in the SMA), Interaction (languages and protocols) and Organisation (relationships, dependencies, authorities). Cassiopeia, developed by (Drogoul and Zucker, 1998), is based on roles definition: individual, relational and organisational, and proposes five steps (or layers) to perform the design of the MAS: individual roles, dependencies, relational roles, groups and organisational roles. Gaia, from (Wooldridge, et al., 2000), proposes six models structured in a three levels hierarchy: requirement statements, then roles and interactions, and finally agents, services and acquaintance. These methodologies are generic as they may be applied for almost any type of system. Moreover, they allow describing the structure of the MAS, without imposing a specific platform. They have in common two levels of specification: the micro level (definition of the agents) and the macro level (definition of the interactions between agents).
The use of the holonic architecture PROSA highly simplifies the design of the corresponding MAS, as the analysis step is almost completed since the roles of the agents and their interactions are already described. The conceptual architecture and the implementation step are also usefully completed using Holonic Component-Based Approach, such as described by (Chirn and McFarlane, 2000).
It is now necessary to describe a detailed and realistic mechanism for each agent to perform his role, at the micro and at the macro level.
Figure 17: UML class diagram of the basic holons
At the micro level, individual roles are defined for the basic holons. The class diagram (figure 17) shows the relations between the different classes of basic holons as well as their attributes. Product holons are information server to other holons, they answer queries concerning the product model or product characteristics formulated by resource holons or order holons. To that end, they share the database access with the ERP (Baïna et al., 2005).
Each order holon is linked to a product holon and controls the task required to manufacture this product, in accordance with the defined routing. Each task is defined by a standard duration, an earliest start date (ESD), a latest finish date (LFD) and a date of scheduling (DOS), if the task has been scheduled. This time-window approach gives an assessable margin of autonomy for the responsible resource holon to schedule this task. Order holons are also linked between them in accordance with the product model (BOM). Thus, if the product has components, the order holon is linked to order holon sons, and if the product is a component, the order holon is linked to an order holon father. A coordination mechanism is described in the next section to control the time parameter of each task in accordance with this structure. Finally each order holons has a status (initialisation, not scheduled, scheduled, scheduled out of bounds, manufactured), a priority (to classify the orders) and a weight (to indicate the importance of time limits).
Resource holons have to solve a lot-sizing and scheduling problem in accordance with their own model. They receive a task subscription from order holons as they own the specific competence to perform this task. They attempt to schedule this task in function of their capacity and the requirements for this task to be performed (such as tool availability). In addition to the schedule produced, resource holons may produce other results, such as raw material use plans.
The interactions between holons are described at the macro-level. These interactions define the behaviours of the holons for various scenarios. To illustrate these interactions a simple example is presented (figure 18).
Figure 18: Example of product model (BOM and routing)
Creation of an order holon. An order holon is initiated with a product holon
reference and a latest finish date (due date). It may be initiated by a user (commercial order for a finished good, internal order for stock in process), or by an other order holon (father). The order holon first query the correspondent product holon to retrieve the components it may require. If needed, the order holon will create order holon sons for each component initialising them with its latest finish date (figure 19).
Figure 19: Ordrer holons establish latest finish date (LFD)
The order holon evaluates then his earliest start date (figure 20), using the earliest finish date of his order holon sons or the present time of the system. Inconsistencies may be detected at this point as time-limit may not allow the task to be scheduled. In this case, a new latest finish date is calculated and the inconsistency is propagated to order holon father, which will alter its own bounds of time.
The scheduling mechanism considers first the earliest task: a task may not be scheduled if the previous tasks are not scheduled. Once the time window is established for the earliest task, the corresponding order holon subscribes to a competent resource holon which attempts to schedule the task. Once again, inconsistencies may be detected at this point, resource holons are then able to negotiate the reschedule of some tasks as time window may absorb this kind of disturbance (figure 21), or to negotiate bound of time for the least priority tasks if the workload is too high.
Figure 21: Marging for disturbance absorption
Once scheduled, the order holon informs its order holon father as this has to take the date of scheduling of his order holon sons into account to avoid inconsistencies (overlap of tasks).
Deletion of an order holon. The deletion of an order holon does not cause major
disturbance, it just have to be propagated to order holon sons. It may be interesting to reschedule then the others order holon, for optimisation purpose, this mechanism is describe in the next section.
Reschedule for optimisation purpose. Resource holon may attempt to reschedule in
order to optimise locally their working. The disturbances generated may be absorbed by the autonomy margin of each task. On the contrary, the tasks for which an inconsistency is detected may attempt to propagate the disturbance as it may bring an improvement of other schedule. Finally the resource holon may dispose of its reschedule if no agreement is found.
Synchronizing with the physical system. The events registered from the physical
system are not negotiable; they just may or may not lead to modify the schedules and/or the time windows. Various scenarios are conceivable when synchronizing with the physical system. Three main events are considered: the achievement of an operation, the loss of a product, and a resource breakdown. In case of loss of product, the creation of a new order holon may be necessary, thus the mechanism previously described is still valid.
On the one hand, most manufacturing systems are too complex to allow the use of realistic model evaluated analytically. On the other hand the use of discrete-event simulation is costly because of the modeling effort required to design and run the simulation model. Moreover, once modeled in satisfactory way, the control model has to be implemented to be used.
Figure 22: Connexion between MES/HMS and discrete-event simulation model for evaluation purpose
To solve these problems, a staff holon able to interface the HMS with a discrete-event simulator is introduced (figure 22). The simulation model only emulates the physical system, using a specific library of objects using Arena® software. This mechanism is valid as the manufacturing system is composed of a product-driven control and a discrete-event-driven process.
This staff holon acts as routers and guarantee that the messages received from the environment reach the holon they are addressed to (Galland, et al., 2001). This mechanism emulates the flow of information coming from the physical system. The holon staff, called facilitator, acts as a network server as incoming messages are transmitted via the TCP/IP protocol.
A specific object corresponds to the holon facilitator in the discrete-event simulation model. This object acts as a network client and relays the messages coming from the emulated physical part of the holons to the facilitator holon. He may also acts on the physical simulated system, in function of the messages received from the HMS. Communications between the HMS and the simulation model may be performed in a synchronous mode or in an asynchronous mode. In addition to this facilitator object, a generic resource holon object, which corresponds to the physical part of a resource holon has been developed. Order holons are linked to the entities of the simulation model. The facilitator staff holon is responsible for the correspondence between order holons and entities.
In this chapter we presented firstly the differents control architectures of manufacturing systems. The new concept of “Product Driven System” (PDS) was explained. We showed that we gradually moved from a predictive control to a reactive one. Product-driven control in manufacturing systems and holonic production systems falls under this evolution. In that context, simulation tools seem to be a good way to achieve the two different aims:
• To validate holonic and PDS concepts, and then to study its true adaptation to real system. Effectively, apart from simulation, we do not have any means of envisaging this global behavior.
• To create computer aid decision systems for holonic manufacturing
systems. Simulation can be an invaluable tool to implement the concept of
online simulation.
Firstly, we showed in what simulation could be useful for validation of a HMS or PDS. For such objective, generic simulation constructs and architecture were proposed for the emulation and for the control systems.
Then, we presented a new concept of online simulation. That kind of simulation will allow us to foresee the future behaviour of a PDS. In that sense, simulation will become a decision-aid tool.
Following three industrial applications were presented. The first one presented the application of generic simulation architecture to emulate a real production system. In the second one we highlighted the synchronization model problem and in that sense, we introduced the following chapter. Finally, the third one described the scheduling mechanisms used in a holonic production system an how that mechanism was simulated.
We treated in this chapter of new piloting architectures proposed by the research community, these last years. The validation of these new architectures is very important and it only can be to realize with a lot of difficulties in situ. Thus simulation is a very significant tool because it allows verifying the aptitude of these new structures to answer the new challenges of the supply chain.
8.8. References
Baïna S., Panetto H., Benal K., Morel G., 2005. Adapting HPM to B2M interoperability issues: Towards Interoperability between Business Management Level and Shop Floor Level, INTEROP-ESA’05, Geneva, Switzerland.
Blanc P., (2006). Pilotage par approche holonique d'un système de production de
vitres de sécurité feuilletées. Thèse de doctorat, Ecole Centrale de Nantes et
Université de Nantes.
Blanc P., Castagna P., Demongodin I., Mebarki N., (2004). Multi-Modelling and multi-agent approaches for the control evaluation: an industrial case, in: 13th
International Working Seminar on Production Economics (WSPE), IGLS
Cardin O., (2007). Apport de la simulation en ligne dans l’aide à la décision pour le
pilotage des systèmes de production, Thèse de doctorat, Ecole Centrale de Nantes
et Université de Nantes.
Chirn J-L., McFarlane D.C., (2000), Application of the Holonic Component-Based Approach to the Control of a Robot Assembly Cell, in: IEEE Conference on
Robotics and Automation, San Francisco.
Davis, W. J. (1998). Online simulation: Need and evolving research requirements. Dans J. Banks, Handbook of Simulation (pp. 465-516). John Wiley and Sons Inc. Demazeau Y., 1995. From interactions to collective behaviour in agent-based systems, in: European Conference on Cognitive Science, Saint-Malo, France. Drogoul A., Zucker J.-D., (1998), Methodological Issues for Designing Multi-Agent Systems with Machine Learning Techniques: Capitalizing Experiences from the RoboCup Challenge, LIP6 1998/041, LIP6 research reports
Galland S., Grimaud F., Beaune P., Campagne J-P., 2001. Méthodologie pour la simulation de systèmes industriels complexes et distribués au traves d’une étude de
cas, in: 4ème Conférence Internationale de Génie Industriel, Aix-Marseille-Ajaccio
(Bertrand et Kieffer), 2, pp 673-684.
Proth, J.-M. (2006). Scheduling: New Trends in Industrial Environment.
INCOM'2006. Saint Etienne: Page 41-47.
Wooldridge M., Jennings N., Kinny D., (2000). The Gaia Methodology for Agent-Oriented Analysis and Design, Autonomous Agents and Multi-Agent Systems, 3, pp 285-312.