1650, Page 1
Assessing the quality of Experimental Data with Gaussian Processes: Example with an
Injection Scroll Compressor
Sylvain QUOILIN
1*, Jessica SCHROUFF
2 1Energy Systems Research Unit B49
2Cyclotron Research Centre B30
University of Liège
Campus du Sart Tilman
B-4000 Liège, Belgique
Corresponding author:
Tel: 0032-4-366 48 22
Fax: 0032-4-366 48 12
[email protected]
* Corresponding Author
ABSTRACT
This paper describes an experimental study carried out on a refrigeration scroll compressor with and without vapour injection. The test rig designed for that purposed allows evaluating the performance over a wide range of operating conditions, by varying the supply pressure, the injection pressure, the discharge pressure, the supply superheating and the injection superheating. 97 Steady-state points are measured, with a maximum isentropic efficiency of 64.1% and a maximum consumed electrical power of 13.1 kW. A critical analysis of the experimental results is then carried out to evaluate the quality of the data using a machine learning method. This method based on Gaussian Processes regression, is used to build a statistical operating map of the compressor as a function of the different inputs. This statistical operating map can then be compared to the experimental data points to evaluate their accuracy.
1. INTRODUCTION
Multiple studies have demonstrated that using vapour or liquid injection during the compression process can increase the part-load performance of refrigeration and heat pump systems (Winandy, 2002; Shi, 2009a-b; Wang, 2009). Injection compressors are now common components and largely adopted in many HVAC systems. However, accurate simulation models of the compressor are still needed to improve and optimize such systems.
These models differ by their level of details, target usage, accuracy, application range, etc. In many cases, the target systems are too complex to be modelled deterministically, i.e. taking into account all the physical, chemical, thermodynamic phenomena. Therefore, a whole range of models rely on experimental data to tune lumped parameters (calibration) and check their accuracy (validation). These models can be referred to as grey box or semi-empirical models, a good example being the one proposed by Winandy and Lebrun (2002) and taking into account the main sources of losses such as under and over-expansion, internal leakage, pressure drop, friction and ambient losses.
Some other models can also be referred to as purely empirical, or statistical. It is the case e.g. of linear regressions, in which experimental data is used to derive the coefficients of a purely mathematical expression that was not originally designed to describe the physics of the process. A very common example is the model proposed in the European standard EN12900, expressing the consumed power and the refrigerant flow rate as a function of the condensing and evaporation temperatures:
1650, Page 2
. . . .
. . . (1)
. . . .
. . . . . (2)
The common point between these different types of models is that they rely on accurate experimental data to tune their parameters. However, this data is inherently multivariate and is subject to many sources of noise and errors, such as sensor malfunctions, transient phenomena, operator misuse of the test rig, noise in the data acquisition chain, unaccounted for external influences, etc. It is therefore useful to develop a tool that can easily assess the quality of the experimental data: this tool should measure the explainability of the acquired variables with respect to the externally imposed operating conditions. It should moreover assess the sensitivity of the dependent variable to the measured ones in order to reject non-relevant explanatory (input) variables. The scientific literature provides different examples of such experimental data for injection compressors (Winandy, 2002; Cho, 2000; Cho, 2003; Dutta, 2001; Wang, 2007), but none of these studies provide a detailed analysis of the data quality and of the explainability of the measured performance with the measured operating conditions.
Gaussian Processes provide an automatic and robust framework to perform multivariate regression. Their Bayesian formulation allows predicting the variable of interest for new/unseen data points. Furthermore, it provides confidence intervals which boundaries depends on the data density: if the data density is locally high, the variance will be small, on the opposite, if the density is low, the variance is larger, leading to more distant confidence boundaries.
It can be shown that Gaussian Processes perform much better than traditional linear regression in several ways. It is less subject to over-fitting, to the Runge phenomenon, and exhibits a much better behavior outside of the fitting range. It allows assessing the quality of the experimental data by building a smooth operating map of the process with respect to the explanatory variables (inputs) and comparing the average distance between the experimental data and this operating map.
This paper presents an experimental campaign carried out on a vapour injection scroll compressor. The test rig is described and the main experimental results are provided. A critical analysis of the experimental data is then provided using a novel method involving Gaussian Processes regression.
2. EXPERIMENTAL SETUP
The compressor under investigation is a standard refrigeration scroll compressor with vapour injection. The swept volume is 166 cm³ and the nominal rotational speed is 2900 rpm.
In order to test the compressor over a wide range of operating conditions, a dedicated test rig is built. This test rig differs from a standard injection heat pump because it is necessary to ensure an independent control of both the evaporation and injection pressures. The superheating at the compressor supply and injection port should also be controlled.
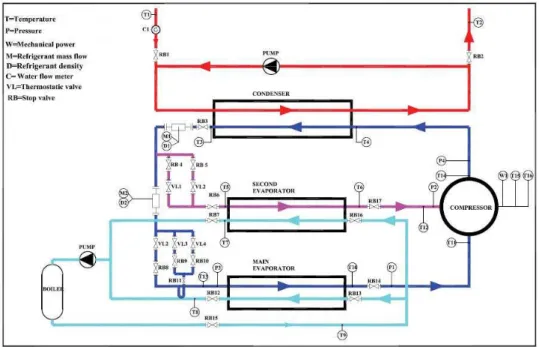
A schematic representation of the test rig is proposed in Figure 1: The refrigerant loop comprises a main evaporator, an injection evaporator, the compressor, a condenser and several expansion valves. The refrigerant is R407C. The main evaporator and injection evaporator are fed with a glycol water (50% volumetric solution of propylene glycol). The glycol water loop comprises a pump, an electrical boiler, an expansion tank, a by-pass loop and different manual control valves (at the inlet and outlet of the main evaporator and the injection evaporator).
The condenser is cooled by tap water with a recirculation pump to achieve a good control of both the inlet and outlet water temperatures.
The characteristics of the main components are provided hereunder:
• The main evaporator is a coaxial heat exchanger.
1650, Page 3
• The boiler is made of two concentric cylinders, the internal cylinder being completely closed and filled with gaseous nitrogen to deal with the thermal expansion of the liquid. The glycol water is heated by 10 electrical resistances (6 resistances of 9 kW and 4 resistances of 6 kW). A flow-check sensor is installed at the boiler exhaust, to protect the boiler from overheating. The pump nominal flow rate is 40m3/h.
• The boiler is equipped with a temperature regulation system, which allows maintaining a stable temperature at the boiler exhaust (by switching on and off and modulating the electric resistances).
• Two expansion valves are installed in parallel in the injection loop. This configuration is necessary because of the wide range of thermal loads to be tested: varying the thermal load has an impact on the refrigerant flow rate, which requires the use of expansion valves with different orifice sizes.
• Three expansion valves are installed with different orifice sizes for the same reason as above.
• The condenser is a shell and tubes heat exchanger and use tap water for refrigerant condensation.
Figure 1: Text bench layout (adapted from Zabeth, 2011)
3. EXPERIMENTAL RESULTS
97 operating points are measured by averaging the steady-state data on a period of about 120 seconds. Some tests are carried out with injection while for some others, the injection valve is close. The operating conditions are varied to cover a testing range as wide as possible with the test rig. In this work two types of variables are distinguished:
• The imposed operating conditions: these conditions are imposed to the compressor by the test rig and by the operator. These variables are considered as inputs of the process.
• The measured performance variables: these variables are consequences of the inputs variables and depend on the compressor only. They are imposed by the process and are considered as outputs of the process. It should be noted that the distinction between input and output variable can be arbitrary. As an example, it can be considered that the evaporation pressure is imposed by the process and the evaporator mass flow rate is imposed by the compressor. However, it would also be acceptable to consider the mass flow as an input and the pressure as an output.
1650, Page 4
!,# $% &'( &'(, !,# &'($
) (3)
where !, and &'(, !, are the isentropic outlet enthalpy considering the supply and injection entropies respectively.
The variation range of the inputs and outputs during the experimental campaign is summarized in Table 1. Table 1: Overview of the experimental results
Variable name
Range
Imposed operating conditions (inputs):
Supply pressure
* [bar]
1.52-9.21
Injection pressure
*
&'([bar]
1.98 – 14.1
Discharge pressure
*
![bar]
11.3 – 33.2
Supply superheating
∆, [K]
1.1 – 43.6
Injection superheating
∆,
&'([K]
0.5 – 52.7
Measured performance data (outputs)
Supply mass flow rate
[kg/s]
0.0410 - 0.2427
Injection mass flow rate
&'([kg/s]
0 - 0.0429
Electrical power
) [kW]
4.4 – 13.1
Exhaust temperature
,
![°C]
56.5 – 121.2
Recalculated performance data:
Isentropic efficiency
[%]
44.7 – 64.1
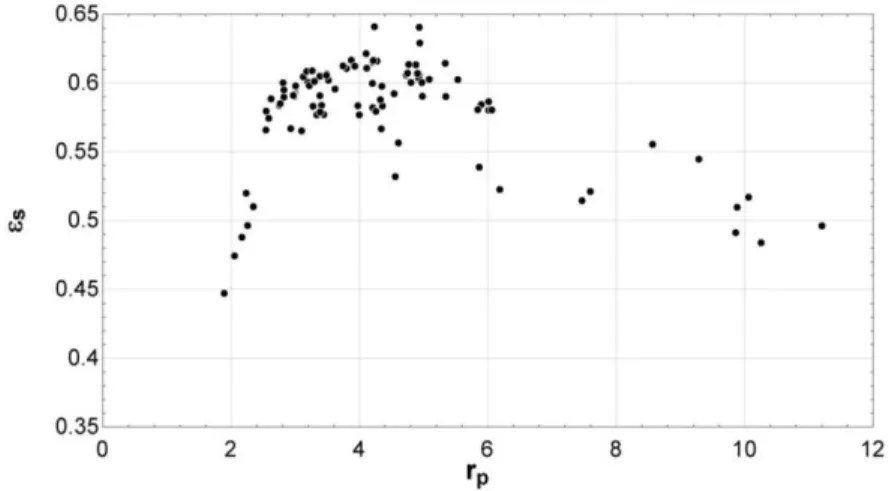
Figure 2 shows as an example the measured isentropic efficiency as a function of the overall pressure ratio. A trend can clearly be deducted from this plot: the efficiency increases with the pressure ratio, passes by a maximum around rp=4 and then decreases. This effect is a well-known effect and is due to under and over-expansion losses (Quoilin,
2012). However, Figure 2 also shows a large scattering among the data points, due to the variation of the other operating conditions. This highlights the necessity to conduct multivariate analyses for this kind of problem: the isentropic efficiency (an output) depends on more than one operating conditions (inputs). It is therefore important to determine which are the relevant inputs, and to establish with which accuracy a given set of inputs can be used to predict the measured output values.
1650, Page 5
4. DATA ANALYSIS
To assess the quality of the measured data, a multivariate regression is performed using Gaussian Processes (Rsmussen, 2006). Gaussian Processes regression is a pattern recognition technique (Bishop, 2006). These methods build a model from a learning set, comprising both inputs and corresponding outputs. The model can then be applied to new/unseen inputs and provide an output, i.e. make a prediction. Pattern recognition techniques have been successfully applied to various fields (e.g. image processing, bioinformatics, neuroimaging). This recent success is mostly due to the introduction of kernel methods (Laconte, 2005), which allow a computationally efficient way of solving ill-posed problems, and, along with proper regularization, avoid overfitting (Shawe-Taylor, 2004). Kernel methods consist of a collection of algorithms based on pair-wise similarity measures between all examples or patterns, summarized in a kernel matrix. The choice of the kernel is an important parameter of the modelling procedure, since it defines characteristics of the model, e.g. smoothness, periodicity, complexity.
In the present case, the goal is to build a smooth multidimensional hyperplane representing the performance map of one output as a function of the inputs. The hyperplane should be smooth to avoid fast variations in one direction or another, which thereby assumes slow, continuous changes in output values. In this context, any outlier data point (e.g. due to a sensor malfunction) would have a very low weight in the building of the hyperplane, which would lead to a large distance between the data point and the hyperplane, in the multidimensional space.
In the present work, the smoothness of the hyperplane is defined by the choice of a Square Exponential (SE, a.k.a Gaussian) kernel. Mathematically, considering a dataset D = {xi, yi}, i=1…N, consisting of pairs of samples (or feature vectors) xi∈ RD and labels yi, the SE kernel is written:
k
SE(x, x’) =
-
.!* /0
!#! 1$.. 2.
3
(4)
Where kSE represents the similarity between feature vector x and x’, σ2 is the variance and l is the length-scale, i.e. l
determines the speed at which the model can vary.
In the present case, it is suspected that the model should not vary at the same speed in all directions, i.e. input dimension. To allow for different speeds of variation in different dimensions, the model is based on Automatic Relevance Determination (ARD), which defines a length-scale per dimension, instead of one length-scale for all dimensions.
To assess the accuracy of the model, a cross-validation is usually performed. This means that the dataset is divided in two: one part is considered as training set, to build the model (with inputs and output), and the other is used to predict the labels yi* of new/unseen inputs. The predicted labels are then compared to the true labels yi. To avoid
losing data, the partitioning is then rotated, with each partition (referred to as a fold) leading to an accuracy evaluation. Results are then averaged across all partitions. In this work, the accuracy of the model was assessed using a Mean Average Relative Error (MARE), based on a leave-one-out cross validation. I.e. for each fold, one data point was used as test while all the others were used to train the model.
In addition to the classification, a step of feature selection was considered: it automatically selects which inputs are of importance for the model and reduce the dimensionality of the hyperplane. In this work, the approach followed is the same as in (Shrouff, 2012): the inputs are added one by one, and for each possible combination of inputs (e.g. [psu], [psu, pinj], [psu, pinj, pex, ∆Tsu, ∆Tinj]), a GP regression is performed and evaluated. The feature set leading to the
smallest MARE is then considered for further classification.
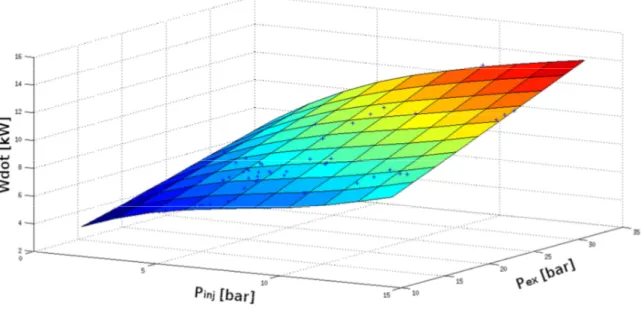
Figure 3 and Figure 4 present two examples of such analysis for the case with two different inputs (a two inputs regression is the maximum dimensionality that can be displayed in a 3D plot). The smooth surface is the GP regression while each cross indicated a data point. In Figure 3, the output power is predicted as a function of the injection pressure and of the discharge pressure. The distance between the data points and the smooth surface is small, which indicates a good fit and shows that this output can be correctly predicted with these two inputs. In that case, the value of MARE is 2.25%. On the contrary, Figure 4 shows that the distance between the data points and the
1650, Page 6
smooth surface is high when the two inputs are the injection pressure and the supply temperature. This indicates that those inputs are not suitable to predict the output power. In that case the value of MARE is 15.3%.In addition to features containing only a low level of information regarding the variable of interest, adding irrelevant features also adds noise to the inputs-output pairs considered for training the model. Therefore, it is expected that the MARE will first decrease when adding relevant dimensions, but will then increase when adding too many irrelevant features (inputs).
Figure 3: Prediction of the output power with two relevant inputs (Pinj and Pex)
1650, Page 7
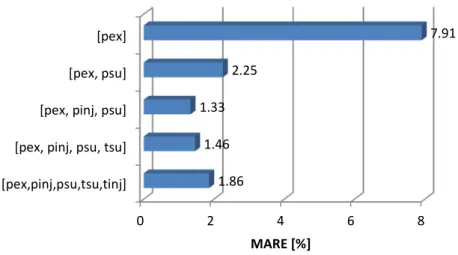
The different inputs can therefore be classified in terms of relevance by their impact on MARE. The MARE values are reported in Figure 5 for the different combinations, starting by the most relevant input and adding the following most relevant inputs at each simulation. As shown in Figure 5, the MARE decreases for the three first inputs, but increases when the temperature inputs are added. This shows that the temperatures should not be considered as relevant inputs for this process.Figure 5: MARE for different set of inputs
5. CONCLUSIONS
This paper presents a novel method to analyse measured experimental compressor data. The method relies on Gaussian Processes regression and allows evaluating the quality of the data using a numerical indicator (MARE). This kind of indicator is of primary importance, since it can be used to assess the quality of correlation between some measured operating conditions (inputs) and some measured performance data (outputs). It provides a benchmarking standard to compare different sets of experimental data.
In addition to the evaluation of the quality of the measurements, the method also allows to evaluate which variable are relevant for the prediction of the output values.
The method is illustrated for the practical case of an injection scroll compressor. The test rig designed to measure the compressor performance is described, together with its control. 97 steady-state operating points are measured, and the achieved performance is provided. By applying the method proposed in this paper, it can be concluded that the output power can be predicted with the measured explanatory variables with an average error of 1.33%.
Furthermore, the feature selection capability of the proposed method allows determining the relevant variable in the prediction of the output power. These variables are the three pressure levels. The temperature measurements only present a very limited influence on the performance and should not be taken into account since they decrease the accuracy of the prediction.
NOMENCLATURE
P, p
pressure
(bar)
inj
injection
T
temperature
(K)
s
isentropic
M&
mass flow rate
(kg/s)
su
supply
W&
mechanical compressor power (W)
V
volume
(m
3)
N
compressor revolution speed
(1/s)
0 2 4 6 8
[pex,pinj,psu,tsu,tinj] [pex, pinj, psu, tsu] [pex, pinj, psu] [pex, psu] [pex] 1.86 1.46 1.33 2.25 7.91 MARE [%]
1650, Page 8
h
specific enthalpy
(J/kg)
Subscripts
Greek symbols
cp
compressor
∆
difference
ex
exhausted
ε
efficiency
REFERENCES
Bishop, C. M., 2006, Pattern Recognition and Machine Learning. Springer.Cho H. and Kim Y., 2000, Experimental study on an inverter - driven scroll compressor with an injection system,” in Proceedings of International Compressor Engineering Conference at Purdue University, Purdue University. Cho H., Chung J. and Kim Y., 2003, Influence of liquid refrigerant injection on the performance of an inverter -
driven scroll compressor, Int. J. of Refrigeration 26, pp. 87-94.
Dutta A., Yanagisawa T. and Fukuta M., 2001, An investigation of the performance of a scroll compressor under liquid refrigerant injection, Int. J. of Refrigeration 24, pp. 577-587.
LaConte, S., Strother, S., Cherkassky, V., & Hu, X., 2005, Support vector machines for temporal classification of block design fMRI data. NeuroImage, 26, 317-29.
Quoilin, S., Declaye, S., Legros, A., Guillaume, L., & Lemort, V., 2012, Working fluid selection and operating maps for Organic Rankine Cycle expansion machines. Proceedings of the 21st International Compressor Conference
at Purdue.
Rasmussen, C. E. and Williams C. K. I., 2006, Gaussian processes for machine learning., The MIT Press, Cambridge, MA, USA 38 715-719.
Schrouff, J., Kussé, C., Wehenkel, L., Maquet, P., & Phillips, C., 2012, Decoding semi-constrained brain activity from fMRI using Support Vector Machines and Gaussian Processes. PLoS One, 7(4): e35860, doi:10.1371. Shawe-Taylor, J., & Cristianini, N., 2004, Kernel Methods for Pattern Analysis. Cambridge University Press. Shi Wang, W. and Li X., 2009a, Numerical analysis on the effects of refrigerant injection on the scroll compressor,
Applied Thermal Engineering 29, pp. 37-46.
Shi Wang, W. and Li X., 2009b, Optimization of refrigeration system with gas-injected scroll compressor,” Int. J. of
Refrigeration 32, pp. 1544-1554.
Wang X., Hwang Y. and Radermacher R., 2009, Two-stage heat pump system with vapor - injected scroll compressor using R410A as a refrigerant, Int. J. of Refrigeration 32, pp. 1442 -1451.
Wang B., Li X., Shi W. and Yan Q., 2007, Design of experimental bench and internal pressure measurement of scroll compressor with refrigerant injection,” Int. J. of Refrigeration 30, pp. 179-186.
Winandy E. and Lebrun J., 2002, Scroll compressors using gas and liquid injection: experimental analysis and modeling, Int. J. of. Refrigeration 25, pp. 1143- 1156.