STRUCTURAL BEHAVIOR OF CONCRETE COLUMNS UNDER
NATURAL FIRES INCLUDING COOLING DOWN PHASE
T. GERNAY*, M.S. DIMIA†
* The National Fund for Scientific Research, Belgium Department of Structural Engineering, University of Liege Chemin des Chevreuils, 1 – Bat. B52/3 – 4000 Liege, Belgium
E-mail: [email protected]
†
Department of Civil Engineering University of Batna, Algeria
E-mail: [email protected]
Key words: Concrete columns, Natural fire, Constitutive model, Transient creep.
Summary. This study deals with the structural behavior of concrete columns subjected to
natural fire, with special focus on the cooling down phase. As the reliability of the numerical simulations largely depends on the validity of the constitutive models that are used, this issue is addressed in details in the first part of the paper. It is found that the current concrete model of Eurocode may not be adapted for representing the behavior of concrete during a cooling phase because the effects of transient creep are incorporated implicitly in the mechanical strain term. A formulation of the Eurocode concrete model that contains an explicit term for transient creep strain has been developed and, after implementation in the software SAFIR, it was used for the numerical simulations presented in this paper. In its second part, the study gives an insight into the possibility of collapse of reinforced concrete columns during and after the cooling phase of the natural fire. It is found that failure during the cooling phase of a fire is a possible event and, more dangerous, that a failure of the concrete columns is still possible when the fire has been completely extinguished. The main mechanisms that lead to this type of failure are found to be the delayed increase of temperature in the central zones of the element and the additional loss of concrete strength during the cooling phase of the fire. A parametric study shows that the most critical situations with respect to delayed failure arise for short fires and for columns with low slenderness or massive sections. The numerical analyses have been performed also with the concrete model of Eurocode and the results also show a risk of delayed collapse. Yet, the occurrence of collapse during or after the cooling phase is predicted more often with the explicit creep model than with the implicit model of Eurocode, which suggests that the way the transient creep effects are handled in the Eurocode model may lead to unsafe results when considering the cooling phase of a fire.
1 INTRODUCTION
of this discipline. The numerical analysis of a structure subjected to fire is usually divided into three parts: first, the evolution of the gas temperature in the compartment is established; secondly, the thermal analysis is conducted to determine the temperature distribution in the structural member sections; thirdly, the mechanical analysis is conducted to assess the behavior of the structure subjected to elevated temperatures.
In the prescriptive approach, the time-temperature curves that are used are taken from design codes such as Eurocode (ISO834 standard fire)1 or ASTM (ASTM E119 standard fire)2. As the temperature of these standard fires is continuously increasing, the temperatures in the element are also continuously increasing and the load bearing capacity of the structure is continuously decreasing. As a consequence, verification of the structure at the required fire duration guarantees stability at any previous instant in the fire.
Recently, the research for achieving fire safety through alternative, cost effective solutions has lead to an increased use of performance-based approach for fire safety design3. If the behavior of a structure or structural element is assessed in a performance based environment, a more realistic representation of the fire will be used that comprises not only a heating phase but also a cooling phase during which the temperature of the fire is decreasing back to ambient temperature. When a realistic fire scenario is considered, the required duration of stability may be longer than the duration of the heating phase; it may even be required that the structure survives the total duration of the fire until complete burnout. However, verification of the structure in the load domain at the time of maximum gas temperature does not guarantee against collapse at a later stage. The load bearing capacity of the structure continues decreasing after the moment of maximum gas temperature, will reach a minimum value and eventually may recover partially or completely when the temperatures in the structure are back to ambient. For the designer, this implies that verification must be performed in the time domain by a step-by-step iterative method.
The continuation of degradation of the load bearing capacity after the moment of maximum gas temperature is due to two main reasons.
Firstly, the temperatures in the structure may continue increasing while the gas temperature is decreasing. For an unprotected steel structure, this will be the case until the gas temperature has become lower than the steel temperature. For a thermally protected steel structure, the increase of steel temperature will continue for a longer time due to the inertia of the insulation. For a concrete structure, the zones of the members that are near the surface will exhibit a decrease soon after the gas temperature has become lower than the surface temperature but the central zones may have their temperature still increasing for a significant duration, all the more if the section is massive.
The second reason is to be found in the material behavior. While steel recovers strength and stiffness as soon as its temperature decreases, completely or partially depending on the type of steel and the maximum reached temperature4, concrete remains severely damaged after cooling. Not only doesn't concrete recover its strength, but some indications exist that tend to prove that there is an additional loss of strength during cooling from maximum temperature to ambient5.
The delayed increase of temperature in the structure, the irrecoverable damage of heated concrete and the additional loss of concrete strength during cooling imply that there may be a risk of delayed collapse for concrete structures subjected to natural fire. Some authors have
been interested in the residual load bearing capacity of structural elements after exposure to fire, for example Hsu et al.6 for reinforced concrete beams. However, no study has been performed, to the authors’ knowledge, on the risk of collapse during the cooling phase of a fire.
For the fire fighters, the possibility of collapse occurring after the time of maximum gas temperature, if confirmed, might be a real threat. The intervention of fire fighting forces will usually lead to a decrease of the fire temperatures and, if collapse occurs during this phase, it may be at a time when fire brigades are in or at near vicinity of the fire compartment and they may be endangered by the collapse. Collapse during the beginning of the cooling phase of a fire occurred, for example, in a full scale fire test conducted in 2008 by Wald7 in the Czech Republic. The composite steel concrete floor working in tensile membrane action collapsed briefly after the wood based natural fire entered in the cooling phase and one of the possible failure modes that are suspected is by failure of the concrete compression ring that was established in the slab.
A structural failure that would occur at a later stage, when the temperatures in the compartment are back to ambient, may be an even higher threat because it would occur at the time of first inspection, not only by the fire brigades but also possibly by other people. Such a tragic incident occurred in Switzerland in 2004 when seven members of a fire brigade were killed by the sudden collapse of the concrete structure in an underground car park in which they were present after having successfully fought the fire8.
These events show the need to conduct detailed studies on the risk of delayed collapse of structures in natural fire. The evolution of material properties in the cooling phase must be available to perform such analysis. The authors’ previous work on the subject has lead them to the conclusion that, for concentrically loaded simply supported concrete columns heated on three sides, a delayed collapse is a possible event9. This previous work was conducted using the generic constitutive models of Eurocode for steel and for concrete, for the reason that these models are widely accepted by the scientific community and typically used for structural analyses. By using the same models as others use in their structural analyses, the authors could not be blamed for having chosen the particular material models that suit their needs. Still, a very strong assumption of the concrete constitutive model of the Eurocode10 is that the effects of transient creep can be incorporated implicitly in the mechanical strain term. Although this assumption has proven to yield quite accurate results in structures heated by a standard time-temperature curve, its validity for representing the behavior of concrete during a cooling phase may be questioned because transient creep is, in nature, not reversible. In the present work, the authors have chosen to use a concrete model that includes explicitly a term for transient creep strain; the description and the validation of the model are given in Section 3 of the paper.
2 OBJECTIVE OF THE RESEARCH
The objective of this research was to conduct numerical analyses of reinforced concrete columns subjected to natural fires in order to verify that the possibility of structural collapse during or after the cooling phase is real and, if so, what the parameters and conditions are that more likely lead to this undesirable behavior. Reinforced concrete elements were chosen
because the two reasons that explain why the load bearing capacity may continue decreasing after peak gas temperature indicate that concrete structures are more prone to this phenomenon than steel structures.
The validity of the constitutive models that are used for steel and concrete is of special importance since these models are the key for the reliability of all the numerical simulations. Recent research on concrete modelling by the first author tend to show that the way the phenomenon of transient creep is handled in the concrete material model may have a significant effect on the predicted structural behavior of reinforced concrete columns during the cooling phase11,12. As a consequence, the present research gives an insight into the concrete constitutive model to be used in numerical simulations including the cooling down phase.
3 MATERIAL MODELS 3.1 Thermal models
The thermal properties of steel and concrete in the heating phase were taken from EN 1994-1-213. Siliceous concrete was chosen, with a density of 2400 kg/m³ and a water content of 46 kg/m³. The emissivity was taken as 0.7 and the coefficient of convection was 35 W/m²K.
Thermal properties of steel were considered as fully reversible during cooling.
The specific mass of concrete, which decreases during heating because of the release of water, has been considered as constant during cooling, with a value that corresponds to the one of the maximum temperature. When the temperature increases in the concrete, the thermal conductivity has a tendency to decrease13. It has been considered that the decrease of thermal conductivity is not reversible and, during cooling, the thermal conductivity of concrete keeps the value corresponding to the maximum temperature.
3.2 Mechanical models
The mechanical properties of the steel reinforcing bars have been considered as reversible, which means that stiffness and strength are recovered to full initial values during cooling. In the thermal elongation curve, the plateau corresponding to the phase change that occurs around 800°C at a level of 11 x 10-3 during heating occurs at slightly lower temperatures, around 700°C, at a level of 9 x 10⁻³ during cooling. When steel is back to ambient temperature, there is no residual thermal expansion.
For concrete, a residual thermal expansion or shrinkage has been considered when the concrete is back to ambient temperature. The value of the residual value is a function of the maximum temperature and is taken from experimental tests made by Schneider14.
Compressive strength of concrete does not recover during cooling. According to EN 1994-1-2, an additional loss of 10% has been considered during cooling. This means that, for example, if the compressive strength has decreased from 1,00 to 0,50 at a given temperature, it will decrease to 0,45 when cooling back to ambient temperature. This assumption is of course the key for all the predictions presented in this paper and thus the reliability of the conclusions. In a recent paper, Yi-Hai and Franssen15 have shown, from the analysis of
hundreds of experimental results reported in the literature, that the additional reduction during cooling may be even higher than the 10% reduction considered in Eurocode 4. In the stress-strain relationship of concrete, the stress-strain corresponding to the peak stress was considered during cooling as fixed to the value that prevailed at the maximum temperature16. This hypothesis is also present on Fig. C.2 of Eurocode 413.
In concrete, transient creep strain develops irrecoverably during first-time heating of concrete under load, compared to concrete loaded at elevated temperature17. This strain has to be considered in any fire analysis involving concrete in compression18,19. The effect of not including transient creep strain in a full stress-strain model can be shown to produce erroneous unsafe results for the behavior of columns heated in three sides, thus inducing a thermal moment, in fire20, although the effect may be exacerbated due to the coexistence of thermal and moment gradient. Concrete constitutive models have been proposed that contain an explicit term for transient creep in the strain decomposition; other models incorporate the effects of transient creep implicitly in the mechanical strain term. In this paper, the former are referred to as “explicit models” whereas the latter are referred to as “implicit models”. Typical examples of explicit models include the models by Anderberg17, Schneider14 or Terro21. On the contrary, the concrete model of Eurocode10 is an implicit model.
Implicit models have proved to yield quite accurate results in structures heated by a standard time-temperature curve, but their validity for representing the behavior of concrete during a cooling phase may be questioned because transient creep is, in nature, not reversible. Law et al. 22 have recently shown that considering the transient creep term implicitly can have important implications on the Young modulus calculation of concrete during cooling. The structural response that is computed during cooling can be significantly different using an explicit or an implicit model of transient creep strain because the transient creep strain that is considered in implicit models is recovered during cooling, whereas it is not recovered when using explicit models. Numerical simulations on reinforced concrete columns subjected to natural fire and comparison against experimental data have shown that the computed response during cooling captures better the experimental behavior with an explicit model than with an implicit model of transient creep strain11,12. As a consequence, in this study it was decided to use a new formulation of the Eurocode model that contains an explicit term for transient creep strain. The objective when developing this model was to benefit from the capabilities of explicit models while keeping the generic formulation of the Eurocode. The model was implemented in the nonlinear software SAFIR and used for the numerical simulations.
3.3 Formulation of the Explicit Transient Creep Eurocode model for concrete
In implicit models, the total strain εtot is considered as the sum of free thermal strain εth, mechanical strain εm, and possibly basic creep strain εcr:
(
)
tot th m cr
ε
=ε
+ε
+ε
(1)Basic creep, defined as the strain that develops when only time is changing with all other conditions such as stress and temperature being constant, is generally omitted for the structural calculation of building structures in the fire situation19. The concrete mechanical
model of Eurocode (EC2 model) gives the following direct relationship at a given temperature
T between the stress σ and the mechanical strain εm for the ascending branch:
(
)
(
3)
1, 2 1, 2 3 ( ) ( ) 2 ( ) m c c EC m c EC f T T Tε
σ
ε
ε ε
= + (2)where fc is the concrete compressive strength and εc1,EC2 is the peak stress strain (PSS). In the relationship of Eq. (2), the value of the PSS accounts for the transient creep strain.
In explicit models, the mechanical strain is split into instantaneous stress-related strain εσ (ISS) and transient creep strain εtr, leading to the expression of Eq. (3) for the total strain:
(
)
tot th σ tr cr
ε
=ε
+ε
+ε
+ε
(3)The model that was chosen for the present study is the Explicit Transient Creep (ETC) Eurocode model developed by the first author12. This model is derived from the Eurocode model but the mechanical strain term has been split into the two components considered by explicit models. The main assumption of the ETC model is that it is calibrated to yield the same mechanical strain as the Eurocode model for a material first-time heated under constant stress (i.e. transient test), which can be expressed by Eq. (4):
EC2 ETC ETC
m σ tr
ε
=ε
+ε
(4)In the ETC model, it is assumed, as in many of the explicit models developed in the literature14,17,21, that the transient creep strain is linearly proportional to the applied stress and increases with temperature but not linearly. The transient creep strain is thus given by a relationship of the form Eq. (5):
ETC ( ) tr ck T f σ ε =φ × (5)
where Φ(T) is a nonlinear function of temperature and fck is the compressive strength at 20°C. By replacing in Eq. (4) the terms
ε
mEC2 andε
trETC by their expressions in Eq. (2) and Eq. (5) respectively, the relationship between the ISSε
σETC and the stress σ can be found. The parameters that appear in this relationship are all given in the Eurocode except for the function Φ(T). As a consequence, the function Φ(T) can be derived to calibrate the relationshipσ ε
− σETC on the experimental response of the concrete material subjected to steady-state tests. This leads to the following expression of Φ(T):( )
2(
1,(
2 1,min)
)
3 c EC c c ck T f f ε ε φ = − (6)where εc1,min is the minimum value of the PSS given in the ENV code23. The function Φ(T) is a growing function of temperature that is not reversible during cooling.
approximated by a direct relationship with the same generic form as the current EC2 model, for the sake of convenience:
(
)
(
)
ETC ETC 2 1,ETC 1,ETC 2 ( ) ( ) 1 ( ) c c c f T T T σ σε
σ
ε
ε
ε
= + (7)where
ε
c1,ETC is the peak stress strain for the ETC relationship, given by Eq. (8):(
)
1,ETC 2 1,min 1,EC2 3
c c c
ε
=ε
+ε
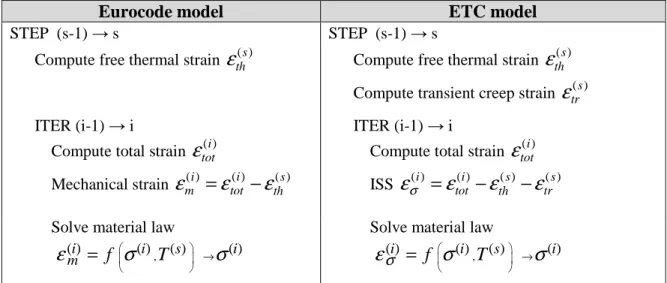
(8)The presented ETC model has been implemented in the nonlinear software SAFIR, developed at University of Liege24. The procedure of the finite elements calculation method for the ETC concrete model slightly differs from the procedure for the concrete model of Eurocode. In both cases, the free thermal strain is calculated at the beginning of each time step, as a function of temperature, and it does not vary during a time step. When entering into the material law during the iterative resolution of the equilibrium, the free thermal strain is subtracted to the total strain. In the current approach of Eurocode, the material law is written in terms of the mechanical strain, see Eq. (2). However, in the ETC model, the transient creep strain is calculated separately at the beginning of each time step, simultaneously as the free thermal strain. Then, the free thermal strain and the transient creep strain are subtracted to the total strain when entering into the material law, which is written in terms of the instantaneous stress-related strain, see Eq. (7). The difference between the computation processes of the two models is illustrated in Table 1.
Eurocode model ETC model
STEP (s-1) → s STEP (s-1) → s
Compute free thermal strain
ε
th( )s Compute free thermal strainε
th( )s Compute transient creep strainε
tr( )sITER (i-1) → i ITER (i-1) → i
Compute total strain
ε
tot( )iMechanical strain
ε
m( )i=
ε
tot( )i−
ε
th( )sCompute total strain
ε
tot( )i ISSε
σ( )i=
ε
tot( )i−
ε
th( )s−
ε
tr( )s Solve material law, ( )i ( )i ( )s ( )i m f T
ε
σ
σ
→ =Solve material law
, ( )i f ( )i T( )s ( )i σ
ε
σ
σ
→ =In the ETC model, the transient creep strain is calculated as a function of the stress at the previous time step, to avoid an iterative process in the calculation of the transient creep strain. The incremental calculation of transient creep strain takes into account the stress-temperature history. Between step (s-1) and step (s), if the temperature has increased, the increment in transient creep strain is calculated by the following expression:
( ) ( )
( ) ( 1)(
(s 1))
ck s s trT
T
σ
fε
φ
φ
− − ∆
=
−
(10)where
σ
(s−1) is the compressive stress at the previous (converged) time step. If the temperature has decreased or remained constant between step (s) and step (s-1), there is no variation of transient creep strain. As the function Φ(T) is growing with temperature, the transient creep term can only increase. Note that it is assumed that the transient creep strain is the same for loading and unloading as long as the stress is in compression19. In tension, it has been assumed that there is no transient creep strain.3.4 Validation of the ETC concrete model
Several experimental tests made on reinforced concrete columns subjected to natural fire have been modeled using the ETC model and the EC2 model. The results have been presented in two papers12,25. During the cooling phase, the numerical simulations performed with the ETC model match better the experimental behavior of the structure than the simulations performed with the EC2 model, because the transient creep strain that is explicitly computed in the ETC model is not recovered during cooling.
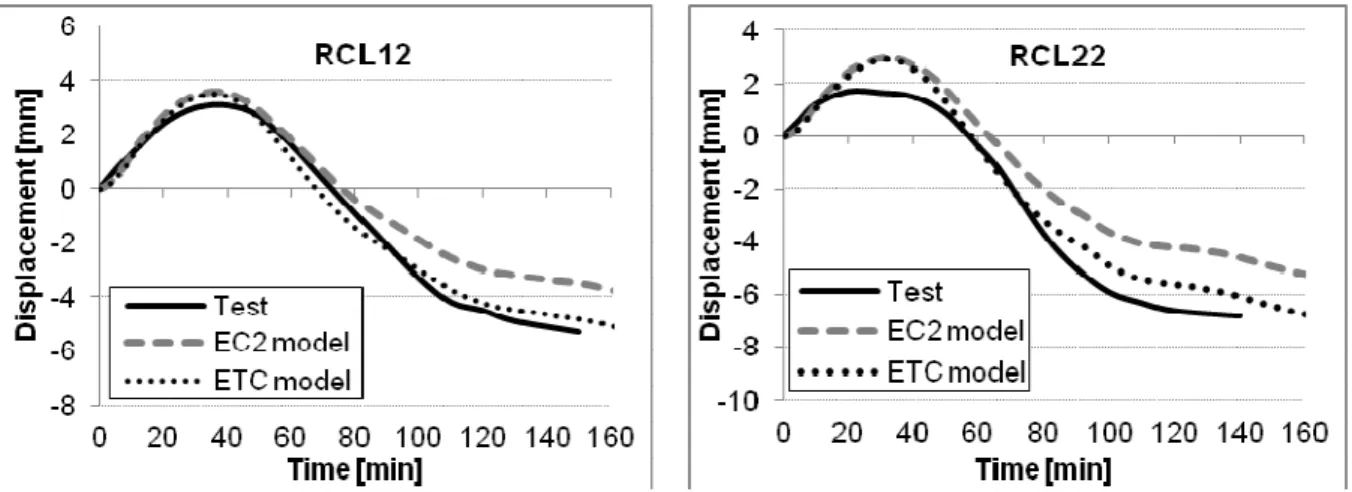
Fig. 1: Comparison between measured and computed results of the displacement at the top of the columns
As an example, two experimental fire tests made at South China University of Technology on axially restrained concrete columns26 have been simulated with the software SAFIR using the EC2 and the ETC concrete models. The computed displacement at the top of the column is plotted versus time on Figure 1, next to the experimental results. The columns were axially restrained (axial restraint of 51.9 MN/m) using a restraining beam. The columns were initially concentrically loaded with a load of 285 kN (RCL12) and 380 kN (RCL22) and then
subjected to ISO834 standard fire on all sides. The fire was stopped when approximately 50% of the working load was transferred from the column to the restraining beam, i.e. after approximately 95 minutes, followed by a cooling phase. Thermal parameters for concrete and steel recommended by EC2 were used in the heat transfer analysis by SAFIR. As can be seen in Figure 1, the ETC and the EC2 model lead to comparable results during the expanding phase of the column, but during the contracting phase the behaviors predicted by the two models tend to differ; the ETC model captures better the behavior of the column. The difference is particularly significant during the cooling phase.
4 ANALYSIS FOR REINFORCED CONCRETE COLUMNS
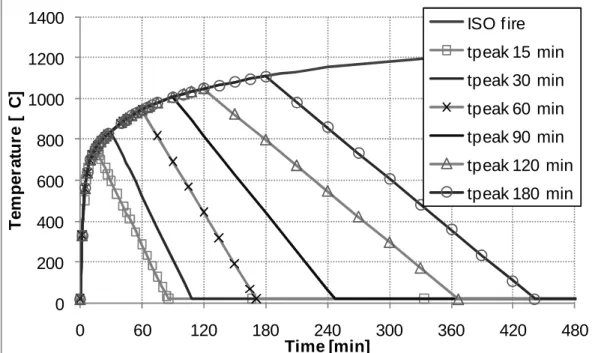
For the present analysis under natural fire, the time-temperature fire curves were taken from the parametric fire model of Annex A in Eurocode 127. The factor Γ that appears in Eq. (A.2a) of this document was given the value of 1.0, which makes the heating phase of the time-temperature curve of this natural fire model approximate the ISO834 standard curve. Figure 2 shows the different fire curves that were used, differing from each other by the duration of the heating phase, from 15 to 180 minutes.
In the discussion of the results, the following terms will be used:
Phase 1 is the heating phase of the fire, when the gas temperature is increasing from 20°C to the maximum temperature. The duration of phase 1 is tpeak;
Phase 2 is the cooling phase of the fire, when the gas temperature is decreasing from the maximum temperature to 20°C. The end of the phase 2 takes place at a time that is noted t20;
Phase 3 is the phase after the fire, when the gas temperature is back to 20°C.
0 200 400 600 800 1000 1200 1400 0 60 120 180 240 300 360 420 480 T e m p e ra tu re [ C ] Time [min] ISO f ire tpeak 15 min tpeak 30 min tpeak 60 min tpeak 90 min tpeak 120 min tpeak 180 min
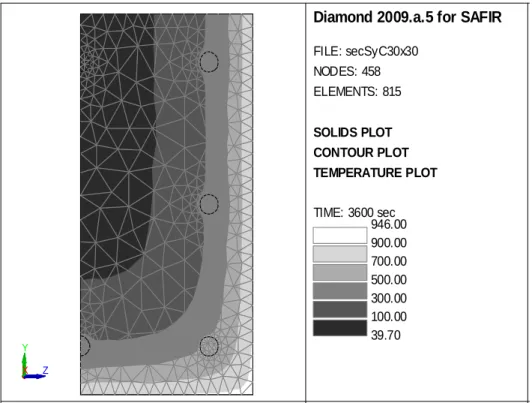
The analyses were performed on reinforced columns exposed to the fire on three sides, with the fourth side having adiabatic conditions. This may be representative of a column along the side wall of a building, with the fourth side protected from the effects of the fire by the façade. The non linear finite element software SAFIR24 was used. The temperature distribution in the sections was determined by 2D non linear transient analyses, see Figure 3. For the structural analysis, the columns were discretized longitudinally by means of Bernoulli beam type elements and the cross sections of the beam elements are divided in fibers that match the 2-D elements of the thermal analysis.
The section analyzed as the basic case has a 300 mm x 300 mm side section with 8 bars of 16 mm diameter and a concrete cover of 30 mm. The column is simply supported at both ends with a length of 4 m. Simply supported concrete columns are commonly found in one floor industrial or commercial buildings. A sinusoidal imperfection with maximum amplitude of L/300 has been introduced in the direction of the thermal gradient.
One of the objectives of the study is to give an insight on the parameters and conditions that are more likely to lead to a delayed collapse. The parameters that were considered in this study are:
1. The duration of the heating phase of the fire. 2. The effective length of the column.
3. The section of the column.
Besides these parameters, it was decided to analyze the influence of the concrete material model. The simulations were run using the ETC concrete model and the EC2 concrete model, and the results obtained with the two models have been compared.
X
Y
Z
Diamond 2009.a.5 for SAFIR
FILE: secSyC30x30 NODES: 458 ELEMENTS: 815 SOLIDS PLOT CONTOUR PLOT TEMPERATURE PLOT TIME: 3600 sec 946.00 900.00 700.00 500.00 300.00 100.00 39.70
5 RESULTS
5.1 Possibility of delayed collapse
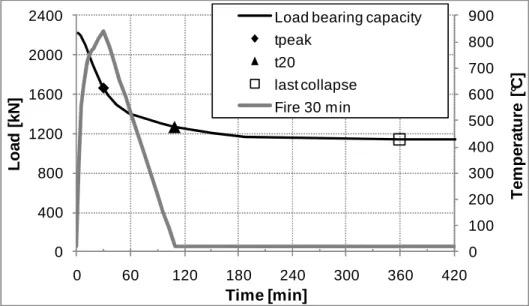
Figure 4 summarizes the results of the analysis performed on the basic case for a natural fire with duration of the heating phase of 30 minutes. The curve that gives the evolution of the load bearing capacity is the result of numerous simulations performed with different load levels. From the load bearing capacity at time t = 0, here 2220 kN, the load has been progressively reduced and numerous simulations have been performed, each one for a different load, yielding a fire resistance time that increases as the load is decreased. The obtained relationship between the applied load and the fire resistance time gives us the evolution of the load bearing capacity of the column. As can be seen, the load bearing capacity continues decreasing after the maximum gas temperature is reached in the compartment, which occurs at 30 minutes. In fact, even after the temperature in the compartment is back to 20°C (after 109 minutes), the load bearing capacity still slightly decreases.
The load that gives a fire resistance time equal to the duration of the heating phase tpeak is marked on the curve; this load is 1660 kN. If the load applied on the column is higher than 1660 kN, failure will occur during the heating phase of the fire. For loads lower than 1660 kN, failure of the column occurs in the cooling phase of the fire, at least when the load is higher than 1270 kN, the point noted as t20 on the curve. For loads lower than 1270 kN, collapse occurs in the phase 3 of the fire, when gas temperature is back to ambient. Collapse can occur as late as 360 minutes after the beginning of the fire, i.e. more than 4 hours after the end of the fire, for a load of 1140 kN. Any load lower than 1140 kN will not lead to the collapse of the column, which is marked by the fact that the curve has a horizontal asymptote. As a conclusion, the analysis shows that, for the basic case studied here, there is a significant range of the load that could lead to collapse of the column during or after the cooling phase.
0 100 200 300 400 500 600 700 800 900 0 400 800 1200 1600 2000 2400 0 60 120 180 240 300 360 420 T e m p e ra tu re [ °C ] L o a d [ k N ] Time [min]
Load bearing capacity tpeak
t20
last collapse Fire 30 min
5.2 Influence of the duration of the heating phase
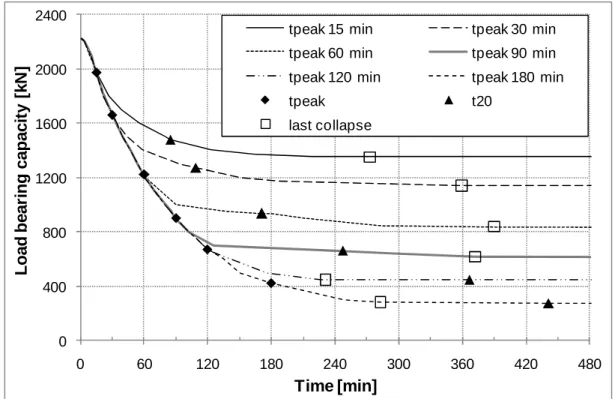
Figure 5 summarizes the analysis performed to examine the influence of the duration of the heating phase of the fire. Each curve on Figure 5 is related to one of the fires shown on Figure 2. Each of these curves allows us detecting whether there is a potential dangerous range of the load that could lead to collapse during or after the heating phase. If this is the case, the fact that delayed collapse will occur or not depend on the actual load level on the columns.
It can be seen that, for the curve marked as “tpeak 60 min” for example, if a column is subjected to a load of 970 kN, it will fail after 120 minutes, which is during the cooling phase. For the fire that has a heating phase of 180 minutes, any load higher than 422 kN will lead to collapse during the heating phase, i.e. in less than 180 minutes. If the load happen to be comprised between 422 and 281 kN, collapse will occur during the cooling phase. If the load is lower than 281 kN, there will be no collapse of the column and infinite stability is ensured; there is no possibility of collapse after the cooling phase for this fire duration.
It is thus possible, according to this model, to have in certain cases a structural collapse several hours after the end of the fire. According to Figure 5, this can occur only if the duration of the heating phase is not greater than 90 minutes. It can also be observed that the critical load range, i.e. the range of loads leading to a failure in phase 3 of the fire, is wider for short fires and decreases as the duration of the fire increases.
0 400 800 1200 1600 2000 2400 0 60 120 180 240 300 360 420 480 L o a d b e a ri n g c a p a c it y [ k N ] Time [min]
tpeak 15 min tpeak 30 min
tpeak 60 min tpeak 90 min
tpeak 120 min tpeak 180 min
tpeak t20
last collapse
Fig. 5: Evolution of the load bearing capacity for a column subjected to natural fires of different duration of heating phase
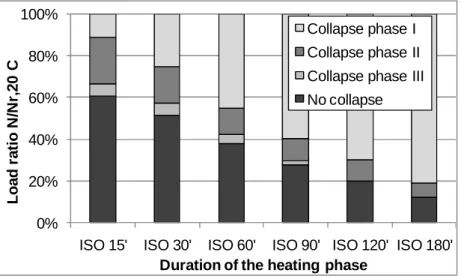
Figure 6 shows another presentation of the same results. On the horizontal axis is the duration of the heating phase of the fire whereas on the vertical axis is the applied load ratio on the column, with respect to the load bearing capacity at time t = 0 (2220 kN). Each bar of Figure 6 corresponds to one curve of Figure 5. Each bar is divided in maximum four parts. The part marked as “collapse phase I” represents the load ratios for which the collapse of the column arises during the heating phase. For example, for fire duration of 15 minutes, any load comprised between 1970 kN and 2220 kN will lead to collapse during the heating phase; these loads represent a ratio of 88.70% and 100% of the load bearing capacity at room temperature. The part marked as “collapse phase II” corresponds to the load ratios for which the collapse of the column arises during the cooling phase. The “no collapse” part is the region of the load ratios that does not lead to collapse at all. Finally, the “collapse phase III” part is the dangerous region of load ratios for which collapse can occur in phase 3, when the compartment is back to ambient temperature conditions. This part disappears for fire durations longer than 90 minutes. The fact that the part corresponding to the dangerous situation is so narrow explains why the ratio of structural collapse of buildings after the fire to that of the total number of building collapses is low. This is the possible consequence of this event, rather than the probability of occurrence, that lead to a significant risk.
0% 20% 40% 60% 80% 100%
ISO 15' ISO 30' ISO 60' ISO 90' ISO 120' ISO 180'
L o a d r a ti o N /N r, 2 0 C
Duration of the heating phase
Collapse phase I Collapse phase II Collapse phase III No collapse
Fig. 6: Influence of the duration of the heating phase on the possibility of delayed collapse
The fact that the occurrence of delayed collapse is higher for shorter fire than for fire with a long heating phase can be explained by the analysis of the evolution of the temperature in the concrete section. For the fire with a heating phase of 15 minutes and return to 20°C after 86 minutes, the analysis of the evolution of the temperature in the steel bars show that, in all bars, the temperature continues increasing for at least 30 minutes after the time of maximum gas temperature and, for the bar that is away from the heated surfaces, the temperature keeps on increasing significantly for more than 60 minutes after the end of the fire9. Similar behavior could be plotted for different points in the concrete material. This delayed temperature increase in the internal parts of the section, plus the additional 10% decrease in compressive strength when concrete cools down to ambient explain the delayed failures. For
the fire with a heating phase of 180 minutes and a return to ambient temperature after 441 minutes, the temperatures in all bars have almost reached their maximum value when the gas temperature is back to 20°C, at 441 minutes. This can explain why, in longer fires, there is no failure after the cooling phase of the fire because, if the temperature in the steel bars does not increase anymore after the end of the fire, their properties have started to recover while, in the concrete, most of the decrease of strength and stiffness has already developed.
5.3 Influence of the effective length of the column
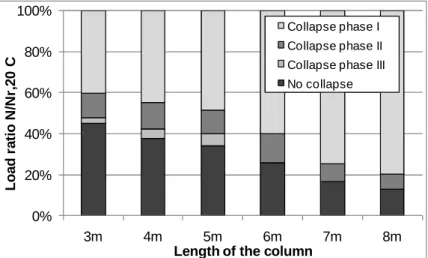
The analyses have been repeated for different length of the column and the results are summarized on Figure 7 for a heating phase that lasts for 60 minutes. Failures in the phase 3 of the fire are observed only in columns with a length of 5 meters or less. For longer columns, failure can be observed in the phase 2, the cooling phase, but the range of loads leading to collapse in the phase 2 reduces as the length of the column increases. For very long columns, nearly all failures are in the heating phase; if very long columns can survive to the heating phase of the fire, they are likely to survive indefinitely.
The most critical situations with respect to delayed failure arise for columns with low slenderness. This is due to the fact that, in columns with high slenderness, the displacement due to the thermal gradient (in one direction) is so important that the variation of position of the neutral axis (that develops in the other direction) is not sufficient to counteract the thermal curvature. As the eccentricity of the load is the difference between these two displacements, the lateral displacements of the column remain in the direction of the fire for column with high slenderness. In that case, as soon as the temperature decreases in the regions of the section near the fire, the severity of the thermal gradient decreases and so does the lateral displacement. The column is then more likely to survive, even if the strength and stiffness continue decreasing a little bit more in phase 2 and 3. This explains why longer column that survive to the heating phase are in a better position to survive also the cooling phase and, even more certainly, the phase 3 of the fire. On the contrary, in a short column, the eccentricity changes sign when the neutral axis moves and so do the displacements generated by the second order moments9.
0% 20% 40% 60% 80% 100% 3m 4m 5m 6m 7m 8m L o a d r a ti o N /N r, 2 0 C
Length of the column
Collapse phase I Collapse phase II Collapse phase III No collapse
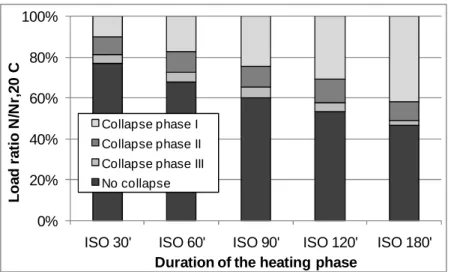
5.4 Influence of the section of the column
The analyses have been repeated for a 4 meters column with a section of 600x600 mm side containing 12 bars of 20 mm diameter with a concrete cover of 40 mm. The results are presented on Figure 8. Whereas failure in the phase 3 of the fire was observed only for relatively short fires when the 300x300 mm side section was considered, see Figure 6, delayed failures are observed here even for very long fires with a heating phase as long as 3 hours; the band of dangerous collapses in phase 3 extends towards fire durations of 180 minutes, for only 90 minutes with the smaller section. The range in loads leading to these failures after the fire is rather limited. For example, for the 120 minutes fire, failures after cooling can occur only if the load is between 5100 and 5500 kN, i.e. between load ratios of 53.5% and 57.7%. The dangerous range reduces as the duration of the fire increases. More critical is the fact that, if the load happens to be in the dangerous range, delayed failures can occur several hours after the end of the fire.
Two reasons can explain the higher sensitivity of wider sections to delayed failure. The first is linked to the fact that, if the length of the column remains constant, higher sections lead to lower slenderness, which have been identified as more critical in the previous section of this paper. The second reason may be traced to the fact that, in larger sections, the temperatures in central zones of the section keep on increasing long after the gas temperature is back to ambient, which is not the case for smaller sections. Delayed failures are thus strongly linked to the presence of a certain zone of the section in which the temperature continues to increase after the peak of the gas temperature.
0% 20% 40% 60% 80% 100%
ISO 30' ISO 60' ISO 90' ISO 120' ISO 180'
L o a d r a ti o N /N r, 2 0 C
Duration of the heating phase
Collapse phase I Collapse phase II Collapse phase III No collapse
Fig. 8: Influence of the duration of the heating phase on the possibility of delayed collapse for a 600x600 mm side section
5.5 Influence of the concrete material model
The simulations have been run again using the concrete model of Eurocode instead of the ETC concrete model. The aim was to analyze the sensibility of the results to the concrete mechanical model that is used in the numerical simulations. As the two concrete models that
determine whether the use of the simplified, implicit model of Eurocode instead of an explicit model such as the ETC model does or not lead to differences in the structural behavior of concrete columns.
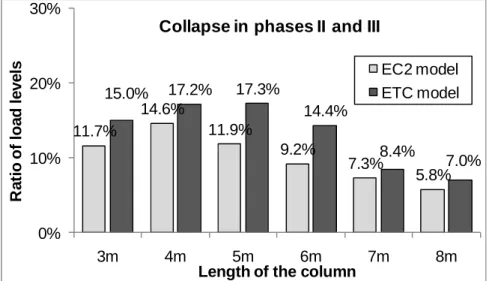
Figure 9 shows the results obtained for the 4 m length column with a section of 300x300 mm (basic case) subjected to natural fires with different duration of heating phase. This graph is another presentation of the results given in Figure 6 for the ETC model. The vertical axis of the graph represents the ratio of load levels that lead to collapse in phase 2 or in phase 3. For example, for fire duration of 30 minutes, the considered ratio of load levels is equal to 23.5% because any load comprised between 1140 kN (load level 51.3%) and 1660 kN (load level 74.8%) will lead to collapse during or after the cooling phase of the fire. Figure 10 summarizes the results obtained for different length of the column for a heating phase that lasts for 60 minutes.
26.2% 21.0% 14.6% 10.0% 7.3% 5.5% 27.9% 23.5% 17.2% 12.7% 10.0% 6.6% 0% 10% 20% 30% 40%
ISO 15' ISO 30' ISO 60' ISO 90' ISO 120' ISO 180'
R a ti o o f lo a d l e v e ls
Duration of the heating phase
Collapse in phases II and III
EC2 model ETC model
Fig. 9: Influence of the concrete material model on the risk of delayed collapse (1)
11.7% 14.6% 11.9% 9.2% 7.3% 5.8% 15.0% 17.2% 17.3% 14.4% 8.4% 7.0% 0% 10% 20% 30% 3m 4m 5m 6m 7m 8m R a ti o o f lo a d l e v e ls
Length of the column
Collapse in phases II and III
EC2 model ETC model
The results obtained when using the EC2 concrete model lead to the same conclusions as discussed previously on the basis of the results obtained with the ETC model. Although the tendencies are the same with the two models, the results are slightly different. The ratios of load levels that lead to delayed collapse is higher when the ETC model is used for the numerical analysis than when the EC2 model is used, for all the cases that have been considered in this study.
The concrete model has thus an influence on the results of the structural analysis of reinforced concrete columns subjected to natural fire. Using the concrete model of Eurocode may lead to unsafe results when analysing the structural behavior of reinforced concrete columns under natural fire as the occurrence of delayed collapse may be underestimated by comparison with the occurrence predicted with an explicit model. A constitutive model that contains an explicit term for transient creep strain should probably be preferred when modelling the cooling phase of a fire.
5.6 Fire Resistance (R) versus Duration of the Heating Phase (DHP)
The presented study has shown that, for columns subjected to natural fire, the collapse can occur after the time of maximum gas temperature. For a given concrete column loaded to a given load level, the fact that the collapse arises during the heating phase (phase I), during or after the cooling phase (phase II and phase III), or that the column survives indefinitely depends on the duration of the heating phase of the fire, see Figure 6. It is thus possible to define, for a structural element loaded to a given load level, the minimum exposure time to standard fire that will eventually result in a delayed collapse of this structural member. This minimum exposure time is denoted as duration of the heating phase (DHP) of the element. It should be noted that the collapse corresponding to the DHP of a structural element can arise long after the end of the fire.
0% 10% 20% 30% 40% 50% 60% 70% 80% 0 30 60 90 120 150 180 L o a d r a ti o N /N r, 2 0 C Time [min]
Duration of the heating phase Fire resistance time
Fig. 11: The minimum duration of the heating phase that eventually leads to a delayed collapse of the column is shorter than the fire resistance time
Figure 11 represents the fire resistance time curve and the DHP curve of the 4 m long column with a 300x300 mm side section considered in this study. For example, when loaded at 40% of its load bearing capacity at room temperature, the column is able to sustain the load during 92 minutes under standard ISO834 fire exposure; this is represented by the “fire resistance time” curve. However, any fire with a heating phase longer than 53 minutes followed by a cooling phase according to the parametric fire model of Annex A in Eurocode 1 will lead to the column collapse, as indicated by the DHP curve. The DHP curve gives no indication about the time at which collapse arises, but it tells us whether the fire exposure of the column will lead to a delayed collapse or not. Whereas the practical meaning of the fire resistance time is to guarantee certain period of time before a structure in fire collapses, the DHP aims to give an indication about the risk of delayed collapse of a structure as a function of the time when it was begun to fight the fire.
6 CONCLUSION
The numerical analysis of the structural behavior of concrete columns subjected to natural fire requires validated constitutive models for the steel and concrete materials. Whereas the concrete mechanical model of Eurocode has been widely used and accepted for prescriptive design, its validity for representing the behavior of concrete during a cooling phase may be questioned because the effects of transient creep are incorporated implicitly in the mechanical strain term of this model. A formulation of the Eurocode model that contains an explicit term for transient creep strain has been developed and implemented in the software SAFIR. This model captures better than the current Eurocode model the behavior of concrete structural elements during the cooling phase when compared against experimental data. Consequently, it was decided to use this explicit creep model for the analyses presented in this paper.
The numerical analyses undertaken here for concentrically loaded simply supported concrete columns heated on three sides show that a failure during the cooling phase of a fire is a possible event and, more dangerous, that a failure of the structure is still possible when the fire has been completely extinguished, in some cases several hours after conditions in the fire compartment have become tenable again and a first inspection of the building might be under way.
The main mechanisms for these delayed failures are to be found in the fact that temperatures in the central zones of the element can keep on increasing even after the gas temperature is back to ambient and also in the fact that concrete loses additional strength during cooling compared to the situation at maximum temperature. It has been shown that the most critical situations with respect to delayed failure arise for short fires and for columns with low slenderness (short length and/or massive section).
The concrete mechanical model that is used for the analysis has a significant importance on the results. By comparing the results obtained with the ETC and the implicit creep Eurocode concrete models, it can be seen that the occurrence of collapse during or after the cooling phase is predicted more often with the explicit creep model than with the implicit model of Eurocode. The assumption that consists in incorporating implicitly the effects of transient creep in the mechanical strain term, as in the Eurocode model, may thus lead to unsafe results when considering natural fire.
REFERENCES
[1] ISO 834, Fire Resistance Tests – Elements of Building Construction, International Organization for Standardization, Geneva, Switzerland (1975).
[2] ASTM E119-00, Standard Methods of Fire Test of Building Construction and Materials, American Society for Testing and Materials, West Conshohocken, PA, USA (2007). [3] B.J. Meacham and R.P.L. Custer, “Performance-based Fire Safety Engineering: An
Introduction of Basic Concepts”, J. Constr. Steel Res. Institute, Vol. 7, 35–54 (1992). [4] B.R. Kirby, D.G. Lapwood and G. Thomson, “The reinstatement of fire damaged steel
and Iron Framed Structures”, ISBN 0 900206 46 2 British Steel Corporation. Swinden Laboratories (1986).
[5] Y-H Li and J-M Franssen, “Residual compressive strength of concrete after a fire”,
Journal of Structural Fire Engineering, accepted for publication.
[6] J-H Hsu and C-S Lin, “Effect of fire on the residual mechanical properties and structural performance of reinforced concrete beams”, J. Fire Prot. Eng., 18 (4), 245-274 (2008). [7] F. Wald and P. Kallerova, “Draft Summary of Results from Fire Test in Mokrsko 2008”,
ISBN 978-8004267-0, Ceska technika, Prague (2009).
[8] Firehouse.com (2004). Seven Swiss Firefighters Die in Collapsed Parking Garage; Accessed 09/09/11, http://www.firehouse.com/news/lodd/seven-swiss-firefighters-die-collapsed-parking-garage.
[9] M.S. Dimia, M. Guenfoud, T. Gernay and J.-M. Franssen, “Collapse of concrete columns during and after the cooling phase of a fire”, J. Fire Prot. Eng, accepted for publication. [10] EN 1992-1-2. Eurocode 2: Design of concrete structures – Part 1-2: General rules –
Structural fire design, CEN, Brussels (2004).
[11] T. Gernay & J-M Franssen, “A Comparison Between Explicit and Implicit Modelling of Transient Creep Strain in Concrete Uniaxial Constitutive Relationships”, Proceedings of the Fire and Materials 2011 Conference, San Francisco, 405-416 (2011).
[12] T. Gernay, “Effect of Transient Creep Strain Model on the Behavior of Concrete Columns Subjected to Heating and Cooling”, Fire Technology, accepted for publication, DOI 10.1007/s10694-011-0222-0.
[13] EN 1994-1-2. Eurocode 4 – Design of composite steel and concrete structures. Part 1-2: General rules – Structural fire design, , CEN, Brussels (2005).
[14] U. Schneider, Properties of materials at high temperatures: Concrete. RILEM, U. Schneider ed., Univ. of Kassel (1985).
[15] L. Yi-Hai and J-M Franssen, “Test results and model for the residual compressive strength of concrete after a fire“, J. of Struct. Fire Eng., Vol. 2, 1, 29-44 (2011).
[16] R. Felicetti, P.G. Gambarova, M. Silva and M. Vimercati, “Thermal diffusivity and Residual Strength of High-Performance Light-Weight Concrete Exposed to High Temperature”, 6th Int. Symp. on Utilization of HSC/HPC, Leipzig, 935-948 (2002).
[17] Y. Anderberg and S. Thelandersson, “Stress and deformation characteristics of concrete at high temperatures: 2 experimental investigation and material behaviour model”, Bulletin 54, Lund Institute of Technology, Sweden (1976).
[18] G. Khoury, B. Grainger and P. Sullivan, “Transient thermal strain of concrete: literature review, conditions within specimen and behaviour of individual constituents”. Mag
Concr Res, 132, 131-144 (1985).
[19] L. Li and J. Purkiss, “Stress-strain constitutive equations of concrete material at elevated temperatures”, Fire Saf J, 40, 669-686 (2005).
[20] JA Purkiss, Fire safety engineering, design of structures, Oxford: Butterworth Heinemann (1996).
[21] M. Terro, “Numerical modelling of the behaviour of concrete structures in fire”, ACI
Structural Journal, 95, 183-193 (1998).
[22] A. Law and M. Gillie, “Load induced thermal strain: implications for structural behaviour”, Proc. of the 5th Int. Conf. on Structures in Fire, Singapore, 448-496 (2008).
[23] Eurocode 2: Design of concrete structures, Part 1-2: Structural fire design, European prestandard, Brussels (1995).
[24] J-M Franssen, “SAFIR, A thermal/Structural Program for Modeling Structures under Fire”, Eng J A.I.S.C., 42, 143-158 (2005).
[25] T. Gernay and J-M Franssen, “Consideration of Transient Creep in the Eurocode Constitutive Model for Concrete in the Fire situation”, Proc. of the 6th Int. Conf. Structures in Fire, 784-791 (2010).
[26] B. Wu, YH Li and SL Chen, “Effect of heating and cooling on axially restrained RC columns with special-shaped cross section”, Fire Technology, 46, 231-249 (2010).
[27] EN 1991-1-2. Eurocode 1: Actions on structures – Part 1-2: General actions – Actions on structures exposed to fire, CEN, Brussels, (2002).