HAL Id: hal-01257471
https://hal.inria.fr/hal-01257471
Submitted on 18 Jan 2016
HAL is a multi-disciplinary open access
archive for the deposit and dissemination of
sci-entific research documents, whether they are
pub-lished or not. The documents may come from
teaching and research institutions in France or
abroad, or from public or private research centers.
L’archive ouverte pluridisciplinaire HAL, est
destinée au dépôt et à la diffusion de documents
scientifiques de niveau recherche, publiés ou non,
émanant des établissements d’enseignement et de
recherche français ou étrangers, des laboratoires
publics ou privés.
Assessing the bus factor of Git repositories
Valerio Cosentino, Javier Cánovas Izquierdo, Jordi Cabot
To cite this version:
Valerio Cosentino, Javier Cánovas Izquierdo, Jordi Cabot. Assessing the bus factor of Git repositories.
22nd International Conference on Software Analysis, Evolution and Reengineering (SANER), 2015
IEEE, Mar 2015, Montreal, Canada. �10.1109/SANER.2015.7081864�. �hal-01257471�
Assessing the Bus Factor of Git Repositories
Valerio Cosentino, Javier Luis C´anovas Izquierdo, Jordi Cabot
AtlanMod team (Inria, Mines Nantes, LINA), Nantes, France
{valerio.cosentino, javier.canovas, jordi.cabot}@inria.fr
Abstract—Software development projects face a lot of risks(requirements inflation, poor scheduling, technical problems, etc.). Underestimating those risks may put in danger the project success. One of the most critical risks is the employee turnover, that is the risk of key personnel leaving the project. A good indicator to evaluate this risk is to measure the concentration of information in individual developers. This is also popularly known as the bus factor (“number of key developers who would need to be incapacitated, i.e. hit by a bus, to make a project unable to proceed”).
Despite the simplicity of the concept, calculating the actual bus factor for specific projects can quickly turn into an error-prone and time-consuming activity as soon as the size of the project and development team increase. In order to help project managers to assess the bus factor of their projects, in this paper we present a tool that, given a Git-based repository, automatically measures the bus factor for any file, directory and branch in the repository and for the project itself. You can also simulate with the tool what would happen to the project (e.g., which files would become orphans) if one or more developers disappeared.
I. INTRODUCTION
Software development projects are by nature risky. Ev-idences reported over time, e.g. [1], point out that a high percentage of software projects experience failures like cost or schedule overruns. Such failures are often related to un-derestimated risks that can range from personnel shortfall to developing the wrong functionalities [2].
This situation is only getting worse since complexity of software projects is increasing over time. As a response, risk management solutions [3] are being more and more put in place by companies in order to reduce project failures. Risk management relies on indicators that help to evaluate the risk of a given project property (cost, time, quality, etc.) [4]. To asses the employee turnover risk, that is the risk of key personnel leaving the project, a good indicator is the concentration of information in individual developers. This is also popularly known as the bus factor [5] (“number of key developers who would need to be incapacitated, i.e. hit by a bus, to send the project into such disarray that it would not be able to proceed”) 1. A low bus factor means that the risk
is high since the information/knowledge is held only by few developers. In the worst case scenario, only one of them holds key knowledge of important components of the project, making his presence a single factor that could make the project fail. On the other hand, a high bus factor means that the risk for the project is low since many developers know enough to carry on in the case some of them would quit the project (dramatically or not).
1Note that there exist different alias for the term bus factor. It is also known
as truck factor, bus/truck number or lottery factor.
Even though the concerns about shared project knowledge are raising and we see more and more development prac-tices (like pair programming, code review sessions and cross-training) aimed to increase the shared knowledge within the development team [6], and therefore, its bus factor, assessing the actual bus factor for a project can turn into a time-consuming and error-prone activity for any non-trivial project. For instance, a project manager can have a hard time to understand who keeps the key knowledge to maintain a source code file that has been modified several times.
In order to ease the assessment of the bus factor, we present a tool2 that automatically calculates such indicator for any software development project relying on a Git [7] software repository. The tool provides bus factor information for any file, directory, branch and file extension in the Git repository, highlighting the key (i.e., most knowledgeable) developers for each of them and for the project itself. In addition, the tool allows to simulate the impact of one or more developers leaving the project, showing the file, directories, branches and file extensions that would be affected if they disappeared.
The bus factor indicator is related to the concept of code ownership ([8], [9]) in collaborative software development. Nevertheless, beyond potentially sharing an initial step to identify developers with certain knowledge on an artifact, the way this information is used is significantly different since our goal is to minimize the employee turnover risk and not to recommend people that could have some expertise on the topic/technology of a given artifact.
The work in [10] was the first to propose an algorithm to measure the bus factor by using information about code ownership derived from a code repository. However, the au-thors calculates the bus factor according to the files modified in commits and they rely on the assumption that all the developers that have made at least a commit on a file, have the same knowledge of that file. The work presented in [11] provides an implementation of [10] for SVN repositories, however, it also lacks of support for filtering the files to analyse, merging the activities of developers that use several accounts, or tuning the file coverage threshold to make a developer be part of the corresponding bus factor.
The remainder of the paper is organized as follows. Section II describes the process we follow to calculate the bus factor, Section III presents the tool architecture and its functionalities, Section IV reports on the evaluation of our tool and finally Section V ends the paper.
Git repo Bus factor assessment Tuner Visualization File analyzer Dev. knowledge calculation Key Dev. identification
Fig. 1: Process overview.
II. PROCESSDESCRIPTION
The bus factor indicator is conceptually simple to under-stand but there is no formal definition that can be used to calculate it. Therefore, this section presents our own pro-posal to compute it. The process can be parameterized at several points so that companies can tailor it to their needs. For instance, some companies may be more risk-averse and therefore opt to require stronger conditions for a developer to be considered part of the bus factor (resulting in a lower bus factor, and thus, in a more conservative risk evaluation that could trigger countermeasures early on) while others may be happy accepting a higher risk and consider that even developers with little knowledge on a file would be able to take it over if the situation requires so.
The process we follow to assess the bus factor for a given Git repository is shown in Fig. 1. It is composed of 6 steps, respectively File analysis, Developer Knowledge calculation, Key developers identification, Tuner, Bus factor assessment and Visualization. They are described in the remainder of this section.
A. File Analysis
This step is used to retrieve all information regarding who (and when) modified each file in the repository. It starts by examining the commits in each branch of the repository. For each commit, it collects the author name, the time when the commit was pushed and the information related to the affected (i.e., modified, added, renamed, deleted) files. For binary files (e.g., images, executable files), the process collects only the change event type. For text files (source files, configuration files, documentation, etc.), it goes one step further and collects the previous information at the line level. Regular expressions are used to identify the addition and deletion symbols in the diffinformation with respect to the previous version of the file. Besides, for each file, the process also records the number of times it has been included in a commit, the branch and directories in which is contained, its file extension and the history of the file to check whether the file has been renamed or moved across the repository. If so, the process recursively finds and groups together all the corresponding previous versions. B. Calculating the Developer’s Knowledge
Based on the file information, this step assigns a percentage value of knowledge for that file to each developer in the project. This value is then propagated to assign a knowledge percentage to the developer for each directory, branch and the project itself. As an auxiliary value, this is also aggregated at the file extension level. This propagation is performed by simply adding up the knowledge on individual files and
scaling the results based on the number of files in that directory/branch/project. This ensures that developers with a little bit of knowledge on many files are still represented in the knowledge chart for the, for instance, directory where those files are located. The resulting knowledge value will be the basis of the bus factor assessment calculation for the different artifacts in the project, as described in the next section.
The developer’s knowledge on a file is measured according to one of the four different metrics described in what follows. It’s up to the organization to choose which one it prefers, also based on their typical development method (e.g., in terms of the frequency and size of commits). All metrics play with the information of the file modifications aggregated in the previous step, again, either at the file level, based on the number and order of modifications each developer made on the file [?], or the line level, based on the number and order of modifications on each line ([8], [12]) later summed up and scaled to a percentage value to get the corresponding developer knowledge at the file level.
Metrics
The metrics differ on how they combine the importance of the number and order of modifications to assign the knowledge value (e.g., is the last developer to modify a file more knowl-edgeable than the former ones?). We explain the four metrics (for the case of text files) using as illustrative example the following scenario. Let A, B and C be 3 users that modified a file f, composed of two lines. The history of the modifications on such lines are:
A → B → A → B → B → C (1) A → B → A → C → B → C (2) 1) M1 - Last change takes it all: This metric assigns all knowledge of a line/file to the last developer that modified that line (or file for binary files). Thus, in the example C would be assigned 100% of the knowledge for the two lines, and consequently 100% of f.
2) M2 - Multiple changes equally considered: This metric counts the number of times a line has been modified during the life-cycle of the project. It assigns more knowledge to the developers that modified the line/file most times. Therefore, with this metric, the result can be biased towards people with a coding style using smaller but more frequent commits.
Applying this metric to our example would give, for line 1: A knows 33,3% (2/6), B knows 50% and C the remaining 16,7% while for line 2, A, B and C get 33,3% each. Thus, the overall knowledge of f for B is 41,7% (83,3/200), for A is 33,3% and for C is 25%.
3) M3 - Non-consecutive changes: In order to balance the effect of multiple changes on a line, this metric assesses the developer knowledge according to the number of non-consecutive changes on the line. By applying this metric, the modifications on line 2 do not change, but those ones on line 1 would now look like:
since the two consecutive changes by B are merged and counted as one.
Thus, the result of this metric for line 1 is: A and B know the 40% of it and C the rest; while for line 2 the result is the same as before. The knowledge of f is then shared according to the following proportions: A and B know 36,7% each while C 26,6%. Note that, with this metric, the knowledge of f for B has decreased with respect to the previous metric.
4) M4 - Weighted non-consecutive changes: This metric assesses the developer knowledge by relying of the previous metric modified to take into account the position of the modifications in the time-line evolution of the line. It is used to assign an incremental importance to the later modifications on the line. By applying this metric, the modifications for the two lines are transformed into:
A ∗ 1 → B ∗ 2 → A ∗ 3 → B ∗ 4 → C ∗ 5 A ∗ 1 → B ∗ 2 → A ∗ 3 → C ∗ 4 → B ∗ 5 → C ∗ 6 The result of this metric for line 1 is: A knows 33,3% (4/15), B 40% and C 26,7%. On the contrary, for line 2, A knows 19%, B 33,3% and C 47,7%. Thus, C knows 37,1%, B 36,7% and A 26,2% of f.
C. Key developer identification
This step identifies the developers that have enough knowl-edge (as calculated on the previous section) on any given software artifact to be part of the bus factor since any of them, if “surviving”, would be able to keep working of the artifact. Again, how much knowledge is enough to be the sole responsible developer to take over an artifact if needed (con-dition to be included in the bus factor, remember that a bus factor of three means that if the three developers are hit by a bus the project fails but if only two of them are hit the last one knows enough to continue) has no unique answer. As before, we provide a flexible formula that can be easily adapted to represent different situations, for instance, you can represent with it that a fixed minimum threshold of knowledge automatically puts you in the bus factor or more complex situations in which the top developers (relative to the total number of developers involved in the file) are selected.
Our formula has two different components to give more flexibility to the calculation process. We first calculate the primary key developers and then the secondary ones. Their sum gives the bus factor for the artifact. Primary developers are those that have modified a minimum percentage X of the artifact. Secondary developers know at least a subset Y of X. By default (and based on our own experience), X is set to 1/N where N is the overall number of developers that have ever modified the artifact and Y is set to half of X.
For instance, given 4 users A, B, C, D that hold a knowledge of the file f of 36%, 32%, 20% and 12% respectively, with our default settings A and B would be classified as the primary developers since they know more than 25% (1/4) of f while Cwould be considered a secondary developer due to knowing more than half of the threshold for the primary developers. Instead D is not part of the bus factor, giving a total bus factor
of three (meaning that if at least A, B or C continue in the project, it can go on, if only D is there, the project will fail since D doesn’t know enough about f).
D. Tuner
This step is used to tune the bus factor analysis. In particular, it allows the user to 1) control the resources and the developers to be analyzed and 2) parameterize the computation choosing the metric and the values for the bus factor formula. The second part is based on what we have previously explained so we won’t repeat it here. Regarding 1), the tuner allows users to filter out some files/directories/branches from the analysis (e.g., to focus only on source code files and remove libraries and other components), choose the granularity of the analysis (file or line-level) and group developers either to merge different user names corresponding to the same physical person or to calculate the bus factor at the development sub-team level by merging all developers in the same sub-sub-team. E. Bus factor assessment
The whole process is repeated at each level of the project to assign a bus factor to each file, directory, branch, file extension and the project itself. Note that the way the bus factor is calculated a given developer could be part of the bus factor of a file but not of the directory where that file is included. That is, she could be a key developer to maintain the file but if she leaves the project, the project itself could survive (even if maybe that file needs to be rewritten from scratch if its bus factor was 1 and therefore nobody else can take over it). F. Visualization
This step depicts the bus factor with a graphical visualiza-tion. It shows the bus factor for each file, directory, branch, file extension and for the project itself. It provides a short summary (e.g., number of contributors, most used file extensions, etc.) of the project as well as the list of developers (i.e., primary and secondary ones and the rest) contributing the repository with their corresponding knowledge. See Figure 4 as an example.
III. TOOLDETAILS
This section gives some details about the tool. We first describe the tool architecture and then its main function-alities. To facilitate the visualization of the tool results, a live demo for a project called GiLA is available online at http://youtu.be/fo9qy0ksX0Q.
A. Tool Architecture
The tool3 relies on different technologies. The bus factor calculation is done by a script in Python that uses the version 0.3.1 of the library GitPython4 to analyse the repository. The output of the tool is a JSON file, that is exploited with JavaScript to visualize the bus factor information in a web-page.
The tool takes as input parameters a Git repository plus the additional parameters that are used to tune the bus factor
3The tool can be downloaded at https://github.com/atlanmod/busfactor 4http://pythonhosted.org/GitPython/0.3.1/
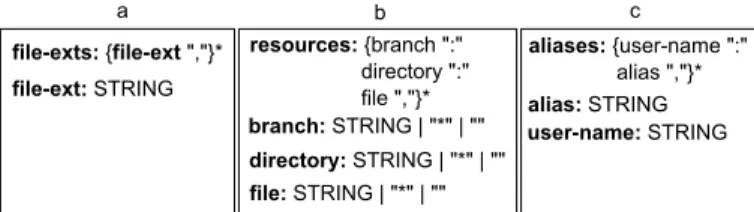
a file-ext: STRING file-exts: {file-ext ","}* b resources: {branch ":" directory ":" file ","}* branch: STRING | "*" | "" directory: STRING | "*" | "" file: STRING | "*" | "" c user-name: STRING aliases: {user-name ":" alias ","}* alias: STRING
Fig. 2: Structures of the files used to parameterize the tool
analysis as mentioned in Section II-D. The information about the elements to filter out from the analysis are given via three files following the structure shown in Fig. 2.
B. Tool Functionalities
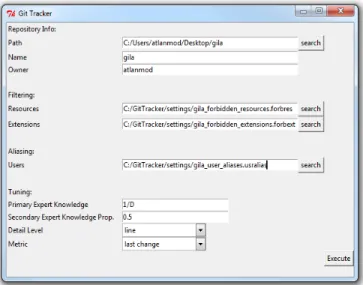
The tool is launched thanks to a simple GUI interface (Fig. 3) that allows to select the Git repository to analyse and tune the bus factor analysis. Once the process has finished, the tool starts a SimpleHTTPServer instance and redirects the user to a web-page (Fig. 4 shows the generated page for a project called GiLA5) displaying the results of the bus factor analysis.
A short summary of the project (name of the project, number of files, etc.) and the corresponding bus factor are shown at the top. All branches, directories, files and file extensions that have not been filtered are grouped into scroll-panes in the page and represented as clickable boxes, which sizes are reduced in half as soon as the number of boxes in the scroll-pane exceeds a tuneable threshold. Clicking on the boxes shows the corresponding relations with the other boxes (e.g., files in a directory), its details (e.g., its name), its bus factor and the knowledge percentages hold by key developers (see an example in Fig. 5).
The page also shows the project developers as boxes. When a developers is clicked, the web-page highlights the software artifacts where she is a key developer. Developers can also be temporally removed to simulate the effect of those developers leaving the project. This recalculates the bus factor and shades the files, directories, branches and file extensions that would be affected (Fig. 6) because of their disappearance.
IV. EVALUATION
We have evaluated the tool by using it to analyze a number of repositories and checking its results with the developers involved in those repositories to confirm that the results matched their feeling about who were the key developers in each project component.
We first did this for three of the tools developed in our research group6 (Collaboro, GiLA and EMFtoCSP). The feedback we got allowed us to refine our default settings for the different calculations in the process. To give just an example, in one of the projects we got an unexpected high value for one of the developers. A detailed analysis revealed that she was performing smaller but much more frequently commits than the rest and therefore “stealing” knowledge points from the rest. In that scenario, a metric like M3 or M4 can help correct the deviation.
5The result web-page is available at: http://atlanmod.github.io/busfactor/ 6https://github.com/atlanmod/
We later repeated the experiments with the private reposi-tories of Nelio Software7company where one of the authors is also involved (though not currently as a developer), discovering that some components exposed a low bus factor, thus triggering some discussions within the company.
Finally, in order to evaluate the performance of our tool when analysing large repositories, we tested it on some large projects available on GitHub (note that our tool works with any Git repository, thus it can be easily applied to GitHub ones). For instance, the analysis of the master branch of Angular.js took 49 minutes (6,145 commits over 2,505 files modified 22,867 times involving 601,828 line modifications). This heavy analysis does not produce instant results, but we believe the delay is reasonable.
V. CONCLUSION
In this paper we have presented a tool for assessing and visualizing the bus factor for software development projects using Git. The tool calculates the bus factor for the project and for any file, directory, branch and file extension in it. The calculation process underlying can be easily tuned to better fit the development process in place in a given company. In addition, the tool allows to simulate what-if situations of developers leaving the project.
As further work, we plan to calculate the bus factor for a number of open source projects and see how they compare to each other based on different dimensions (language, size, etc.). Moreover, we would like to come up with different combinations of configuration parameters for the tool that can be recommended to end-users based on their development process.
REFERENCES
[1] M. Bloch, S. Blumberg, and J. Laartz, “Delivering large-scale IT projects on time, on budget, and on value,” Harvard Business Review, 2011.
[2] B. W. Boehm, “Software risk management: principles and practices,” Soft., IEEE, vol. 8, no. 1, pp. 32–41, 1991.
[3] J. McManus, Risk management in software development projects, 2012. [4] J. Menezes Jr, C. Gusm˜ao, and H. Moura, “Indicators and Metrics for Risk Assessment in Software Projects: A Mapping Study,” in ESELAW, 2008.
[5] M. Bowler, “Truck factor,” Tech. Rep., May 2005. [Online]. Available: http://www.agileadvice.com/2005/05/15/agilemanagement/truck-factor/ [6] A. Cockburn and L. Williams, “The costs and benefits of pair
program-ming,” Extreme progr. examined, pp. 223–247, 2000. [7] S. Chacon and J. C. Hamano, Pro git, 2009, vol. 288.
[8] T. Girba, A. Kuhn, M. Seeberger, and S. Ducasse, “How developers drive software evolution,” in IWPSE, 2005, pp. 113–122.
[9] C. Bird, N. Nagappan, B. Murphy, H. Gall, and P. Devanbu, “Don’t touch my code!: examining the effects of ownership on software quality,” in FSE, 2011, pp. 4–14.
[10] N. Zazworka, K. Stapel, E. Knauss, F. Shull, V. R. Basili, and K. Schneider, “Are developers complying with the process: an xp study,” in ESEM, 2010, p. 14.
[11] F. Ricca, A. Marchetto, and M. Torchiano, “On the difficulty of computing the truck factor,” in Product-Focused Software Process Improvement, 2011, pp. 337–351.
[12] L. Hattori and M. Lanza, “Mining the history of synchronous changes to refine code ownership,” in MSR, 2009, pp. 141–150.
Fig. 3: GUI to tune the bus factor analysis
Fig. 4: Landing page for GiLA
Fig. 5: Bus factor analysis of a file in GiLA