HAL Id: hal-02429557
https://hal.archives-ouvertes.fr/hal-02429557
Submitted on 6 Jan 2020
HAL is a multi-disciplinary open access
archive for the deposit and dissemination of
sci-entific research documents, whether they are
pub-lished or not. The documents may come from
teaching and research institutions in France or
abroad, or from public or private research centers.
L’archive ouverte pluridisciplinaire HAL, est
destinée au dépôt et à la diffusion de documents
scientifiques de niveau recherche, publiés ou non,
émanant des établissements d’enseignement et de
recherche français ou étrangers, des laboratoires
publics ou privés.
Distributed under a Creative Commons Attribution| 4.0 International License
Breast Milk Lipidome Is Associated with Early Growth
Trajectory in Preterm Infants
Marie-Cecile Alexandre-Gouabau, Thomas Moyon, Véronique Cariou,
Jean-Philippe Antignac, El Mostafa Qannari, Mikael Croyal, Mohamed
Soumah, Yann Guitton, Agnès David-Sochard, Hélène Billard, et al.
To cite this version:
Marie-Cecile Alexandre-Gouabau, Thomas Moyon, Véronique Cariou, Jean-Philippe Antignac, El
Mostafa Qannari, et al.. Breast Milk Lipidome Is Associated with Early Growth Trajectory in Preterm
Infants. Nutrients, MDPI, 2018, 10 (2), pp.164. �10.3390/nu10020164�. �hal-02429557�
nutrients
ArticleBreast Milk Lipidome Is Associated with Early
Growth Trajectory in Preterm Infants
Marie-Cécile Alexandre-Gouabau1,*ID, Thomas Moyon1,†, Véronique Cariou2,†ID, Jean-Philippe Antignac3, El Mostafa Qannari2, Mikaël Croyal1, Mohamed Soumah2,
Yann Guitton3 ID, Agnès David-Sochard1, Hélène Billard1, Arnaud Legrand4, Cécile Boscher4, Dominique Darmaun1,4, Jean-Christophe Rozé1,4,†and Clair-Yves Boquien1,5,† ID
1 Institut National de la Recherche Agronomique (INRA), Unité Mixte de Recherche (UMR) 1280,
Physiopathologie des Adaptations Nutritionnelles, Institut des Maladies de L’appareil Digestif (IMAD), Centre de Recherche en Nutrition Humaine Ouest (CRNH), 44093 Nantes, CEDEX 1, France;
[email protected] (T.M.); [email protected] (M.C.);
[email protected] (A.D.-S.); [email protected] (H.B.); [email protected] (D.D.); [email protected] (J.-C.R.); [email protected] (C.-Y.B.)
2 Statistique, Sensométrie et Chimiométrie (StatSC), Ecole Nationale Vétérinaire, Agroalimentaire et de
l’Alimentation Nantes-Atlantique (ONIRIS), Institut National de la Recherche Agronomique (INRA), 44322 Nantes, France; [email protected] (V.C.); [email protected] (E.M.Q.); [email protected] (M.S.)
3 L’Université Nantes Angers Le Mans (LUNAM Université), Ecole Nationale Vétérinaire, Agroalimentaire et
de l'Alimentation Nantes-Atlantique (ONIRIS), Laboratoire d’Etude des Résidus et Contaminants dans les Aliments (LABERCA), USC INRA 1329, 44200 Nantes, France;
[email protected] (J.-P.A.); [email protected] (Y.G.)
4 Faculté de Médicine de Nantes, Centre Hospitalo-Universitaire Hôtel-Dieu (CHU), 44093 Nantes, France;
[email protected] (A.L.); [email protected] (C.B.)
5 European Milk Bank Association (EMBA), 20126 Milan, Italy * Correspondence: [email protected];
Tel.: +33-(0)2-53-48-20-12; Fax: +33-(0)2-53-48-20-03 † These authors contributed equally to this work.
Received: 11 December 2017; Accepted: 12 January 2018; Published: 31 January 2018
Abstract:Human milk is recommended for feeding preterm infants. The current pilot study aims to determine whether breast-milk lipidome had any impact on the early growth-pattern of preterm infants fed their own mother’s milk. A prospective-monocentric-observational birth-cohort was established, enrolling 138 preterm infants, who received their own mother’s breast-milk throughout hospital stay. All infants were ranked according to the change in weight Z-score between birth and hospital discharge. Then, we selected infants who experienced “slower” (n = 15,−1.54±0.42 Z-score) or “faster” (n = 11,−0.48±0.19 Z-score) growth; as expected, although groups did not differ regarding gestational age, birth weight Z-score was lower in the “faster-growth” group (0.56±0.72 vs. −1.59 ± 0.96). Liquid chromatography–mass spectrometry lipidomic signatures combined with multivariate analyses made it possible to identify breast-milk lipid species that allowed clear-cut discrimination between groups. Validation of the selected biomarkers was performed using multidimensional statistical, false-discovery-rate and ROC (Receiver Operating Characteristic) tools. Breast-milk associated with faster growth contained more medium-chain saturated fatty acid and sphingomyelin, dihomo-γ-linolenic acid (DGLA)-containing phosphethanolamine, and less oleic acid-containing triglyceride and DGLA-oxylipin. The ability of such biomarkers to predict early-growth was validated in presence of confounding clinical factors but remains to be ascertained in larger cohort studies.
Keywords:breast milk lipidome; preterm infant; growth trajectory
Nutrients 2018, 10, 164 2 of 28
1. Introduction
A large body of epidemiologic evidence supports the short- and long-term benefit of breastfeeding in healthy term infants [1]. The World Health Organization (WHO) therefore recommends exclusive breastfeeding for the first six months of life [2]. Due to their tremendous growth rate, contrasting with the immaturity of their gastrointestinal system, most very preterm infants (born before 32 weeks of gestation) require intravenous nutrition for the first few weeks of life. As intravenous nutrition exposes to a high risk of sepsis, metabolic and hepatic complications, weaning preterm infants of intravenous nutrition is, however, a top priority and maternal milk feeding is strongly recommended in preterm infants as well [3,4]. When own mother’s milk is not available, the WHO and the American Academy of Pediatrics [5] recommend the use of donated breast milk, issued from a human milk bank, as an alternative [6–8]. In particular, feeding preterm infants with human milk has been shown to be associated with: (i) a dramatic reduction in the risk of developing prematurity-related morbidities [9], including necrotizing enterocolitis [10–12] and serious infection (sepsis) [7]; (ii) improved feeding tolerance and, in turn, faster advancement of enteral feeds [10,13]; and (iii) improved neurodevelopment [10,14]. Moreover, a few randomized controlled trials suggest breast milk might reduce the incidence of atherosclerosis in adolescents born preterm [15]. Breast milk alone, however, due to its relatively low protein and energy content, cannot cover the tremendous needs of preterm infants, and exclusive breastfeeding is often associated with extra-uterine growth restriction (EUGR) [14,16]. As impaired initial growth could have severe consequences since preterm birth per se is a risk factor for developmental delay [17,18], the European Society for Paediatric Gastroenterology Hepatology and Nutrition (EPSGHAN) committee on nutrition recommends human milk fortification for preterm infants [19]. Notwithstanding, a large range of variation is still observed regarding growth during hospital stay [20] even among preterm infants receiving protein-fortified human milk. Literature reports large inter-subject variations in the composition of expressed own mother’s milk [21]. Indeed, the fat composition can be directly impacted by numerous factors, including maternal diet [22,23], body mass index (BMI) [24], parity [25], or stage of lactation [26,27]. Regarding gestational age, it has been reported to impact total milk fat content only in the first stage of lactation [28,29]. Milk lipid supplies not only 45–55% of the total energy requirement of a healthy infant [30], but also building blocks for tissue growth. The effects of milk fatty acids and phospholipids on neurodevelopment have been widely studied [30–32]. However, there are scarce data on the potential health benefits of specific lipid components of human milk [30], specifically on preterm infants. Although metabolomics and lipidomics seem to be a promising approach in neonatology [33,34] to explore the broad range of concentrations of various components in small samples of biological materials [35], only a small number of clinical applications have appeared in literature [36–38]. Furthermore, to the best of our knowledge, no previous study has explored in depth the relationships between lipid components in human milk and the early growth of preterm infants during their hospital stay. To fill this gap, the current study aims at shedding light on the relationships between breast milk lipidome and growth pattern of preterm infants nourished by their own mother’s milk. In the present pilot study, we chose to select two groups of preterm infants, presenting very different growth trajectories during hospital stay, and selected within the ongoing LACTACOL birth cohort (ClinicalTrials.gov Identifier: NCT01493063, acronyme for the clinical study titled “Impact of Breast Milk on the Neurodevelopment of Preterm Newborns”). The aim of the present work therefore was: (i) to assess lipidome in the breast milk received by preterm infants during their first weeks of life; (ii) to evaluate the association between breast milk lipidome and the weight gain of infants between birth and time of discharge, by using multivariate statistical tools that accurately discriminate the two groups of preterm infants; and (iii) to identify a few breast milk lipid species and evaluate their predictive ability on the postnatal weight growth trajectory of the preterm infants, taking into account confounding clinical factors.
Nutrients 2018, 10, 164 3 of 28
2. Materials and Methods 2.1. Study Design and Population
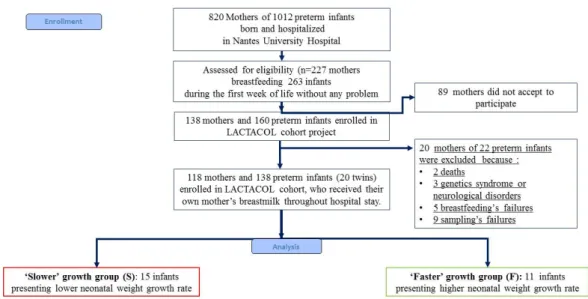
The present pilot study was an ancillary study conducted on sub-groups of infants selected among infants enrolled in the mono-centric prospective population-based LACTACOL birth cohort (registered at www.clinicaltrails.govas NCT01493063) of preterm infant–mother dyads recruited from October 2011 to March 2016. The main objective of the LACTACOL cohort was to explore the impact of the protein content of breast milk provided to preterm infants during hospital stay on neurodevelopment at 2 years of age. A written consent was obtained from all participants at enrollment. One hundred thirty-eight infants born between 26 and 36 weeks of gestational age, with no major congenital disease except prematurity, were included, for a total of 118 mothers finally enrolled in the LACTACOL cohort (Figure1). Necrotizing enterocolitis or retinopathy of prematurity were exclusion criteria. The development of comorbidities was defined as any of the following outcomes: intraventricular hemorrhage (IVH), defined as IVH associated with ventricular dilatation (grade III), cystic periventricular leukomalacia (cPVL) and ventricular dilatation, and/or severe bronchopulmonary dysplasia (BPD), defined as the administration of oxygen for at least 28 days plus the need for 30% or more oxygen and/or mechanical ventilator support or continuous positive airway pressure at 36 weeks’ postmenstrual age [39]. As reported in Table1, none of the infants enrolled in the present pilot study presented any evidence of severe neonatal morbidity.
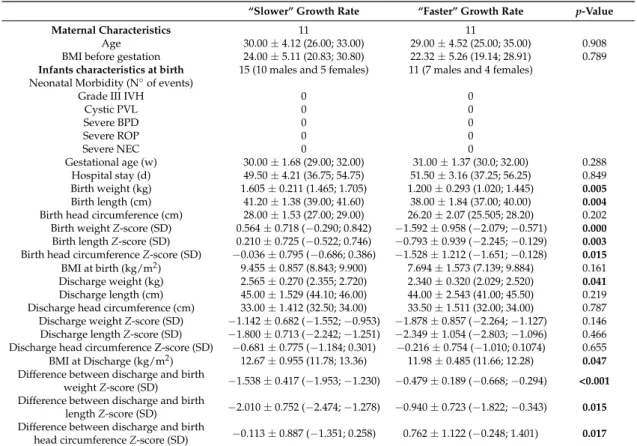
Table 1.Maternal and preterm infants’ characteristics.
“Slower” Growth Rate “Faster” Growth Rate p-Value
Maternal Characteristics 11 11
Age 30.00±4.12 (26.00; 33.00) 29.00±4.52 (25.00; 35.00) 0.908 BMI before gestation 24.00±5.11 (20.83; 30.80) 22.32±5.26 (19.14; 28.91) 0.789
Infants characteristics at birth 15 (10 males and 5 females) 11 (7 males and 4 females) Neonatal Morbidity (N◦of events)
Grade III IVH 0 0
Cystic PVL 0 0 Severe BPD 0 0 Severe ROP 0 0 Severe NEC 0 0 Gestational age (w) 30.00±1.68 (29.00; 32.00) 31.00±1.37 (30.0; 32.00) 0.288 Hospital stay (d) 49.50±4.21 (36.75; 54.75) 51.50±3.16 (37.25; 56.25) 0.849 Birth weight (kg) 1.605±0.211 (1.465; 1.705) 1.200±0.293 (1.020; 1.445) 0.005 Birth length (cm) 41.20±1.38 (39.00; 41.60) 38.00±1.84 (37.00; 40.00) 0.004
Birth head circumference (cm) 28.00±1.53 (27.00; 29.00) 26.20±2.07 (25.505; 28.20) 0.202 Birth weight Z-score (SD) 0.564±0.718 (−0.290; 0.842) −1.592±0.958 (−2.079;−0.571) 0.000
Birth length Z-score (SD) 0.210±0.725 (−0.522; 0.746) −0.793±0.939 (−2.245;−0.129) 0.003
Birth head circumference Z-score (SD) −0.036±0.795 (−0.686; 0.386) −1.528±1.212 (−1.651;−0.128) 0.015
BMI at birth (kg/m2) 9.455±0.857 (8.843; 9.900) 7.694±1.573 (7.139; 9.884) 0.161 Discharge weight (kg) 2.565±0.270 (2.355; 2.720) 2.340±0.320 (2.029; 2.520) 0.041
Discharge length (cm) 45.00±1.529 (44.10; 46.00) 44.00±2.543 (41.00; 45.50) 0.219 Discharge head circumference (cm) 33.00±1.412 (32.50; 34.00) 33.50±1.511 (32.00; 34.00) 0.787 Discharge weight Z-score (SD) −1.142±0.682 (−1.552;−0.953) −1.878±0.857 (−2.264;−1.127) 0.146 Discharge length Z-score (SD) −1.800±0.713 (−2.242;−1.251) −2.349±1.054 (−2.803;−1.096) 0.466 Discharge head circumference Z-score (SD) −0.681±0.775 (−1.184; 0.301) −0.216±0.754 (−1.010; 0.1074) 0.655 BMI at Discharge (kg/m2) 12.67±0.955 (11.78; 13.36) 11.98±0.485 (11.66; 12.28) 0.047
Difference between discharge and birth
weight Z-score (SD) −1.538±0.417 (−1.953;−1.230) −0.479±0.189 (−0.668;−0.294) <0.001 Difference between discharge and birth
length Z-score (SD) −2.010±0.752 (−2.474;−1.278) −0.940±0.723 (−1.822;−0.343) 0.015 Difference between discharge and birth
head circumference Z-score (SD) −0.113±0.887 (−1.351; 0.258) 0.762±1.122 (−0.248; 1.401) 0.017
Abbreviations: BPD, bronchopulmonary dysplasia; IPH, intraparenchymal hemorrhage; IVH, intraventricular hemorrhage; NEC, necrotizing enterocolitis; PVL, periventricular leukomalacia; ROP, retinopathy of prematurity. Severe bronchopulmonary dysplasia (BPD), defined as the administration of oxygen for at least 28 days plus the need for 30% or more oxygen and/or mechanical ventilator support or continuous positive airway pressure at 36 weeks’ postmenstrual age [39]. SD: standard deviation. Values are medians and 25% and 75% percentiles. p values for comparison between “faster” and “slower” growth groups were derived by using Mann–Whitney U test. Characteristics in bold font presented a corrected p-value < 0.05 between the two infant groups.
Nutrients 2018, 10, 164 4 of 28
Nutrients 2018, 10, x FOR PEER REVIEW 3 of 28 2. Materials and Methods
2.1. Study Design and Population
The present pilot study was an ancillary study conducted on sub-groups of infants selected among infants enrolled in the mono-centric prospective population-based LACTACOL birth cohort (registered at www.clinicaltrails.gov as NCT01493063) of preterm infant–mother dyads recruited from October 2011 to March 2016. The main objective of the LACTACOL cohort was to explore the impact of the protein content of breast milk provided to preterm infants during hospital stay on neurodevelopment at 2 years of age. A written consent was obtained from all participants at enrollment. One hundred thirty-eight infants born between 26 and 36 weeks of gestational age, with no major congenital disease except prematurity, were included, for a total of 118 mothers finally enrolled in the LACTACOL cohort (Figure 1). Necrotizing enterocolitis or retinopathy of prematurity were exclusion criteria. The development of comorbidities was defined as any of the following outcomes: intraventricular hemorrhage (IVH), defined as IVH associated with ventricular dilatation (grade III), cystic periventricular leukomalacia (cPVL) and ventricular dilatation, and/or severe bronchopulmonary dysplasia (BPD), defined as the administration of oxygen for at least 28 days plus the need for 30% or more oxygen and/or mechanical ventilator support or continuous positive airway pressure at 36 weeks’ postmenstrual age [39]. As reported in Table 1, none of the infants enrolled in the present pilot study presented any evidence of severe neonatal morbidity.
Figure 1. Flowchart of infants enrolled in the ancillary study of the mono-centric prospective population-based LACTACOL. (ClinicalTrials.gov Identifier: NCT01493063, acronyme for “Impact of Breast Milk on the Neurodevelopment of Preterm Newborns").
Table 1. Maternal and preterm infants’ characteristics.
“Slower” Growth Rate “Faster” Growth Rate p-Value
Maternal Characteristics 11 11
Age 30.00 ± 4.12 (26.00; 33.00) 29.00 ± 4.52 (25.00; 35.00) 0.908 BMI before gestation 24.00 ± 5.11 (20.83; 30.80) 22.32 ± 5.26 (19.14; 28.91) 0.789
Infants characteristics at birth 15 (10 males and 5 females) 11 (7 males and 4 females) Neonatal Morbidity (N° of events)
Grade III IVH 0 0
Cystic PVL 0 0 Severe BPD 0 0 Severe ROP 0 0 Severe NEC 0 0 Gestational age (w) 30.00 ± 1.68 (29.00; 32.00) 31.00 ± 1.37 (30.0; 32.00) 0.288 Hospital stay (d) 49.50 ± 4.21 (36.75; 54.75) 51.50 ± 3.16 (37.25; 56.25) 0.849 Figure 1. Flowchart of infants enrolled in the ancillary study of the mono-centric prospective population-based LACTACOL. (ClinicalTrials.gov Identifier: NCT01493063, acronyme for “Impact of Breast Milk on the Neurodevelopment of Preterm Newborns").
Infants admitted to the Neonatal Intensive Care Unit at Nantes University Hospital were eligible if they received human milk as their sole feeding for more than 28 days. Clinical characteristics were collected both on mothers and infants, including: maternal age, educational level, pre-gravid BMI, adverse events during pregnancy and delivery, infants’ gestational age, birth weight and head circumference, growth trajectory through hospital discharge, and events during hospital stay in neonatology. Parenteral nutritional supply was recorded daily, as well as enteral intake: volume of milk delivered per feeding session, fortifiers used and fortification level. The fortification followed, as far as possible, the EPSGHAN recommendations [19] regarding mean daily energy (i.e., 110–135 kcal/kg body weight/day) and macronutrient intake: 3.5–4.0 g/kg body weight/day for protein (for babies with 1–1.8 kg body weight); 4.8–6.6 g/kg body weight/day for lipid; and 11.6–13.2 g/kg body weight/day for carbohydrate. Human milk fortification was performed using Eoprotine®(Milupa,
Domdidier, Suisse) and FortiPré®(Guigoz, Noisiel, France), for protein and carbohydrate; Liquigen® (Nutricia, Saint-Ouen, France) for lipid; and Dextrin maltose, for carbohydrate. Energy and protein contents in preterm standard formula were 72 kcal/100 mL and 2 g/100 mL, respectively [40]. By taking into account native own mother’s milk macro-nutriments contents (measured by MIRIS human milk analyzer (Miris AB®, Uppsala, Sweden) analysis, Section2.4) and routine fortification, the mean total enteral intake at 3 weeks of age, was: 2.48±0.16 in the “faster growth” group, vs. 2.49±0.12 g/kg/day in the “slower growth” group (p-value = 0.69) for protein; 6.76± 0.56 vs. 5.48± 0.45 g/kg/day (p-value = 0.08) for lipid; and 13.08±0.59 vs. 14.14±0.49 g/kg body weight/day (p-value = 0.31) for carbohydrate. The mean energy intake was: 125.8±6.07 vs. 118.1±4.99 kcal/kg body weight/day (p-value = 0.17). These values were reasonably close to that of EPSGHAN guidelines except for protein intake (which was 28% below recommended intake) whereas total energy intake was consistent with guidelines in both groups of infants. Preterm infants received parenteral nutrition and minimal enteral feeding, predominantly with expressed breast milk, for a minimum of two weeks.
2.2. Ranking Infants According to Early Growth Trajectory
Body weight was measured weekly from birth to discharge (accuracy of 0.1 g). Weight Z-score was calculated using the Lambda Mu Sigma (LMS) method [41] and Olsen’s preterm infant growth chart [42] was applied with respect to birth and discharge measurements. After completion of the cohort, for the specific purpose of the current pilot study, infants enrolled in LACTACOL cohort were ranked according to their growth trajectory during hospital stay. Weight gain during hospitalization
Nutrients 2018, 10, 164 5 of 28
was assessed as the change in weight Z-score (expressed in units of Standard Deviation (SD) using the SD of the term category as the benchmark) between birth and hospital discharge and all infants were then ranked, according to this difference in weight Z-score. We then selected two groups of infants who belonged either to the first or to the last terciles of growth rate in our population of 138 enrolled preterm babies (i.e., a difference between discharge and birth weight Z-score greater than
−0.56 or lower than−1.06, respectively); those 2 groups of infants are termed infants with “faster growth” or “slower growth” in the following (Figure1). The infants with “faster growth” (n = 11 infants (7 boys and 4 girls) presented a difference between discharge and birth weight Z-score of:
−0.479±0.189 (−0.668;−0.294) SD (median and 25% and 75% percentiles). The infants with “slower growth” (n = 15 infants (10 boys and 5 girls) presented a difference between discharge and birth weight Z-score of: −1.538±0.417 (−1.953;−1.230) SD (median and 25% and 75% percentiles). Moreover, in the selection of the infants, we had two others constraints: the availability of sufficient own mother’s milk samplings from week 2 to week 7 of lactation, and of infant serum (results not shown in the present work). Two sets of twins belonged to the “slower” growth group and two others sets of twins followed opposite trajectories regarding their weight Z-score difference between birth and hospital discharge, i.e., one set of twins belonged to the “faster” growth group, and the other belonged to the “slower” growth group. Clinical characteristics of mother-infant dyads are summarized in Table1. Although gestational age (30–31 weeks) and length of hospital stay (49–51 days) did not differ between the groups, the group of infants with “faster” growth had a 25% lower birth weight (i.e., 1.200±0.293 kg vs. 1.605±0.211 kg) combined with a 69% greater gain in weight Z-score between birth and discharge. This negative correlation between birth weight and weight Z-score at time of discharge has long been known, and was previously reported in the large Loire Infant Follow-up Team (LIFT) cohort of 2277 preterm infants by our team [40] and in another cohort [43].
2.3. Ethics
This research study, referenced BRD/11/02-Y at Nantes University Hospital, was approved, on 28 February 2011, by the National Data Protection Authority (Commission Nationale de l’Informatique et des Libertés, No. 8911009) and, on 19 July 2011, by the appropriate ethics Committee for the Protection of People Participating in Biomedical Research (CPP—Ouest I (Tours, France), reference CPP RCB-2011-AOO292-39). The LACTACOL cohort was registered atwww.clinicaltrials.govunder # NCT01493063. The current data were obtained in the corresponding ancillary study N◦3 with the following outcome i.e., to assess the relationship between the composition of breast milk (lipidome in the present study) and preterm infant’s growth trajectory during the first few weeks of life. The milk biobank was approved by the Committee for the Protection of Persons in medical research (approval was granted 24 June 2010, reference CPP CB-2010-03). Parents received oral and written information in the maternity ward or neonatal unit, lactation support and training on proper sample collection from the study lactation consultant. A written consent was obtained from all parents at enrolment. 2.4. Human Milk Collection and Targeted Fatty Acid Analysis
Weekly breast milk expression was performed manually by mothers at home, using a Medela Manual Breast pump (Medela Inc., Etampes, France). Representative 24-h mature milk samples were obtained by pooling breast milk sampled from 5 to 6 bottles brought daily to the Milk Bank of the Nantes University Hospital. The whole milk pool was homogenized with a disruptor (Polytron, Lucerne, Switzerland) and kept frozen at−80◦C until analysis. Total milk fat was measured using the MIRIS®human milk analyzer (Miris AB®, Uppsala, Sweden), based on mid-infrared methodology [44]. The modified liquid–liquid extraction method of Bligh-Dyer [45] was used to extract lipophilic metabolites. Two lipid analyses were achieved: a first targeted analysis of total fatty acids and a second untargeted lipidomic profiling. Total fatty acids were analyzed by gas chromatography using an Agilent Technologies 7890A® instrument (Perkin Elmer, Villebon-sur-Yvette, France),
Nutrients 2018, 10, 164 6 of 28
following trans-esterification [46]. See Supplementary Materials online for detailed information about biochemical analysis and materials used.
2.5. Breast Milk Liquid Chromatography–High-Resolution-Mass Spectrometry (LC-HRMS)-Based Lipidomic Profiling
Following Bligh-Dyer extraction, the organic layers were dried and subsequently reconstituted in acetonitrile-isopropanol-water (ACN:IPA:H2O 65:30:5, v/v/v). A 1200 infinity series® high
performance liquid chromatography (HPLC) system (Agilent Technologies, Santa Clara, CA, USA) coupled to an Exactive Orbitrap®mass spectrometer (Thermo Fisher Scientific, Bremen, Germany) equipped with a heated electrospray (H-ESI II) source (operating in polarity switch mode) was used for lipid profiling. The full instrument calibration was performed using a MSCAL6 ProteoMassT LTQ/FT-Hybrid ESI Pos/Neg®(Sigma–Aldrich, St. Louis, MO, USA). Xcalibur 2.2®(Thermo Fisher Scientific, San Jose, CA, USA) was used for data acquisition and analysis. Lipid species separation was performed on a reverse phase CSH®C
18(100×2.1 mm2i.d., 1.7 µm particle size) column (Waters
Corporation, Milford, MA, USA) using ACN:H2O (60:40) and IPA:ACN:H2O (88:10:2) as solvent A and
B, respectively; both containing 10 mM ammonium acetate and 0.1% acetic acid [47]. The precision associated with sample preparation and LC-HRMS measurement was determined based on a quality control (QC) consisting of a pool of 10 mothers’ milk provided by the milk bank of Nantes Hospital Center. Summary assay procedures have been detailed in Supplementary Material.
2.6. Data Analysis and Lipid Species Characterization
LC–ESI (positive/negative) HRMS raw data files were initially preprocessed with Xcalibur 2.2® (Thermo Fisher Scientific, San Jose, CA, USA), converted to the (*.mzXML) cross-platform open file format, using MSConvert® [48], and processed using Workflow4Metabolomics® (W4M) (http: //workflow4metabolomics.org) [49]. Lipidomic data were extracted using: (i) pre-processing with the open-source XCMS®[50] within W4M [49], for nonlinear retention time alignment and for automatic integration and extraction of the peak intensities for each detected features (ions of given mass-to charge ratio and retention time [m/z; RT]), combined to CAMERA®[51], for annotation of isotopes and adducts; and (ii) normalization of intra- and inter-batch effects by fitting linear or local polynomial regression models to QC samples [52]. The resulting XCMS [m/z; RT] features for each sample was subsequently manually sorted out according to their quality of integration and filtered by a 30% relative SD cutoff within the repeated pooled QC injections (see Dunn and co-workers’ recommendations [53]). Thereafter, accurate mass measurement of each putative metabolite was submitted to LIPID Metabolites and Pathways Strategy (LipidMaps®,www.lipidmaps.org) annotation. Moreover, the use of all ion fragmentation, when reverse phase chromatography was applied, helped us identify the proposed lipids by examination of the (pseudo) tandem mass spectrometry spectrum generated [47], combined with the use of an in-house reference databank [54].
2.7. Statistical Analyses
Statistical analyses were carried out using GraphPad Prism®software version 6.00 (La Joya, CA, USA), SIMCA P® version 13 (Umetrics AB, Malmö, Sweden) and R version 3.2.5 (R Development Core Team, 2013, R Foundation for Statistical Computing, Vienna, Austria;http://www.R-project.org). For all data analyses, the significance level (α) was set to 5%, and 10% for Multiple Linear Regression. Multivariate statistical models were applied on pre-processed QC-filtered lipidomic mother x time (rows) by [m/z; RT] features (columns) data matrix considering the a priori structure into “faster” vs. “slower” infants’ growth groups. Lipidomic features were column-wise centered and scaled with a Log Pareto scaling [55]. A statistical workflow (Figure2) was set up to: (i) select the most reliable lactation points; (ii) identify the lipid biomarkers providing a clear separation between the two infant postnatal growth subgroups; (iii) check the selected biomarkers predictive ability; and (iv) confront them to the various confounding clinical variables.
Nutrients 2018, 10, 164 7 of 28
Nutrients 2018, 10, x FOR PEER REVIEW 7 of 28
QC-filtered lipidomic mother x time (rows) by [m/z; RT] features (columns) data matrix considering the a priori structure into “faster” vs. “slower” infants’ growth groups. Lipidomic features were column-wise centered and scaled with a Log Pareto scaling [55]. A statistical workflow (Figure 2) was set up to: (i) select the most reliable lactation points; (ii) identify the lipid biomarkers providing a clear separation between the two infant postnatal growth subgroups; (iii) check the selected biomarkers predictive ability; and (iv) confront them to the various confounding clinical variables.
Figure 2. Statistical workflow applied on breast-milk Liquid Chromatography–High-Resolution-Mass
Spectrometry profiles obtained in positive and negative ionization mode.
Step 1: Selection of the most reliable lactation points. Multi-group PLS Discriminant Analysis (MG PLS-DA) [56] was performed to explain the a priori infant growth trajectory taking into account the longitudinal character of the data (weekly measurements) as groups among the rows (multigroup package in R) [57]. As a matter of fact, MG PLS-DA model revealed the time lactation points presenting the best differentiation between the two groups (“faster” vs. “slower” infant growth). Thereafter, only the most discriminant time lactation points were considered in the subsequent analyses and the significance of the growth factor was assessed. To cope with multi-colinearity inherent in metabolomics data [58,59], the Analysis of Variance-PLS (AoV-PLS) procedure proposed by El Ghaziri et al. [60] was applied.
Step 2: Identification of the lipid species biomarkers. AoV-PLS aimed at: (i) exploring how “faster” vs. “slower” preterm infants’ growth structure was explained by milk lipidomic signatures; and (ii) pinpointing the most discriminant features related to the infants’ growth pattern during hospital stay. This selection was performed on the basis of the variables of importance (for the milk clustering) indices (VIP > 1.0) [61] reflecting the contribution of each variable ([m/z; RT] feature) to the separation of the two infant groups. The appropriate number of components retained for the AoV-PLS model was chosen on the basis of the RMSEP (root mean square error of prediction) value obtained with a leave-one-out cross-validation procedure. In a subsequent stage, the selected AoV-PLS components were subjected to a Fisher’s linear discriminant analysis (LDA) to assess the significance of this model with respect with the two a priori groups (“faster” vs. “slower” infant growth) (function linDA of the DiscriMiner package in R [62]).
Step 3: Validation of the predictive ability of the selected biomarkers. To determine the more robust putative biomarkers of infant growth during hospital stay, lipid species that had been selected on the basis of AoV-PLS/LDA VIP indices in a multivariate scope were submitted to: (i) a subsequent univariate Mann–Whitney U-test; (ii) multiple testing filtering (FDR); and (iii) receiver
Figure 2.Statistical workflow applied on breast-milk Liquid Chromatography–High-Resolution-Mass Spectrometry profiles obtained in positive and negative ionization mode.
Step 1: Selection of the most reliable lactation points. Multi-group PLS Discriminant Analysis (MG PLS-DA) [56] was performed to explain the a priori infant growth trajectory taking into account the longitudinal character of the data (weekly measurements) as groups among the rows (multigroup package in R) [57]. As a matter of fact, MG PLS-DA model revealed the time lactation points presenting the best differentiation between the two groups (“faster” vs. “slower” infant growth). Thereafter, only the most discriminant time lactation points were considered in the subsequent analyses and the significance of the growth factor was assessed. To cope with multi-colinearity inherent in metabolomics data [58,59], the Analysis of Variance-PLS (AoV-PLS) procedure proposed by El Ghaziri et al. [60] was applied.
Step 2: Identification of the lipid species biomarkers. AoV-PLS aimed at: (i) exploring how “faster” vs. “slower” preterm infants’ growth structure was explained by milk lipidomic signatures; and (ii) pinpointing the most discriminant features related to the infants’ growth pattern during hospital stay. This selection was performed on the basis of the variables of importance (for the milk clustering) indices (VIP > 1.0) [61] reflecting the contribution of each variable ([m/z; RT] feature) to the separation of the two infant groups. The appropriate number of components retained for the AoV-PLS model was chosen on the basis of the RMSEP (root mean square error of prediction) value obtained with a leave-one-out cross-validation procedure. In a subsequent stage, the selected AoV-PLS components were subjected to a Fisher’s linear discriminant analysis (LDA) to assess the significance of this model with respect with the two a priori groups (“faster” vs. “slower” infant growth) (function linDA of the DiscriMiner package in R [62]).
Step 3: Validation of the predictive ability of the selected biomarkers. To determine the more robust putative biomarkers of infant growth during hospital stay, lipid species that had been selected on the basis of AoV-PLS/LDA VIP indices in a multivariate scope were submitted to: (i) a subsequent univariate Mann–Whitney U-test; (ii) multiple testing filtering (FDR); and (iii) receiver operating-characteristic (ROC) curve (GraphPad Prism®). The parameter associated to the area under the curve (AUC) was set at 0.5 while the α-threshold was set at 0.05.
Step 4: Introduction of confounding clinical variables. Finally, confounding variables encompassing maternal and infant clinical data were introduced together with every selected putative biomarker to validate its reliability. The association between selected breast milk lipid species and
Nutrients 2018, 10, 164 8 of 28
child’s growth in terms of weight gain during hospital stay (delta Z-score) were investigated by means of Multiple Linear Regression (MLR), taking into account these confounding variables.
3. Results
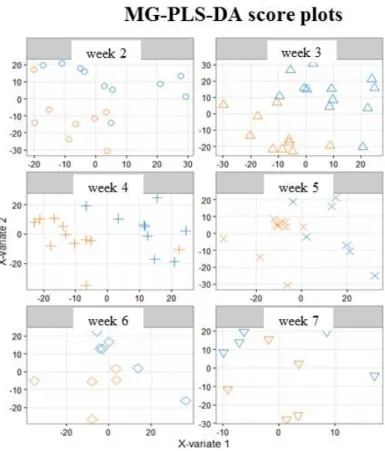
3.1. A Distinct Breast Milk Lipidomic Signature Is Associated with Infant Growth Rate during Hospital Stay Selected features of lipidomic LC-HRMS (ESI+/ESI−) profiles performed on breast milk samples from Week 2 to Week 7 of lactation were processed with MG PLS-DA (Step 1).
On the corresponding score plots obtained in positive (Figure 3) and negative (Figure S1) ionization mode (3451 and 903 features respectively, 118 observations), the milk samples associated with the two groups (“faster” vs. “slower” growth) are plotted separately for each weekly sampling time point (i.e., Weeks 2 to 7). The first three sampling points at Weeks 2, 3 and 4 (i.e., from the 12th to the 24th day (median values)) allowed the best separation between the two groups of milks. This result led us to further restrict the multivariate analysis to data from samples obtained between Week 2 and Week 4.
Nutrients 2018, 10, x FOR PEER REVIEW 8 of 28
operating-characteristic (ROC) curve (GraphPad Prism®). The parameter associated to the area under the curve (AUC) was set at 0.5 while the α-threshold was set at 0.05.
Step 4: Introduction of confounding clinical variables. Finally, confounding variables encompassing maternal and infant clinical data were introduced together with every selected putative biomarker to validate its reliability. The association between selected breast milk lipid species and child’s growth in terms of weight gain during hospital stay (delta Z-score) were investigated by means of Multiple Linear Regression (MLR), taking into account these confounding variables.
3. Results
3.1. A Distinct Breast Milk Lipidomic Signature Is Associated with Infant Growth Rate during Hospital Stay
Selected features of lipidomic LC-HRMS (ESI+/ESI−) profiles performed on breast milk samples from Week 2 to Week 7 of lactation were processed with MG PLS-DA (Step 1).
On the corresponding score plots obtained in positive (Figure 3) and negative (Figure S1) ionization mode (3451 and 903 features respectively, 118 observations), the milk samples associated with the two groups (“faster” vs. “slower” growth) are plotted separately for each weekly sampling time point (i.e., Weeks 2 to 7). The first three sampling points at Weeks 2, 3 and 4 (i.e., from the 12th to the 24th day (median values)) allowed the best separation between the two groups of milks. This result led us to further restrict the multivariate analysis to data from samples obtained between Week 2 and Week 4.
Figure 3. Multi-group PLS-DA score plots based on the LC-ESI+-HRMS profiles (3451 features, 118
milks) obtained on human preterm milk. Representation of the individuals: milk provided to preterm infants who experienced “faster” (orange) or “slower” (blue) growth from Week 2 to Week 7 of lactation. MB-PLS-DA score plots: ○ Week 2; ∆ Week 3; + Week 4; × Week 5; ◊ Week 6; ∇ Week 7.
AoV-PLS (Step 2) was applied separately on the LC-HRMS (ESI+/ESI−) to assess the association between the metabolites and the a priori grouping structure (“faster” vs. “slower” growth). The score plots clearly highlight the separation between breast milk lipidotypes associated with “faster”
Figure 3. Multi-group PLS-DA score plots based on the LC-ESI+-HRMS profiles (3451 features,
118 milks) obtained on human preterm milk. Representation of the individuals: milk provided to preterm infants who experienced “faster” (orange) or “slower” (blue) growth from Week 2 to Week 7 of lactation. MB-PLS-DA score plots:# Week 2; ∆ Week 3; + Week 4;×Week 5;♦Week 6;∇Week 7.
AoV-PLS (Step 2) was applied separately on the LC-HRMS (ESI+/ESI−) to assess the association between the metabolites and the a priori grouping structure (“faster” vs. “slower” growth). The score plots clearly highlight the separation between breast milk lipidotypes associated with “faster” or “slower” infant growth in both positive (Figure 4a) and negative (Figure S2a) ionization modes. Interestingly, the breast milk lipidomic profiles, corresponding to two sets of twins with a concordant low growth rate, were plotted in the “slower growth” milk cluster. The lipidomic profiles of the breast milk provided to two sets of twins with discordant weight Z-score difference, one corresponding to
Nutrients 2018, 10, 164 9 of 28
“faster” (−0.668 and−0.479 SD) and the other to “slower” (−1.23 and−1.53 SD) growth, were found to be in an intermediate location between the two lipidotypes (depicted with blue symbols in Figure4a and Figure S2). Then, the selected appropriate components of AoV-PLSs (for both ionization modes) were subjected to a Fisher’s linear discriminant analysis (LDA) to test the significance of growth factor.
Nutrients 2018, 10, x FOR PEER REVIEW 9 of 28
or “slower” infant growth in both positive (Figure 4a) and negative (Figure S2a) ionization modes. Interestingly, the breast milk lipidomic profiles, corresponding to two sets of twins with a concordant low growth rate, were plotted in the “slower growth” milk cluster. The lipidomic profiles of the breast milk provided to two sets of twins with discordant weight Z-score difference, one corresponding to “faster” (−0.668 and −0.479 SD) and the other to “slower” (−1.23 and −1.53 SD) growth, were found to be in an intermediate location between the two lipidotypes (depicted with blue symbols in Figure 4a and Figure S2). Then, the selected appropriate components of AoV-PLSs (for both ionization modes) were subjected to a Fisher’s linear discriminant analysis (LDA) to test the significance of growth factor.
(a) (b)
Figure 4. AoV-PLS and LDA models, based on the LC-ESI+-HRMS profiles of human preterm milk,
on the factor weight Z-score (discharge-birth): AoV-PLS score plot with 45% of variance (R2Y = 38%) on: components 1–2 (a); and LDA (built on 10 components of AoV-PLS) with a p-value = 0) (b). Breast milk provided to preterm infants who experienced “faster” (green) or “slower” (red) growth and to twin infants with discordant growth rate, one with high growth rate and one with low growth rate, (blue).
The correlation ratio associated with the LDA canonical variable was equal to 71%, with respect to the positive mode (Figure 4b), and 61% with respect to the negative mode (Figure S2b), while their cross-validation error rates were both equal to 7.14%. The most discriminant features associated with infant growth during hospital stay corresponded to a cluster of 1006 (respectively, 256) VIP-based lipid species, in the positive (respectively, negative) ionization mode.
3.2. Characterization of Preterm Breast Milk Lipidotypes in the First Month of Lactation
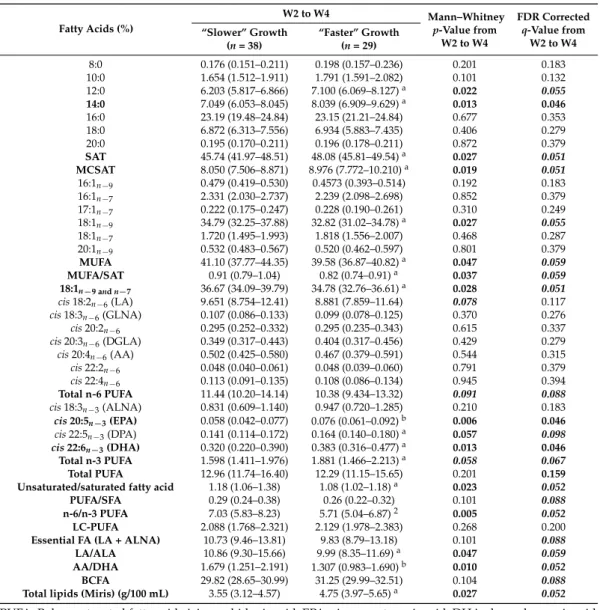
Considering the targeted analysis of total fatty acids, milk provided to the “faster” growth group contained more total fat (4.75 g/100 mL) than the milk provided to infants with a slower growth rate (3.55 g/100 mL) from Week 2 to Week 4 (Table 2) (Table S1, for each sampling time, W2, W3 and W4 of lactation). This is, mainly due to a higher abundance of total saturated fatty acids (SAT) (free and triglycerides- and phospholipids-bound fatty acids) and particularly, medium-chain SAT (MCSAT). In contrast, total mono-unsaturated fatty acids (MUFA), the second most abundant class of milk fatty acids, were lower in the “faster growth” group than in the “slower” group, essentially due to lower oleic acid content. Milk provided to infants who experienced “faster growth” contained more overall n-3 long-chain PUFA, such as docosahexanoic acid and its precursors (eicosapentaenoic and docosapentaenoic acids). Finally, the essential FA content (i.e., linoleic and α-linolenic acids), was similar in both groups during this W2–W4 period.
Figure 4.AoV-PLS and LDA models, based on the LC-ESI+-HRMS profiles of human preterm milk, on the factor weight Z-score (discharge-birth): AoV-PLS score plot with 45% of variance (R2Y = 38%) on: components 1–2 (a); and LDA (built on 10 components of AoV-PLS) with a p-value = 0) (b). Breast milk provided to preterm infants who experienced “faster” (green) or “slower” (red) growth and to twin infants with discordant growth rate, one with high growth rate and one with low growth rate, (blue).
The correlation ratio associated with the LDA canonical variable was equal to 71%, with respect to the positive mode (Figure4b), and 61% with respect to the negative mode (Figure S2b), while their cross-validation error rates were both equal to 7.14%. The most discriminant features associated with infant growth during hospital stay corresponded to a cluster of 1006 (respectively, 256) VIP-based lipid species, in the positive (respectively, negative) ionization mode.
3.2. Characterization of Preterm Breast Milk Lipidotypes in the First Month of Lactation
Considering the targeted analysis of total fatty acids, milk provided to the “faster” growth group contained more total fat (4.75 g/100 mL) than the milk provided to infants with a slower growth rate (3.55 g/100 mL) from Week 2 to Week 4 (Table2) (Table S1, for each sampling time, W2, W3 and W4 of lactation). This is, mainly due to a higher abundance of total saturated fatty acids (SAT) (free and triglycerides- and phospholipids-bound fatty acids) and particularly, medium-chain SAT (MCSAT). In contrast, total mono-unsaturated fatty acids (MUFA), the second most abundant class of milk fatty acids, were lower in the “faster growth” group than in the “slower” group, essentially due to lower oleic acid content. Milk provided to infants who experienced “faster growth” contained more overall n-3 long-chain PUFA, such as docosahexanoic acid and its precursors (eicosapentaenoic and docosapentaenoic acids). Finally, the essential FA content (i.e., linoleic and α-linolenic acids), was similar in both groups during this W2–W4 period.
Nutrients 2018, 10, 164 10 of 28
Table 2. Concentration levels of total fatty acids (free and triglycerides- and phospholipids-bound) in breast milk provided to preterm infants with “faster” or “slower” growth during the W2–W4 lactation period. Fatty Acids (%) W2 to W4 Mann–Whitney p-Value from W2 to W4 FDR Corrected q-Value from W2 to W4 “Slower” Growth (n = 38) “Faster” Growth (n = 29) 8:0 0.176 (0.151–0.211) 0.198 (0.157–0.236) 0.201 0.183 10:0 1.654 (1.512–1.911) 1.791 (1.591–2.082) 0.101 0.132 12:0 6.203 (5.817–6.866) 7.100 (6.069–8.127)a 0.022 0.055 14:0 7.049 (6.053–8.045) 8.039 (6.909–9.629)a 0.013 0.046 16:0 23.19 (19.48–24.84) 23.15 (21.21–24.84) 0.677 0.353 18:0 6.872 (6.313–7.556) 6.934 (5.883–7.435) 0.406 0.279 20:0 0.195 (0.170–0.211) 0.196 (0.178–0.211) 0.872 0.379 SAT 45.74 (41.97–48.51) 48.08 (45.81–49.54)a 0.027 0.051 MCSAT 8.050 (7.506–8.871) 8.976 (7.772–10.210)a 0.019 0.051 16:1n−9 0.479 (0.419–0.530) 0.4573 (0.393–0.514) 0.192 0.183 16:1n−7 2.331 (2.030–2.737) 2.239 (2.098–2.698) 0.852 0.379 17:1n−7 0.222 (0.175–0.247) 0.228 (0.190–0.261) 0.310 0.249 18:1n−9 34.79 (32.25–37.88) 32.82 (31.02–34.78)a 0.027 0.055 18:1n−7 1.720 (1.495–1.993) 1.818 (1.556–2.007) 0.468 0.287 20:1n−9 0.532 (0.483–0.567) 0.520 (0.462–0.597) 0.801 0.379 MUFA 41.10 (37.77–44.35) 39.58 (36.87–40.82)a 0.047 0.059 MUFA/SAT 0.91 (0.79–1.04) 0.82 (0.74–0.91)a 0.037 0.059 18:1n−9 and n−7 36.67 (34.09–39.79) 34.78 (32.76–36.61)a 0.028 0.051 cis 18:2n−6(LA) 9.651 (8.754–12.41) 8.881 (7.859–11.64) 0.078 0.117 cis 18:3n−6(GLNA) 0.107 (0.086–0.133) 0.099 (0.078–0.125) 0.370 0.276 cis 20:2n−6 0.295 (0.252–0.332) 0.295 (0.235–0.343) 0.615 0.337 cis 20:3n−6(DGLA) 0.349 (0.317–0.443) 0.404 (0.317–0.456) 0.429 0.279 cis 20:4n−6(AA) 0.502 (0.425–0.580) 0.467 (0.379–0.591) 0.544 0.315 cis 22:2n−6 0.048 (0.040–0.061) 0.048 (0.039–0.060) 0.791 0.379 cis 22:4n−6 0.113 (0.091–0.135) 0.108 (0.086–0.134) 0.945 0.394 Total n-6 PUFA 11.44 (10.20–14.14) 10.38 (9.434–13.32) 0.091 0.088 cis 18:3n−3(ALNA) 0.831 (0.609–1.140) 0.947 (0.720–1.285) 0.210 0.183 cis 20:5n−3(EPA) 0.058 (0.042–0.077) 0.076 (0.061–0.092)b 0.006 0.046 cis 22:5n−3(DPA) 0.141 (0.114–0.172) 0.164 (0.140–0.180)a 0.057 0.098 cis 22:6n−3(DHA) 0.320 (0.220–0.390) 0.383 (0.316–0.477)a 0.013 0.046 Total n-3 PUFA 1.598 (1.411–1.976) 1.881 (1.466–2.213)a 0.058 0.067 Total PUFA 12.96 (11.74–16.40) 12.29 (11.15–15.65) 0.201 0.159 Unsaturated/saturated fatty acid 1.18 (1.06–1.38) 1.08 (1.02–1.18)a 0.023 0.052
PUFA/SFA 0.29 (0.24–0.38) 0.26 (0.22–0.32) 0.101 0.088
n-6/n-3 PUFA 7.03 (5.83–8.23) 5.71 (5.04–6.87)2 0.005 0.052 LC-PUFA 2.088 (1.768–2.321) 2.129 (1.978–2.383) 0.268 0.200
Essential FA (LA + ALNA) 10.73 (9.46–13.81) 9.83 (8.79–13.18) 0.101 0.088 LA/ALA 10.86 (9.30–15.66) 9.99 (8.35–11.69)a 0.047 0.059
AA/DHA 1.679 (1.251–2.191) 1.307 (0.983–1.690)b 0.010 0.052
BCFA 29.82 (28.65–30.99) 31.25 (29.99–32.51) 0.104 0.088 Total lipids (Miris) (g/100 mL) 3.55 (3.12–4.57) 4.75 (3.97–5.65)a 0.027 0.052
PUFA: Polyunsaturated fatty acid; AA: arachidonic acid; EPA: eicosapentaenoic acid; DHA: docosahexanoic acid; DGLA: dihomo-gamma-linolenic acid; GLNA: gamma-linolenic acid; LA: Linoleic acid; ALNA: alpha-Linolenic acid; SAT: saturated fatty acids; MCSAT: medium-chain saturated fatty acids (C8:0 to C12:0); MUFA: monounsaturated fatty acid; LC-PUFA: long-Chain PUFA (polyunsaturated fatty acid that contains at least 20 carbons); BCFA: branched-chain fatty acids (C14:0, C15:0; C17:0 and C16:0). Values (expressed as % of total identified FA) are median and [25% and 75% percentile] and are given for fatty acids present at >0.05% of total fatty acids in milk. Values of p-values (assessed by Mann–Whitney U test) between “faster” and “slower” growth groups were reported with aorbsignificantly different, p < 0.05 or p < 0.01, respectively; n: milk samplings between Week 2 and Week 4 of lactation. Fatty acids in bold font presented a corrected p-value < 0.05 and fatty acids in bold and italic font presented a corrected p-value between 0.05 and 0.1, using the post hoc control of the type I error rate (False discovery Rate procedure), between the two infant groups over the entire W2–W4 lactation period.
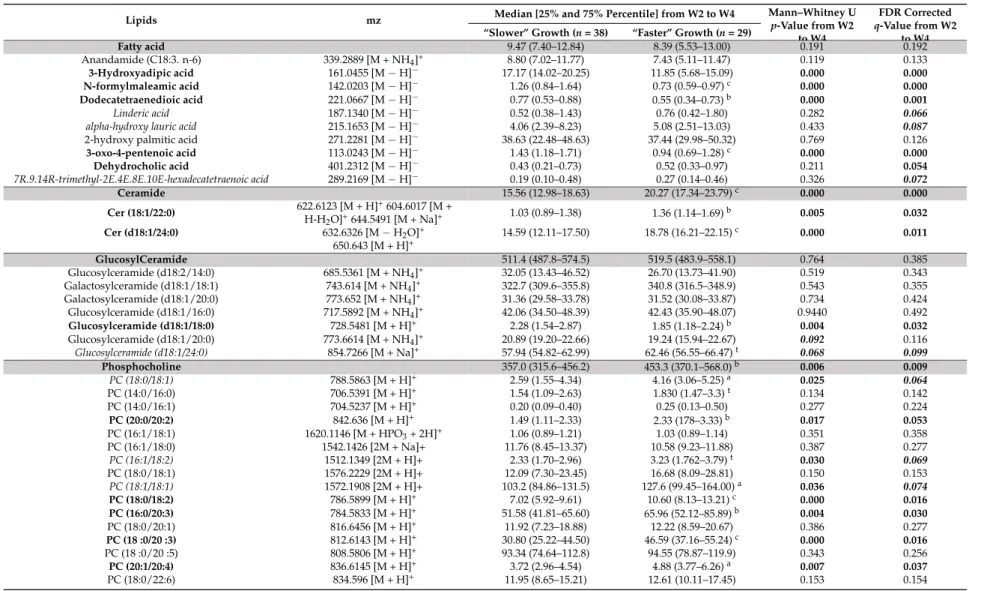
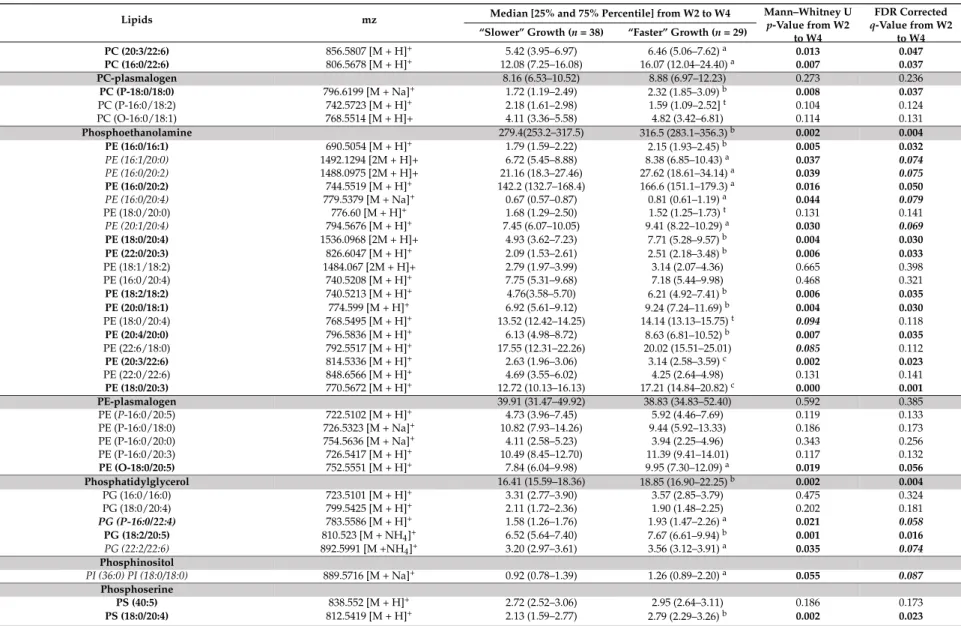
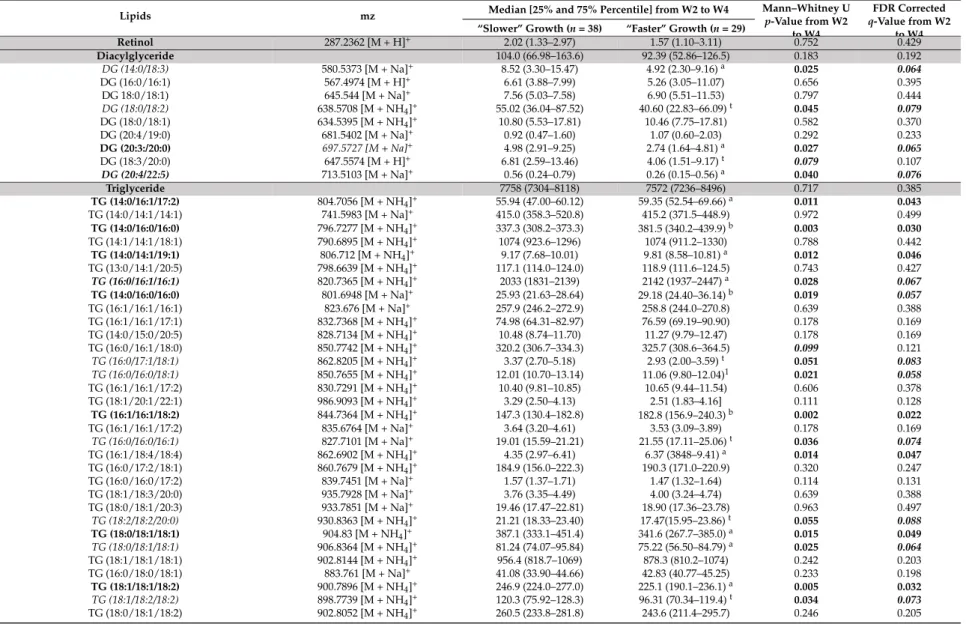
Considering the untargeted lipidomic LC-HRMS signatures, among the 1262 features, selected as described above, 162 discriminant lipid species were annotated and are listed comprehensively in Table3, for the overall W2–W4 lactation period, and in Table S2, for each sampling time, W2, W3 and W4 of lactation. Most of the annotated lipids were more abundant in the breast milk provided to infants with “faster” postnatal growth.
Indeed, these milks contained higher levels of medium- or long-chain sphingomyelins and ceramides [such as Cer (d18:1/24:0), SM(d18:0/12:0)], in several phosphatidylcholines, phosphatidylethanolamines or plasmalogen-derivatives containing palmitic (C16:0) or palmitoleic
Nutrients 2018, 10, 164 11 of 28
(C16:1) acid [such as PE (16:0/16:1), PE (16:1/20:0)], stearic (C18:0) or oleic (C18:1) acid [such as PC (18:0/18:1), PC (18:0/18:2) and PE (O-18:0/20:5)], dihomo-γ-linolenic acid (DGLA, C20:3) [PE (20:3/22:6), PE (22:0/20:3)], or docosahexaenoic acid (DHA, C22:6) [PE (20:3/22:6)]. In addition, breastmilk associated with “faster” growth contained less long-chain triglycerides (TG) containing oleic acid (C18:1) [such as TG (18:1/18:1/18:2), TG (16:0/17:1/18:1) and TG (18:0/18:1/18:1)]. Finally, several eicosanoids, including many DGLA-derived oxylipins [15S-HpEDE, 11-deoxy-16, 16-dimethyl-and 9-deoxy-9-methylene-16,16-dimethyl-PGE2], 16-dimethyl-and Lyso-phospholipids (PL) [LysoPS (22:0) 16-dimethyl-and LysoPG (22:4)] were lower in the breast milk provided to preterm infants with “faster” growth. 3.3. Reliability of Maternal Milk Lipids Biomarkers Regarding Postnatal Infant’s Growth
To assess the reliability of putative biomarkers as predictors of preterm infants’ growth during hospital stay, we considered the multiple testing filtering (i.e., adjusted FDR p-value < 0.05) (Step 3), combined, only for lipidomic LC-HRMS signatures, to the multivariate selection operated by the previously described AoV-PLS/LDA model. This approach led to the selection of four fatty acids [MCSAT and oleic acid (with a p-value of 0.051), EPA and DHA] and 46 robust biomarkers of infant postnatal growth, which were annotated and are reported in bold font in Tables2and3, respectively. In addition, the reliability of these selected biomarkers to predict postnatal growth rate was evaluated using a multiple linear regression (MLR) analysis (Step 4) to explain the change in weight Z-score between birth and hospital discharge. Several confounding clinical factors (mother’s body mass index, birth weight, gestational age, complementary parenteral and enteral nutrition with the protein, lipid and energy intakes, duration of parenteral feeding and ventilation and length of hospital-stay) were introduced in MLR models. The resulting MLR p-values of all these putative biomarkers are listed in Table4.
Nutrients 2018, 10, 164 12 of 28
Table 3.Abundance (106) of annotated lipids that discriminated lipidotypes of breast milk provided to preterm infants with “faster” or “slower” growth during the W2–W4 lactation period.
Lipids mz Median [25% and 75% Percentile] from W2 to W4 Mann–Whitney Up-Value from W2 to W4
FDR Corrected q-Value from W2
to W4 “Slower” Growth (n = 38) “Faster” Growth (n = 29)
Fatty acid 9.47 (7.40–12.84) 8.39 (5.53–13.00) 0.191 0.192 Anandamide (C18:3. n-6) 339.2889 [M + NH4]+ 8.80 (7.02–11.77) 7.43 (5.11–11.47) 0.119 0.133 3-Hydroxyadipic acid 161.0455 [M−H]− 17.17 (14.02–20.25) 11.85 (5.68–15.09) 0.000 0.000 N-formylmaleamic acid 142.0203 [M−H]− 1.26 (0.84–1.64) 0.73 (0.59–0.97)c 0.000 0.000 Dodecatetraenedioic acid 221.0667 [M−H]− 0.77 (0.53–0.88) 0.55 (0.34–0.73)b 0.000 0.001 Linderic acid 187.1340 [M−H]− 0.52 (0.38–1.43) 0.76 (0.42–1.80) 0.282 0.066
alpha-hydroxy lauric acid 215.1653 [M−H]− 4.06 (2.39–8.23) 5.08 (2.51–13.03) 0.433 0.087
2-hydroxy palmitic acid 271.2281 [M−H]− 38.63 (22.48–48.63) 37.44 (29.98–50.32) 0.769 0.126
3-oxo-4-pentenoic acid 113.0243 [M−H]− 1.43 (1.18–1.71) 0.94 (0.69–1.28)c 0.000 0.000 Dehydrocholic acid 401.2312 [M−H]− 0.43 (0.21–0.73) 0.52 (0.33–0.97) 0.211 0.054 7R.9.14R-trimethyl-2E.4E.8E.10E-hexadecatetraenoic acid 289.2169 [M−H]− 0.19 (0.10–0.48) 0.27 (0.14–0.46) 0.326 0.072 Ceramide 15.56 (12.98–18.63) 20.27 (17.34–23.79)c 0.000 0.000 Cer (18:1/22:0) 622.6123 [M + H] +604.6017 [M + H-H2O]+644.5491 [M + Na]+ 1.03 (0.89–1.38) 1.36 (1.14–1.69) b 0.005 0.032 Cer (d18:1/24:0) 632.6326 [M−H2O]+ 14.59 (12.11–17.50) 18.78 (16.21–22.15)c 0.000 0.011 650.643 [M + H]+ GlucosylCeramide 511.4 (487.8–574.5) 519.5 (483.9–558.1) 0.764 0.385 Glucosylceramide (d18:2/14:0) 685.5361 [M + NH4]+ 32.05 (13.43–46.52) 26.70 (13.73–41.90) 0.519 0.343 Galactosylceramide (d18:1/18:1) 743.614 [M + NH4]+ 322.7 (309.6–355.8) 340.8 (316.5–348.9) 0.543 0.355 Galactosylceramide (d18:1/20:0) 773.652 [M + NH4]+ 31.36 (29.58–33.78) 31.52 (30.08–33.87) 0.734 0.424 Glucosylceramide (d18:1/16:0) 717.5892 [M + NH4]+ 42.06 (34.50–48.39) 42.43 (35.90–48.07) 0.9440 0.492 Glucosylceramide (d18:1/18:0) 728.5481 [M + H]+ 2.28 (1.54–2.87) 1.85 (1.18–2.24)b 0.004 0.032 Glucosylceramide (d18:1/20:0) 773.6614 [M + NH4]+ 20.89 (19.20–22.66) 19.24 (15.94–22.67) 0.092 0.116 Glucosylceramide (d18:1/24:0) 854.7266 [M + Na]+ 57.94 (54.82–62.99) 62.46 (56.55–66.47)t 0.068 0.099 Phosphocholine 357.0 (315.6–456.2) 453.3 (370.1–568.0)b 0.006 0.009 PC (18:0/18:1) 788.5863 [M + H]+ 2.59 (1.55–4.34) 4.16 (3.06–5.25)a 0.025 0.064 PC (14:0/16:0) 706.5391 [M + H]+ 1.54 (1.09–2.63) 1.830 (1.47–3.3)t 0.134 0.142 PC (14:0/16:1) 704.5237 [M + H]+ 0.20 (0.09–0.40) 0.25 (0.13–0.50) 0.277 0.224 PC (20:0/20:2) 842.636 [M + H]+ 1.49 (1.11–2.33) 2.33 (178–3.33)b 0.017 0.053 PC (16:1/18:1) 1620.1146 [M + HPO3+ 2H]+ 1.06 (0.89–1.21) 1.03 (0.89–1.14) 0.351 0.358 PC (16:1/18:0) 1542.1426 [2M + Na]+ 11.76 (8.45–13.37) 10.58 (9.23–11.88) 0.387 0.277 PC (16:1/18:2) 1512.1349 [2M + H]+ 2.33 (1.70–2.96) 3.23 (1.762–3.79)t 0.030 0.069 PC (18:0/18:1) 1576.2229 [2M + H]+ 12.09 (7.30–23.45) 16.68 (8.09–28.81) 0.150 0.153 PC (18:1/18:1) 1572.1908 [2M + H]+ 103.2 (84.86–131.5) 127.6 (99.45–164.00)a 0.036 0.074 PC (18:0/18:2) 786.5899 [M + H]+ 7.02 (5.92–9.61) 10.60 (8.13–13.21)c 0.000 0.016 PC (16:0/20:3) 784.5833 [M + H]+ 51.58 (41.81–65.60) 65.96 (52.12–85.89)b 0.004 0.030 PC (18:0/20:1) 816.6456 [M + H]+ 11.92 (7.23–18.88) 12.22 (8.59–20.67) 0.386 0.277 PC (18 :0/20 :3) 812.6143 [M + H]+ 30.80 (25.22–44.50) 46.59 (37.16–55.24)c 0.000 0.016 PC (18 :0/20 :5) 808.5806 [M + H]+ 93.34 (74.64–112.8) 94.55 (78.87–119.9) 0.343 0.256 PC (20:1/20:4) 836.6145 [M + H]+ 3.72 (2.96–4.54) 4.88 (3.77–6.26)a 0.007 0.037 PC (18:0/22:6) 834.596 [M + H]+ 11.95 (8.65–15.21) 12.61 (10.11–17.45) 0.153 0.154
Nutrients 2018, 10, 164 13 of 28
Table 3. Cont.
Lipids mz Median [25% and 75% Percentile] from W2 to W4 Mann–Whitney Up-Value from W2 to W4
FDR Corrected q-Value from W2
to W4 “Slower” Growth (n = 38) “Faster” Growth (n = 29)
PC (20:3/22:6) 856.5807 [M + H]+ 5.42 (3.95–6.97) 6.46 (5.06–7.62)a 0.013 0.047 PC (16:0/22:6) 806.5678 [M + H]+ 12.08 (7.25–16.08) 16.07 (12.04–24.40)a 0.007 0.037 PC-plasmalogen 8.16 (6.53–10.52) 8.88 (6.97–12.23) 0.273 0.236 PC (P-18:0/18:0) 796.6199 [M + Na]+ 1.72 (1.19–2.49) 2.32 (1.85–3.09)b 0.008 0.037 PC (P-16:0/18:2) 742.5723 [M + H]+ 2.18 (1.61–2.98) 1.59 (1.09–2.52]t 0.104 0.124 PC (O-16:0/18:1) 768.5514 [M + H]+ 4.11 (3.36–5.58) 4.82 (3.42–6.81) 0.114 0.131 Phosphoethanolamine 279.4(253.2–317.5) 316.5 (283.1–356.3)b 0.002 0.004 PE (16:0/16:1) 690.5054 [M + H]+ 1.79 (1.59–2.22) 2.15 (1.93–2.45)b 0.005 0.032 PE (16:1/20:0) 1492.1294 [2M + H]+ 6.72 (5.45–8.88) 8.38 (6.85–10.43)a 0.037 0.074 PE (16:0/20:2) 1488.0975 [2M + H]+ 21.16 (18.3–27.46) 27.62 (18.61–34.14)a 0.039 0.075 PE (16:0/20:2) 744.5519 [M + H]+ 142.2 (132.7–168.4) 166.6 (151.1–179.3)a 0.016 0.050 PE (16:0/20:4) 779.5379 [M + Na]+ 0.67 (0.57–0.87) 0.81 (0.61–1.19)a 0.044 0.079 PE (18:0/20:0) 776.60 [M + H]+ 1.68 (1.29–2.50) 1.52 (1.25–1.73)t 0.131 0.141 PE (20:1/20:4) 794.5676 [M + H]+ 7.45 (6.07–10.05) 9.41 (8.22–10.29)a 0.030 0.069 PE (18:0/20:4) 1536.0968 [2M + H]+ 4.93 (3.62–7.23) 7.71 (5.28–9.57)b 0.004 0.030 PE (22:0/20:3) 826.6047 [M + H]+ 2.09 (1.53–2.61) 2.51 (2.18–3.48)b 0.006 0.033 PE (18:1/18:2) 1484.067 [2M + H]+ 2.79 (1.97–3.99) 3.14 (2.07–4.36) 0.665 0.398 PE (16:0/20:4) 740.5208 [M + H]+ 7.75 (5.31–9.68) 7.18 (5.44–9.98) 0.468 0.321 PE (18:2/18:2) 740.5213 [M + H]+ 4.76(3.58–5.70) 6.21 (4.92–7.41)b 0.006 0.035 PE (20:0/18:1) 774.599 [M + H]+ 6.92 (5.61–9.12) 9.24 (7.24–11.69)b 0.004 0.030 PE (18:0/20:4) 768.5495 [M + H]+ 13.52 (12.42–14.25) 14.14 (13.13–15.75)t 0.094 0.118 PE (20:4/20:0) 796.5836 [M + H]+ 6.13 (4.98–8.72) 8.63 (6.81–10.52)b 0.007 0.035 PE (22:6/18:0) 792.5517 [M + H]+ 17.55 (12.31–22.26) 20.02 (15.51–25.01) 0.085 0.112 PE (20:3/22:6) 814.5336 [M + H]+ 2.63 (1.96–3.06) 3.14 (2.58–3.59)c 0.002 0.023 PE (22:0/22:6) 848.6566 [M + H]+ 4.69 (3.55–6.02) 4.25 (2.64–4.98) 0.131 0.141 PE (18:0/20:3) 770.5672 [M + H]+ 12.72 (10.13–16.13) 17.21 (14.84–20.82)c 0.000 0.001 PE-plasmalogen 39.91 (31.47–49.92) 38.83 (34.83–52.40) 0.592 0.385 PE (P-16:0/20:5) 722.5102 [M + H]+ 4.73 (3.96–7.45) 5.92 (4.46–7.69) 0.119 0.133 PE (P-16:0/18:0) 726.5323 [M + Na]+ 10.82 (7.93–14.26) 9.44 (5.92–13.33) 0.186 0.173 PE (P-16:0/20:0) 754.5636 [M + Na]+ 4.11 (2.58–5.23) 3.94 (2.25–4.96) 0.343 0.256 PE (P-16:0/20:3) 726.5417 [M + H]+ 10.49 (8.45–12.70) 11.39 (9.41–14.01) 0.117 0.132 PE (O-18:0/20:5) 752.5551 [M + H]+ 7.84 (6.04–9.98) 9.95 (7.30–12.09)a 0.019 0.056 Phosphatidylglycerol 16.41 (15.59–18.36) 18.85 (16.90–22.25)b 0.002 0.004 PG (16:0/16:0) 723.5101 [M + H]+ 3.31 (2.77–3.90) 3.57 (2.85–3.79) 0.475 0.324 PG (18:0/20:4) 799.5425 [M + H]+ 2.11 (1.72–2.36) 1.90 (1.48–2.25) 0.202 0.181 PG (P-16:0/22:4) 783.5586 [M + H]+ 1.58 (1.26–1.76) 1.93 (1.47–2.26)a 0.021 0.058 PG (18:2/20:5) 810.523 [M + NH4]+ 6.52 (5.64–7.40) 7.67 (6.61–9.94)b 0.001 0.016 PG (22:2/22:6) 892.5991 [M +NH4]+ 3.20 (2.97–3.61) 3.56 (3.12–3.91)a 0.035 0.074 Phosphinositol PI (36:0) PI (18:0/18:0) 889.5716 [M + Na]+ 0.92 (0.78–1.39) 1.26 (0.89–2.20)a 0.055 0.087 Phosphoserine PS (40:5) 838.552 [M + H]+ 2.72 (2.52–3.06) 2.95 (2.64–3.11) 0.186 0.173 PS (18:0/20:4) 812.5419 [M + H]+ 2.13 (1.59–2.77) 2.79 (2.29–3.26)b 0.002 0.023
Nutrients 2018, 10, 164 14 of 28
Table 3. Cont.
Lipids mz Median [25% and 75% Percentile] from W2 to W4 Mann–Whitney Up-Value from W2 to W4
FDR Corrected q-Value from W2
to W4 “Slower” Growth (n = 38) “Faster” Growth (n = 29)
Retinol 287.2362 [M + H]+ 2.02 (1.33–2.97) 1.57 (1.10–3.11) 0.752 0.429 Diacylglyceride 104.0 (66.98–163.6) 92.39 (52.86–126.5) 0.183 0.192 DG (14:0/18:3) 580.5373 [M + Na]+ 8.52 (3.30–15.47) 4.92 (2.30–9.16)a 0.025 0.064 DG (16:0/16:1) 567.4974 [M + H]+ 6.61 (3.88–7.99) 5.26 (3.05–11.07) 0.656 0.395 DG 18:0/18:1) 645.544 [M + Na]+ 7.56 (5.03–7.58) 6.90 (5.51–11.53) 0.797 0.444 DG (18:0/18:2) 638.5708 [M + NH4]+ 55.02 (36.04–87.52) 40.60 (22.83–66.09)t 0.045 0.079 DG (18:0/18:1) 634.5395 [M + NH4]+ 10.80 (5.53–17.81) 10.46 (7.75–17.81) 0.582 0.370 DG (20:4/19:0) 681.5402 [M + Na]+ 0.92 (0.47–1.60) 1.07 (0.60–2.03) 0.292 0.233 DG (20:3:/20:0) 697.5727 [M + Na]+ 4.98 (2.91–9.25) 2.74 (1.64–4.81)a 0.027 0.065 DG (18:3/20:0) 647.5574 [M + H]+ 6.81 (2.59–13.46) 4.06 (1.51–9.17)t 0.079 0.107 DG (20:4/22:5) 713.5103 [M + Na]+ 0.56 (0.24–0.79) 0.26 (0.15–0.56)a 0.040 0.076 Triglyceride 7758 (7304–8118) 7572 (7236–8496) 0.717 0.385 TG (14:0/16:1/17:2) 804.7056 [M + NH4]+ 55.94 (47.00–60.12) 59.35 (52.54–69.66)a 0.011 0.043 TG (14:0/14:1/14:1) 741.5983 [M + Na]+ 415.0 (358.3–520.8) 415.2 (371.5–448.9) 0.972 0.499 TG (14:0/16:0/16:0) 796.7277 [M + NH4]+ 337.3 (308.2–373.3) 381.5 (340.2–439.9)b 0.003 0.030 TG (14:1/14:1/18:1) 790.6895 [M + NH4]+ 1074 (923.6–1296) 1074 (911.2–1330) 0.788 0.442 TG (14:0/14:1/19:1) 806.712 [M + NH4]+ 9.17 (7.68–10.01) 9.81 (8.58–10.81)a 0.012 0.046 TG (13:0/14:1/20:5) 798.6639 [M + NH4]+ 117.1 (114.0–124.0) 118.9 (111.6–124.5) 0.743 0.427 TG (16:0/16:1/16:1) 820.7365 [M + NH4]+ 2033 (1831–2139) 2142 (1937–2447)a 0.028 0.067 TG (14:0/16:0/16:0) 801.6948 [M + Na]+ 25.93 (21.63–28.64) 29.18 (24.40–36.14)b 0.019 0.057 TG (16:1/16:1/16:1) 823.676 [M + Na]+ 257.9 (246.2–272.9) 258.8 (244.0–270.8) 0.639 0.388 TG (16:1/16:1/17:1) 832.7368 [M + NH4]+ 74.98 (64.31–82.97) 76.59 (69.19–90.90) 0.178 0.169 TG (14:0/15:0/20:5) 828.7134 [M + NH4]+ 10.48 (8.74–11.70) 11.27 (9.79–12.47) 0.178 0.169 TG (16:0/16:1/18:0) 850.7742 [M + NH4]+ 320.2 (306.7–334.3) 325.7 (308.6–364.5) 0.099 0.121 TG (16:0/17:1/18:1) 862.8205 [M + NH4]+ 3.37 (2.70–5.18) 2.93 (2.00–3.59)t 0.051 0.083 TG (16:0/16:0/18:1) 850.7655 [M + NH4]+ 12.01 (10.70–13.14) 11.06 (9.80–12.04)1 0.021 0.058 TG (16:1/16:1/17:2) 830.7291 [M + NH4]+ 10.40 (9.81–10.85) 10.65 (9.44–11.54) 0.606 0.378 TG (18:1/20:1/22:1) 986.9093 [M + NH4]+ 3.29 (2.50–4.13) 2.51 (1.83–4.16] 0.111 0.128 TG (16:1/16:1/18:2) 844.7364 [M + NH4]+ 147.3 (130.4–182.8) 182.8 (156.9–240.3)b 0.002 0.022 TG (16:1/16:1/17:2) 835.6764 [M + Na]+ 3.64 (3.20–4.61) 3.53 (3.09–3.89) 0.178 0.169 TG (16:0/16:0/16:1) 827.7101 [M + Na]+ 19.01 (15.59–21.21) 21.55 (17.11–25.06)t 0.036 0.074 TG (16:1/18:4/18:4) 862.6902 [M + NH4]+ 4.35 (2.97–6.41) 6.37 (3848–9.41)a 0.014 0.047 TG (16:0/17:2/18:1) 860.7679 [M + NH4]+ 184.9 (156.0–222.3) 190.3 (171.0–220.9) 0.320 0.247 TG (16:0/16:0/17:2) 839.7451 [M + Na]+ 1.57 (1.37–1.71) 1.47 (1.32–1.64) 0.114 0.131 TG (18:1/18:3/20:0) 935.7928 [M + Na]+ 3.76 (3.35–4.49) 4.00 (3.24–4.74) 0.639 0.388 TG (18:0/18:1/20:3) 933.7851 [M + Na]+ 19.46 (17.47–22.81) 18.90 (17.36–23.78) 0.963 0.497 TG (18:2/18:2/20:0) 930.8363 [M + NH4]+ 21.21 (18.33–23.40) 17.47(15.95–23.86)t 0.055 0.088 TG (18:0/18:1/18:1) 904.83 [M + NH4]+ 387.1 (333.1–451.4) 341.6 (267.7–385.0)a 0.015 0.049 TG (18:0/18:1/18:1) 906.8364 [M + NH4]+ 81.24 (74.07–95.84) 75.22 (56.50–84.79)a 0.025 0.064 TG (18:1/18:1/18:1) 902.8144 [M + NH4]+ 956.4 (818.7–1069) 878.3 (810.2–1074) 0.242 0.203 TG (16:0/18:0/18:1) 883.761 [M + Na]+ 41.08 (33.90–44.66) 42.83 (40.77–45.25) 0.233 0.198 TG (18:1/18:1/18:2) 900.7896 [M + NH4]+ 246.9 (224.0–277.0) 225.1 (190.1–236.1)a 0.005 0.032 TG (18:1/18:2/18:2) 898.7739 [M + NH4]+ 120.3 (75.92–128.3) 96.31 (70.34–119.4)t 0.034 0.073 TG (18:0/18:1/18:2) 902.8052 [M + NH4]+ 260.5 (233.8–281.8) 243.6 (211.4–295.7) 0.246 0.205
Nutrients 2018, 10, 164 15 of 28
Table 3. Cont.
Lipids mz Median [25% and 75% Percentile] from W2 to W4 Mann–Whitney Up-Value from W2 to W4
FDR Corrected q-Value from W2
to W4 “Slower” Growth (n = 38) “Faster” Growth (n = 29)
TG (16:0/17:1/20:5) 882.7478 [M + NH4]+ 8.63 (8.18–9.64) 8.31 (7.60–8.83)a 0.001 0.016 TG (18:1/20:1/22:3) 982.8773 [M + NH4]+ 2.52 (1.96–3.30) 1.94 (1.43–3.51) 0.119 0.133 TG(18:1/18:2/20:0) 930.8455 [M + NH4]+ 78.44 (71.25–95.93) 71.54 (58.23–93.06)t 0.059 0.091 TG(18:2/20:4/20:4) 944.7669 [M + NH4]+ 39.93 (29.65–52.66) 29.27 (22.13–49.46) 0.094 0.118 TG(18:1/20:4/20:4) 946.7742 [M + NH4]+ 8.65 (6.97–10.87) 6.77 (5.28–11.25) 0.101 0.124 TG (20:0/20:0/20:4) 989.8484 [M + Na]+ 2.27 (1.65–2.85) 1.68 (1.41–2.63) 0.106 0.125 TG (18:2/20:1/20:1) 956.8607 [M + NH4]+ 18.75 (14.96–25.95) 13.52 (11.70–23.93) 0.071 0.102 TG (18:1/20:2/20:4) 950.814 [M + NH4]+ 88.26 (75.04–95.26) 74.00 (62.15–90.20)a 0.022 0.059 TG (18:0/20:3/20:5) 953.7908 [M + Na]+ 1.89 (1.72–2.32) 1.87 (1.77–2.48) 0.897 0.477 TG (18:2/20:1/20:4) 955.8051 [M + Na]+ 2.89 (2.46–4.61) 3.50 (2.50–4.72) 0.331 0.250 TG (16:0/18:0/18:0) 880.8213 [M + NH4]+ 119.5 (108.1–154.4) 110.0 (82.96–128.8)t 0.077 0.107 TG (18:1/20:0/20:0) 967.8653 [M + Na]+ 1.69 (1.34–2.62) 1.98 (1.67–3.13) 0.331 0.250 TG (20:1/20:1/20:4) 980.8615 [M + NH4]+ 3.64 (2.69–4.41) 2.63 (2.16–4.60) 0.119 0.133 TG (18:0/20:1/20:4) 959.801 [M + NH4]+ 9.16 (8.57–10.72) 8.57 (7.13–11.61) 0.298 0.235 TG (18:0/20:3/22:0) 991.8645 [M + NH4]+ 2.61 (1.95–3.24) 1.96 (1.69–3.57) 0.153 0.154 TG (20:2/20:4/20:4) 977.7533 [M + NH4]+ 3.58 (2.55–4.31) 2.76 (2.17–4.20) 0.137 0.144 Sphingomyéline 178.6 (122.6–220.0) 188.4 (157.9–245.9] 0.480 0.363 SM (d18:0/12:0) 651.5340 [M + H]+(isotopic peak) 0.88 (0.52–1.02) 1.04 (0.68–1.54)a 0.011 0.044 SM (d18:1/12:0) 647.5119 [M + H]+ 3.80 (2.89–5.56) 5.24 (3.99–7.00)b 0.003 0.029 SM (18:1/14:0) 675.5425 [M + H]+ 72.48 (45.46–98.60) 86.28 (68.91–111.24)a 0.036 0.074 SM (d18:1/16:0) 725.5552 [M + Na]+ 41.85 (31.37–52.33) 39.63 (32.05–50.87) 0.907 0.481 SM (d18:1/16:1) 701.5583 [M + H]+ 13.98 (10.63–20.40) 15.97 (12.92–17.79) 0.574 0.367 SM (d16:1/18:1) 723.5399 [M + Na]+ 2.76 (2.15–4.12) 2.96 (2.47–3.65) 0.682 0.405 SM (18:1/20:1) 779.6015 [M + Na]+ 3.82 (3.20–4.93) 3.29 (2.50–4.30)b 0.026 0.065 SM (d18:1/20:2) 755.5768 [M + H]+ 1.49 (1.19–2.17) 1.15 (1.01–1.44)a 0.010 0.042 SM (18:1/20:1) 757.6205 [M + H]+ 13.82 (11.32–18.54) 14.51 (12.06–19.27) 1.000 0.506 SM (d18:1/23:0) 801.6827 [M + H]+ 5.97 (3.64–7.23) 7.21 (5.42–9.30)a 0.048 0.081 SM (d18:1/24:0) 815.6983 [M + H]+ 7.59 (5.81–10.37) 7.50 (5.59–9.53) 0.433 0.302 Eicosanoid 10.11-dihydro-20-trihydroxy-leukotriene B4 385.2364 [M−H]− 9.88 (6.00–12.19) 5.66 (4.12–7.09)c 0.000 0.000 20-Trihydroxy-leukotriene-B4 383.2208 [M−H]− 11.22 (4.99–24.61) 9.62 (7.27–15.02) 0.566 0.104 HETE 319.2278 [M−H]− 2.32 (1.04–0.90) 2.31 (1.31–4.47) 0.607 0.109 Leukotriene B4 335.2227 [M−H]− 0.51 (0.28–0.94) 0.32 (0.22–0.60) 0.277 0.065 7.8-epoxy-17S-HDHA 357.2051 [M−H]− 1.78 (0.80–3.71) 1.60 (0.90–2.47) 0.691 0.119 15S-HpEDE 339.2537 [M−H]− 1.68 (1.29–2.45) 1.50 (1.27–2.00) 0.292 0.068 11-deoxy-16.16-dimethyl-PGE2 363.252 [M−H]− 52.64 (32.17–70.29) 40.19 (25.54–50.40)a 0.014 0.007 9-deoxy-9-methylene-16.16-dimethyl -PGE2 377.2676 [M−H]− 1.38 (0.92–3.30) 0.99 (0.72–1.56) 0.099 0.031 PGF2alpha 353.2314 [M−H]− 4.89 (3.26–7.50) 4.12 (2.76–6.73) 0.150 0.042 11-dehydro-2.3-dinor-TXB2 339.2001 [M−H]− 2.98 (1.54–4.17) 3.29 (2.23–4.75) 0.147 0.041 Lyso-PC/PE 31.55 (25.78–38.13) 29.07 (20.34–40.91) 0.658 0.385 LysoPC (16:0) 454.2921 [M + H]+ 3.76 (2.85–4.60) 3.21 (2.42–4.48) 0.099 0.121 LysoPC (14:0) 468.3079 [M + H]+ 4.40 (3.16–6.06) 5.39 (3.52–9.12) 0.131 0.141 LysoPE (16:1) 452.3133 [M + H]+ 1.37 (1.03–1.66) 1.65 (1.25–2.02)a 0.056 0.088