Titre:
Title
:
Fine-grained nested virtual machine performance analysis through
first level hypervisor tracing
Auteurs:
Authors
: Hani Nemati, Suchakrapani Datt Sharma et Michel R. Dagenais
Date: 2017
Type:
Communication de conférence / Conference or workshop itemRéférence:
Citation
:
Nemati, H., Sharma, S. D. & Dagenais, M. R. (2017, mai). Fine-grained nested virtual machine performance analysis through first level hypervisor tracing. Communication écrite présentée à 17th IEEE/ACM International Symposium on Cluster, Cloud and Grid Computing (CCGRID 2017), Madrid, Espagne (6 pages). doi:10.1109/ccgrid.2017.20
Document en libre accès dans PolyPublie
Open Access document in PolyPublie
URL de PolyPublie:
PolyPublie URL: https://publications.polymtl.ca/2960/
Version: Version finale avant publication / Accepted versionRévisé par les pairs / Refereed Conditions d’utilisation:
Terms of Use: Tous droits réservés / All rights reserved
Document publié chez l’éditeur officiel
Document issued by the official publisher
Nom de la conférence:
Conference Name: 17th IEEE/ACM International Symposium on Cluster, Cloud and Grid Computing (CCGRID 2017)
Date et lieu:
Date and Location: 14-17 mai 2017, Madrid, Espagne Maison d’édition:
Publisher: IEEE URL officiel:
Official URL: https://doi.org/10.1109/ccgrid.2017.20 Mention légale:
Legal notice:
© 2017 IEEE. Personal use of this material is permitted. Permission from IEEE must be obtained for all other uses, in any current or future media, including
reprinting/republishing this material for advertising or promotional purposes, creating new collective works, for resale or redistribution to servers or lists, or reuse of any copyrighted component of this work in other works.
Ce fichier a été téléchargé à partir de PolyPublie, le dépôt institutionnel de Polytechnique Montréal
This file has been downloaded from PolyPublie, the institutional repository of Polytechnique Montréal
Fine-grained Nested Virtual Machine Performance
Analysis Through First Level Hypervisor Tracing
Hani Nemati
∗, Suchakrapani Datt Sharma
†, and Michel R. Dagenais
‡ Department of Computer and Software Engineering,Polytechnique Montreal, Quebec, Canada
Email: {∗hani.nemati,†suchakrapani.sharma, ‡michel.dagenais}@polymtl.ca
Abstract—The overhead and complexity of virtualization can be decreased by the introduction of hardware-assisted virtualiza-tion. As a result, the ability to pool resources as Virtual Machines (VMs) on a physical host increases. In nested virtualization, a VM can in turn support the execution of one or more VM(s). Nowadays, nested VMs are often being used to address compat-ibility issues, security concerns, software scaling and continuous integration scenarios. With the increased adoption of nested VMs, there is a need for newer techniques to troubleshoot any unexpected behavior. Because of privacy and security issues, ease of deployment and execution overhead, these investigation techniques should preferably limit their data collection in most cases to the physical host level, without internal access to the VMs.
This paper introduces the Nested Virtual Machine Detection Algorithm (NDA) - a host hypervisor based analysis method which can investigate the performance of nested VMs. NDA can uncover the CPU overhead entailed by the host hypervisor and guest hypervisors, and compare it to the CPU usage of Nested VMs. We also developed a nested VM process state analyzer to detect the state of processes along with the reason for being in that state. We further developed several graphical views, for the TraceCompass trace visualization tool, to display the virtual CPUs of VMs and their corresponding nested VMs, along with their states. These approaches are based on host hypervisor tracing, which brings a lower overhead (around 1%) as compared to other approaches. Based on our analysis and the implemented graphical views, our techniques can quickly detect different problems and their root causes, such as unexpected delays inside nested VMs.
Keywords—Nested Virtualization; KVM; Performance Analysis; LTTng; TraceCompass; Process State
I. INTRODUCTION
Virtualization is an emerging technology that enables on-demand access to a pool of resources through a Pay as Use (PaU) model. Sharing resources plays an important role for cloud computing. Many enterprises are beginning to adopt VMs in order to optimally utilize their resources. In partic-ular, application workloads vary due to time and geographic location, and cloud computing lets the end-users scale re-sources quickly with live migration. However, debugging, troubleshooting, and performance analysis of such a large-scale distributed systems still is a big challenge[1]. This challenge becomes more complicated when VMs could run another hypervisor inside (Nested VM). A nested VM is a guest that runs inside another VM on top of two or more hypevisors. The Infrastructure as a Service (IaaS) provider scheme could give the cloud user the ability of managing and using their own hypervisor as a VM. However, the diagnosis of added latency and response time of Nested VMs is quite complex due to different levels of code execution. To the best of our knowledge, there is no pre-existing efficient technique to
analyze the performance of Nested VMs. Notably, the required technique should troubleshoot unexpected behavior of Nested VMs without internal access to VMs and Nested VMs due to security issues and extra overhead.
This paper focuses on studying the behavior of nested VMs. In particular, we trace the host hypervisor to detect nested VMs and the different state of their running processes. Our technique can investigate the root cause of latency in the nested VM by just tracing the host. A massive amount of information is buried under the vCPUs of nested VMs. This information could be revealed by analysing the interaction between the host hypervisor, VM hypervisors and nested VMs. Our technique leverages existing static tracepoints inside the host hypervisor along with our added new tracepoints to convert the tracing information to meaningful visualization.
Our main contributions in this paper are: First, our analysis based on host hypervisor tracing enables the cloud administra-tor to differentiate different states (e.g., Executing Nested VM code, Guest Hypervisor Code, and Host Hypervisor Code) of nested VMs. All the tracing and analysis part is transparent to the VMs and also nested VMs. As a result, VMs and nested VMs are not being accessed during the analysis. This is critical, since in most situations, due to security reasons, access to the VMs are restricted. Second, we propose a method to detect different states of processes not only inside the VMs, but also inside nested VMs. This method can profile processes inside VMs and nested VMs. Third, we implemented different graphical views as follows: first, a graphical view for vCPU threads from the host point of view. It presents a timeline for each vCPU with different states of the VM; second, we developed a graphical view for nested VMs which shows vCPU threads of nested VMs with its level of code execution and states.
The rest of this paper is organized as follows: Section II presents a summary of other existing approaches for analysing and debugging nested VMs. Section III introduces some back-ground information about nested virtualization technology and presents the different states of applications inside the nested VMs and their requirements. In section IV, we present the algorithm used to detect nested VMs from vCPU threads of the VM that contains nested VMs. In V, we explain how we can find the different states of vCPUs of nested VMs. In section VI, we explain the different layers of the architecture that we use in our paper. We also describe the tracer that we used to gather meaningful information about the VMs. In section VII and VIII, we present our experimental results. We also propose another method for detecting VMs and we compare these two approaches in terms of overhead in section IX. Section X concludes the paper with directions for future investigations.
II. RELATEDWORK
Several monitoring and analysis tools have been enhanced for practical use. Most of them are closed-sourced and infor-mation about how they monitor VMs is a secret. Based on our knowledge, there is no tool for debugging and analyzing nested VMs. In this section we epitomize most available tools for monitoring VMs and briefly propose an approach for using them to debug nested VMs. Contemporary use of nested VMs is more for the purpose of software scaling, compatibility, and security. In addition, many network services could be virtualized (as main goal of NFV) and hosted on nested VMs. Software as a Service (SaaS) providers are the best clients of nested virtualization. SaaS providers can encapsulate their software in a nested VM on an existing cloud infrastructure (e.g, Google Cloud and Amazon AWS). Ravello[2] has im-plemented a high performance nested virtualization called as HVX. It allows the user to run unmodified nested VMs on Google cloud and Amazon AWS without any change whatso-ever. Nested virtualization is also being used for Continuous Integration (CI). CI integrates code, builds modules and runs tests when they are added to the larger code base. Because of security and compatibility issues, the building and testing phases should be run in an isolated environment. CI service providers can execute each change immediately in a nested VM.
McAfee Deep Defender is another example of nested VM use. For security reasons, it has its own virtual machine monitor (VMM). Furthermore, one of the features in Windows 7 for professional and ultimate editions is the XP mode. In this mode, a VM runs Windows XP for compatibility reason. Thus, Windows 7 users can execute Windows XP applications without any change. Correspondingly, the XP mode will be run in a nested VM if Windows 7 is running in a VM.
AWS CloudWatch[3] is a closed-sourced performance monitoring tool that can report CPU, Network, Memory, and Disk usage for Amazon EC2 cloud. Ceilometer[4] is the metering, monitoring and alarming tool in Openstack. It has basic metrics for physical CPUs like CPU time usage, average CPU utilization, and number of vCPUs for each VM. In case of nested VMs however, they can not provide any information. PerfCompass[5] is a VM fault detection tool for internal and external faults. It can detect if the fault has global or local impact. As part of their implementation, they trace each and every VM with LTTng[6]. The data is eventually used to troubleshoot VMs and find out problems like latency in I/O, memory cap problem and CPU cap problem. Their approach, however, needs to trace each VM, which significantly increases the overhead on the VMs. Their approach can be ported to nested VMs by tracing each nested VM. Nonetheless, as we will see in section IX, the overhead of tracing nested VMs is much larger than with our proposed method. Novakovic et al. [7] relies on some performance counters and Linux tools like iostat for monitoring VMs. Linux provides some performance monitoring tools like vmstat, and iostat which gather statistics by reading proc files with significant overhead. In the case where these tools for nested VMs are used, the added overhead could be significant.
In [8], they proposed a technique to investigate different states of VMs. They could find the preempted VM along with the cause of preemption. In their case, they trace each VM
and also the host kernel. After tracing, they synchronize the trace from each VM with that from the host. Then, they search through all threads to find preempted threads. Although this work can be used for nested VMs, the extra efforts required, (tracing the VMs and Nested VMs, synchronizing the traces, finding preempted VMs by searching all available threads in the host and VMs), are all time consuming. Analysing nested VMs has been addressed in [9]. They proposed a technique to analyze nested VMs using hypervisor memory forensics. Their tool can analyse nested VM setups and corresponding hypervisors, but does not provide any information about nested VMs states and their execution. In summary, no study on fine-grained performance analysis of nested VMs was found.
III. NESTEDVIRTUALMACHINESTATES
Origins of virtualization technology can be traced back to the ideas of time-shared computing introduced by IBM in the early 1970s[10]. One of the best ways to increase resource utilization on expensive servers, with powerful processors and huge amount of memory and disk space, is by using virtual-ization technology. Until recently, virtualvirtual-ization on commodity servers used to be complex and slow due to machine emulation and on-the-fly binary translation of privileged instructions. In due time, with the introduction of Hardware-assisted virtual-ization (Intel-VT and AMD-V), the overhead and complex-ity was reduced. It allows the execution of non-privileged executables of VMs directly on the physical CPU. It also provides better management of memory and for assigning I/O devices to VMs. Intel-VT (and similarly AMD-V) supports two operating modes, root mode and non-root mode for executing hypervisor code and VM code, respectively. Furthermore, non-privileged instructions of VMs are executed as non-root mode, and privileged instructions are executed as root mode (at a higher privilege level). The transaction between root mode and non-root mode is called virtual machine extensions (VMX) transition. In each VMX transition, environment specifications of VMs and the hypervisor are stored in an in-memory Virtual Machine Control Structure (VMCS). This structure is organized into six logical groups, namely guest state area, host state area, vm-execution control fields, vm-exit control field, vm-entry control field, and vm-exit information field[11].
In the transition between root mode to non-root mode, the state of the hypervisor is saved into VMCS and the environment specifications of the VM are loaded. This is also called a VM entry. On the other hand, in the transition between non-root mode to root mode, the state of the VM is saved into VMCS and the state of the hypervisor is loaded. This is called a VM exit. The Exit reason is a field in the VMCS that changes during a VM exit. It shows the reason for exiting from non-root mode to root mode.
Nested VMs are also supported by Intel and AMD pro-cessors. Figure 1 shows a single-level architecture for nested VMs. In a single-level architecture, executing any privileged instruction by any level of nested VMs returns to the host hypervisor (L0). In this case, the VM hypervisor (L1) has
the illusion of running the code of the nested VM (L2)
directly on the physical CPU. However, privileged instructions of nested VMs should be handled by the highest privileged level. Since L1 is not the highest privileged level, L0 handles
�������� ��� ����������� ��� ��� ������� ��� ��� ��� ��� ��� ����������� ��������� ���� ������ �� ������ �� �� �� �� �� ��� ��� � �� �� � � � � � � ��� � � �� �� � �
Fig. 1: Nested VM Architecture for VMX
privileged instructions, the L0 trap handler is executed. This
VMX emulation can go to any level of nesting.
Usually, there is one VMCS for each vCPU (V M CS01).
However, for one level of nested VMs there are three VMCSes per vCPU. The VM hypervisor uses V M CS12to contain the
environment specifications of nested VMs. As we mentioned before, the code of nested VM can be executed directly on the host hypervisor. In this case, the host hypervisor prepares V M CS02 to save and store the state of nested VMs at each
VM exit and VM entry. Moreover, the host hypervisor creates V M CS01to execute the code of the VM hypervisor. From the
host perspective,V M CS12is not valid, but the host hypervisor
benefits from that to update some fields inV M CS02for each
VMX transition.
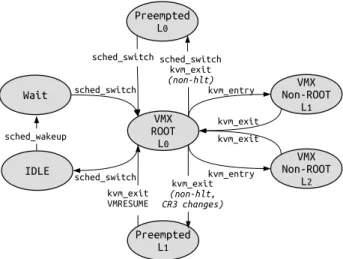
Figure 2 presents different states of a process inside a nested VM. In general, a process inside a nested VM could be in either of these states: host hypervisor as VMX Root (known as L0), VM hypervisor as VMX Non-Root (known as L1),
Nested VM as VMX Non-Root (known as L2), Preemption
in L1, Preemption in L0, Wait, and IDLE. Executing any
privileged instruction causes a VM exit all the way down to the host hypervisor. There are two possible ways of handling any privileged instruction. Along the first handling path, L0
handles the instruction and forwards it toL1. In this case,L0’s
code is executed in root mode andL1’s code is run in non-root
mode. Eventually,L1handles the exit reason and launchesL2
in non-root mode. Along the other possible path, L0 directly
forwards the control to L2. In this scenario, the exit reason
is transparent for L1 since it happens somewhere else in the
host hypervisor level[12]. A process of a nested VM is in the Running mode when it is in theL0,L1,orL2state. In contrast,
the physical CPU is not running code of a nested VM if its process is either Preemption L0, Preemption L1, or Waiting
state. This can add an unexpected delay to nested VMs since the nested VM user is not aware of being preempted or waiting for a physical CPU. We elaborate more on each state in the following subsections.
A. VMX Root - L0 State
In general, for any level of virtualization, there are two modes of execution: Root mode and Non-Root mode. In nested virtualization, a nested VM’s OS could execute most instructions directly on the physical CPU. However, privileged instructions should be run by the host hypervisor. For example, in a Linux KVM-Qemu nested VM, the KVM code of the host hypervisor is run as VMX Root. On the other side, the code of Qemu of a Nested VM and the code of KVM in the VM
��� ����� � �� ��� ����� � �� ��� � � �� �������� �������� ��������� �� ��������� �� ���� ���� !"���#���$� !"��� #��!" !"��� #��!" !"��� #��!" !"��� #��!" �������� ��������� �������� �������� ������������ �������� ����%&�� ��������' ��������'
Fig. 2: Nested Virtual Machine Process State Transition hypervisor are executed as VMX Non-Root. Executing any privileged command causes an exit to the KVM of the host hy-pervisor. In this transition, the vm exit field in VMCS contains the cause of exit. In Linux, the transition between root to non-root mode is instrumented with kvm_exit. After handling the event in VMX root mode, the VM enters the VMX non-root mode. Moreover, the Linux nested VM exit trap handler of the host hypervisor is instrumented with kvm_nested_vmexit. This event shows that the VM is executing a nested VM inside. LTTng has an appropriate module to gather all these events. B. VMX Non-Root -L1 State or L2 State
In a nested VM, after handling a privileged instruction through the host hypervisor, the execution control could either pass to the VM hypervisor or the nested VM. For some instructions,L0 handles the instruction and passes the control
to VM hypervisor for further execution. Some important VM exit that should be forwarded to L1 for further execution
are XSETBV and CPUID. In this case,L1 handles the event
and resumes L2. Executing VMRESUME by L1 traps in L0
and thus L0 resumesL2 directly by using V M CS02. Along
another handling path, L0 directly executes the nested VM
code. Some of VM exits that are mostly caused by the host hypervisor and which directly forward the control to L2
are RDSMR, RWMSR and External interrupt. In Linux, the transition from VMX Root to VMX Non-Root is instrumented by kvm_entry. For each VM entry, the CR3 register for the process in the VM is loaded from the CR3 field of VMCS. On the Intel platform, CR3 points to the process page table. We use this field of the VMCS to identify that either the nested
VM is in VMX Non-Root L1 state or VMX Non-Root L2
state. The CPU scheduler of the host hypervisor schedules in vCPU threads of nested VMs when it has something to run. It first goes to VMX Root mode, runs the code of the VM hypervisor and handles some events. In this case, the CR3 field in the VMCS is the page table address of the VM hypervisor. Finally, the VM hypervisor executes VMRESUME. The nested VM then goes to VMX Non-Root L2 state. In this state, the
CR3 value in the VMCS shows the page table address of the running process inside the nested VM.
C. Preemption - L0 State or L1 State
The Preemption state indicates that the vCPU of the nested VM is running a process, but the scheduler of the host hypervisor scheduled out the vCPU thread from a physical
CPU. This state happens often when there are not enough physical CPUs, and the ’time slice’ of a vCPU thread expires. For fairness, the CPU scheduler allocates an equal fraction of ’time slice’ for each thread inside any machine. As a result, a vCPU thread of a nested VM could be preempted inside the Host or a VM. Based on that, there are two levels of preemption for nested VMs. The first level of preemption happens inside the VM by the VM hypervisor. When there are not enough vCPUs in the VM, the vCPU scheduler of the VM starts preempting nested VMs vCPUs. Another level of preemption happens at the host hypervisor level. In this case, in order to let other vCPU threads to get the same amount of CPU time, the CPU scheduler of the host schedules out vCPU threads of nested VMs. It deteriorates further when preemption in any level is not visible inside the nested VM and it introduces unexpected delays to the completion time of tasks inside nested VMs. In Linux, the sched_switch event provides information about scheduled in and scheduled out threads, but it does not provide any detail about the time when preemption occurs.
As we mentioned above, preemption can happen at two levels. Whenever a nested VM does not have any code to execute, it voluntarily yields the physical CPU by exiting with exit reason of hlt. This lets the VM hypervisor run another process or nested VM. If the CR3 of the VM hypervisor of a nested VM changes without exiting with exit reason of hlt, the nested VM goes to the Preemption L1 state. Furthermore, if
the VM hypervisor does not have anything to run, it also exits with exit reason of hlt. If and only if a VM is scheduled out without executing hlt, the VM and all running nested VMs go to the Preemption L0 state.
D. Wait State
This state represents when a nested VM has something to execute, but it is waiting in the running queue of the host hypervisor to run on a physical CPU. It influences the completion time of a task. In Linux, the sched_wakeup event shows that a thread has woken up. The duration, between when a thread is woken up and is scheduled in, is called a Wait state.
E. IDLE State
Whenever, a nested VM does not have anything to execute, it exits from VMX Non-Root with exit reason of hlt. In this case, the host CPU scheduler schedules out the vCPU thread of the nested VM. In Linux, the CPU scheduler is instrumented by sched_switch. This event shows the scheduled out and scheduled in threads. Thus, if and only if a vCPU thread was scheduled out with exit reason of hlt, it goes to the IDLE state.
IV. NESTEDVM DETECTION BYTRACINGL0
The two states of VMX root mode and VMX non-root Mode could be uncovered by analysing sched_switch, kvm_entry, and kvm_exit events. The sched_switch event indicates when the vCPU thread of a VM is scheduled in. The sched_switch is the most important event, since it shows when a vCPU thread is running or IDLE. The
kvm_exit and kvm_entry events show when a vCPU
thread is in VMX Root mode and VMX Non-Root mode, respectively. Although finding out these states could help us to diagnose unexpected delays in VM, there is no information in
���� ���� ���� ���� �������� �������� �������� ������ �����
�����
�������� ������ �������� � ����������� ��������������� �� �������� �������� �������� ���� ���� ���� ���� �������� �������������
�������� �������� �������� � �� � � � �� ��Fig. 3: Proposed Nested VM Detection Algorithm the case of nested VMs being used. In this section we propose an algorithm to detect a nested VM from the vCPU thread of a VM in the host.
Algorithm 1 Nested VM Detection Algorithm (NDA)
1: procedure NESTED VM DETECTION(Input: event Output: Updated SHT) 2: if event ==kvm exit then
3: Modify Status attribute ofvCP Uiin VM vCPU and nested VM vCPU as
VMX root
4: exit reason = value of exit reason field
5: Modify exit reason attribute ofvCP Uias exit reason
6: end if
7: if event ==vcpu enter guest then
8: CR3 = store value of CR3 field
9: if exit reason == VMLAUNCH or exit reason == VMRESUME then 10: candidate nestedVM process=CR3
11: else
12: candidate nestedVM = CR3 13: candidate process = CR3 14: end if
15: end if
16: if event ==kvm nested vmexit then
17: Mark last CR3 in candidate nestedVM process as nestedVM process 18: Mark last CR3 in candidate nestedVM as VM hypervisor 19: end if
20: if event ==kvm entry then
21: vcpu = value of vcpu id field
22: if CR3 marked as nestedVM process then
23: Modify Status attribute of nestedVM process asL2Nested VM non-root
24: end if
25: if CR3 marked as VM hypervisor then
26: Modify Status attribute of nestedVM process asL1 VM hypervisor non-root
27: else
28: Modify Status attribute of VM process as VM Process non-root 29: end if
30: Modify Status attribute ofvCP Uias VMX non root
31: end if 32: end procedure
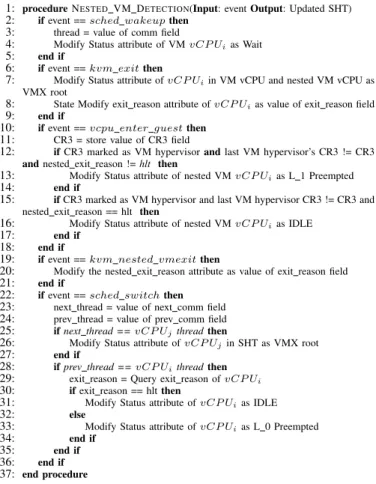
Figure 3 depicts how we are able to uncover a nested VM and its activity. In each VMX transition, we retrieve the CR3 value of a VM using a new tracepoint. We added a new tracepoint, vcpu_enter_guest, to extract the CR3 register from the guest area of the VMCS. Then, in order to detect the level of code execution, we exploit the Nested VM Detection Algorithm (NDA) by mapping the information coming from the VMCS and running thread. The pseudocode of the NDA Algorithm is shown in Algorithm 1. It receives an event as input and updates the State History Tree (SHT) with meaningful information as output (Line 1). The SHT is tree shaped database that we use to build our data model. As
mentioned before, all the events that cause a kvm_exit are handled by L0and the state of the nested VM changes to VMX
Root mode (Line 3). We also modify the exit reason attribute of the vCPU in the SHT (Line 5). When the NDA algorithm receives the vcpu_enter_guest event, it queries the last exit reason from the SHT. If the last exit is VMLAUNCH or VMRESUME, it pushes the CR3 value to a candidate nested VM process stack (Line 10). In other cases, the CR3 value is pushed to the stacks of a candidate nested VM hypervisor and a candidate VM process (Line 12-13).
The kvm_nested_guest is the most important event, since it shows that either the running vCPU thread is a nested vCPU or VM vCPU. When the NDA algorithm detects the event on a pCPU, it marks the thread as a nested VM vCPU, the CR3 value in the candidate nested VM process stack as a nested VM process, and the CR3 value in the candidate nested VM hypervisor stack as a VM hypervisor. (Line 19-19). When receiving vm_entry, the NDA algorithm queries if the CR3 value is marked as either a nested VM process, VM hypervisor, or VM process. Based on the outcome, it modifies the Status attribute of the vCPU corresponding to the level of code execution (Line 20-31).
Algorithm 2 Nested VM State Detection (NSD) Algorithm
1: procedure NESTED VM DETECTION(Input: event Output: Updated SHT) 2: if event == sched wakeup then
3: thread = value of comm field
4: Modify Status attribute of VM vCP Uias Wait
5: end if
6: if event == kvm exit then
7: Modify Status attribute of vCP Uiin VM vCPU and nested VM vCPU as VMX root
8: State Modify exit reason attribute of vCP Uias value of exit reason field
9: end if
10: if event == vcpu enter guest then 11: CR3 = store value of CR3 field
12: if CR3 marked as VM hypervisor and last VM hypervisor’s CR3 != CR3 and nested exit reason != hlt then
13: Modify Status attribute of nested VM vCP Uias L 1 Preempted
14: end if
15: if CR3 marked as VM hypervisor and last VM hypervisor CR3 != CR3 and nested exit reason == hlt then
16: Modify Status attribute of nested VM vCP Uias IDLE
17: end if 18: end if
19: if event == kvm nested vmexit then
20: Modify the nested exit reason attribute as value of exit reason field 21: end if
22: if event == sched switch then 23: next thread = value of next comm field 24: prev thread = value of prev comm field 25: if next thread == vCP Ujthreadthen
26: Modify Status attribute of vCP Ujin SHT as VMX root
27: end if
28: if prev thread == vCP Uithreadthen
29: exit reason = Query exit reason of vCP Ui
30: if exit reason == hlt then
31: Modify Status attribute of vCP Uias IDLE
32: else
33: Modify Status attribute of vCP Uias L 0 Preempted
34: end if 35: end if 36: end if 37: end procedure
V. NESTEDVM STATEDETECTION BYTRACINGL0
As we mentioned in the previous section, each vCPU could
be in one of VMX Root, VMX Non-Root L1, VMX
Non-Root L2, Preemption L0, Preemption L1, Wait ,or IDLE states.
Among the aforementioned states, only in the VMX Non-Root L2 state is the actual code of the nested VM being executed
directly on a physical CPU. Other states increase completion time of the task inside a nested VM. As a result, finding these states lets the cloud administrator diagnose VMs and their nested VMs better. When a VM or nested VM does not have any code to execute, it exits with hlt exit reason. If and only if a VM or nested VM is scheduled out from a pCPU without exiting with the hlt reason, it implies preemption. By observing where this preemption occurs, we are able to distinguish whether it was preempted by the scheduler of the VM or host. We used some existing kernel tracepoints, and one added tracepoint, to detect the different states of the nested VMs as follows.
The Nested VM State Detection (NSD) algorithm is shown in Algorithm 2. It updates the SHT after extracting meaningful information from incoming events (Line 1). Initially, when it receives the sched_wakeup event, it modifies the Status attribute of the VM as Wait (Line 2-5). The exit reason for the VM and nested VM is adjusted according to the kvm_exit and kvm_nested_vmexit events, respectively (Line 3-5). The L1preemption detection happens when the NSD receives
the vcpu_enter_guest event. It first inquires whether the CR3 value is a CR3 of the VM hypervisor and it has been changed or not. In case the CR3 has changed, if the last nested exit reason was not hlt (exit reason 12), it interprets it as L1the preemption state ( Line 13). The vCPU of the nested
VM is IDLE when the last exit reason is hlt (Line 16). The sched_switch is being used to identify if a nested VM vCPU is in VMX Root, IDLE, or L0 preemption. First, the
vCPU thread goes to VMX Root state if the next thread is a vCPU thread (Line 26). If the former thread was a vCPU thread, the NSD algorithm investigates if the last exit reason was hlt. In case the last exit reason was not hlt, the VM vCPU with all its nested VMs goes to the L0 state (Line 33). The
IDLE state is when the vCPU thread is scheduled out with exit reason of hlt (Line 31).
VI. ARCHITECTURE
We use the KVM module in Linux under the control of Openstack as part of our architecture. KVM is the most com-monly used hypervisor for Openstack[13]. For the userspace part of the hypervisor, we installed Qemu to execute the operating system support for the VM. We also use the same architecture for nested VMs and VM hypervisors. Our archi-tecture is shown in Figure 4. As we can see, events are gathered by our tracer (LTTng) from the host hypervisor first, and then the events are sent to trace analyser (TraceCompass)
Host Kernel Trace KVM Module Trace LTTng TraceCompass Openstack Virtual Machine VM Kernel KVM Module Host Kernel KVM Module Nested VM #1 Hardware Nested VM #n
Fig. 4: Architecture of our implementation A. Tracer
Among all tracers in Linux, we choose a lightweight tracing tool called the Linux Tracing Toolkit Next Generation
(LTTng)[6] due to its low overhead kernel and userspace tracing facilities. Furthermore, in Linux, the KVM module is instrumented with static tracepoints and LTTng has appropriate kernel modules to gather them. Therefore, LTTng is particu-larly suitable for our experiment since it gathers Linux kernels and KVM module events with a low impact on VMs. After the relevant events are generated and collected by LTTng, we study those with the trace analyser, as elaborated in the next subsection.
Fig. 5: State History Tree being used to store different infor-mation of VMs and nested VMs
B. Trace Analysis
We implemented our event analyser in TraceCompass[14]. TraceCompass is an Open-source software for analyzing traces and logs. It provides an extensible framework to extract metrics, and to build views and graphs. Figure 5 presents the structure we use as our data model to store relevant information about VMs and their nested VMs. This structure can store and retrieve all the necessary information about VM’s vCPU, VM’s Threads, and VM’s nested VMs. In addition, other levels of nested VMs can be recorded inside the nested VM attributes subtree, recursively. Each attribute has a time dimensional aspect which changes during time intervals. We benefit from the information in our data model to build various visualizations for displaying useful information to a cloud administrator. We use the State History Tree (SHT) from TraceCompass to build our data model. The SHT is a tree shaped disk database of logical nodes with logarithmic access time[15]. Once the SHT is constructed from incoming events, we can browse and navigate through the attributes along the time axis, by querying the SHT.
VII. PERFORMANCEANALYSIS- NESTEDVM DISSECTION
In this section, we show the result of our analysis to detect a nested VM and different levels of code execution (e.g., L0,
L1, L2). Our experimental setup is described in Table I. The
Qemu version is 2.5 and the KVM module is based on Linux kernel 4.2.0-27. We use Sysbench for benchmarking different resources of the nested VM. We setup a VM with a nested VM inside and run Sysbench to generate a small workload.
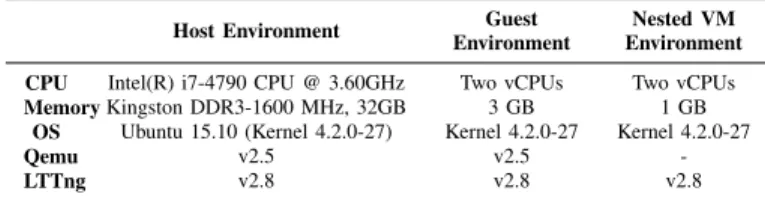
TABLE I: Experimental Environment of Host, Guest, and NestedVM
Host Environment Guest Environment
Nested VM Environment CPU Intel(R) i7-4790 CPU @ 3.60GHz Two vCPUs Two vCPUs Memory Kingston DDR3-1600 MHz, 32GB 3 GB 1 GB
OS Ubuntu 15.10 (Kernel 4.2.0-27) Kernel 4.2.0-27 Kernel 4.2.0-27
Qemu v2.5 v2.5
-LTTng v2.8 v2.8 v2.8
As we can see from Figure 6, VM testU1 has two vCPUs and is running some code on its CPU0. From the VM’s perspective, each vm entry is VMX non-root mode and each vm exit is VMX root mode. Using our analysis, we are able to detect a nested VM inside the testU1 VM and also find out when code of the host hypervisor, VM hypervisor, and nested VM is executing. This analysis is used for investigating the overhead of nested virtualization.
VIII. USECASES- IDENTIFYINGUNEXPECTEDDELAY
In this section, we show how our analysis could reveal unexpected delays in nested VMs. For these experiments, we configure our testbed as explained in section VII. We set Sysbench to run 60 times and compute the first 1000 prime numbers. After each task execution, it waits for 600 ms and then redoes the task. We start a VM with two vCPUs and a nested VM with two vCPUs inside. We pin the nested VM’s vCPUs to the vCPU 0 of the VM and we pin the vCPUs of the VM to the pCPU 0 of the host. We do this to ensure that the code of nested VMs executes on pCPU 0. As expected, the execution time for same task should be almost equal. On average, the completion time for finding the first 1000 prime numbers is 327 ms, with standard deviation of 8 ms.
In the next experiment, we launch two nested VMs in VM testU1. Both nested VMs have two vCPUs that are pinned to vCPU 0 of the VM. The rest of the configuration is kept the same as in the previous experiment, with the exception of Sysbench executing in the nested VM2, being configured to wait 1 sec after each execution. We start Sysbench at the same time for both nested VMs and we start tracing the nested VM1 with LTTng. In our investigation with LTTng, we realized that the execution time for the same task varied more than expected. Figure 7 shows the execution time for the same load. We see that it varies between 339 and 661 ms. The execution time for 60 executions of the same load is 465 ms with a standard deviation of 120 ms. This delay could cause serious problems for real time applications. To investigate the cause of the execution time variation, we traced the host and used our NSD algorithm to detect the different states of nested VMs. Figure 8 shows the result of our analysis as a graphical view. By tracing only the host, we first detect that the testU1 VM is running two nested VMs. Then, we further find out when the code of each nested VM is running on the physical CPU. By looking at the view, we can infer that, during the execution, two nested VMs are preempting each other several times. For more details, we zoom in a section where the two nested VMs are preempting each other and can observe the events along with fine grained timing. This preemption occurs at the VM hypervisor level and is more or less imperceptible by the host hypervisor.
Fig. 6: Detecting different state of Nested VM
Fig. 7: Execution time of the prime thread (CPU view)
Fig. 8: Resource view of CPU for two nested VMs inside VM testU1 by host tracing - L1 Level Preemption
Fig. 9: Resource view of CPU for one nested VM inside VM testU1 preempted by testU2 by host tracing - L0 Level Preemption In the next experiment, we turn off one of the nested
VMs and launch two other VMs in the host. We configure our VMs and Nested VM the same as before, except now we set Sysbench to wait 800 ms after each execution in the VMs. Our investigation shows that the completion time on average for 60 runs of the same load on the nested VM is 453 ms, with a standard deviation of 125 ms. We traced the host hypervisor and exploit our NSD algorithm to investigate the problem further. As Figure 9 shows, the nested VM inside VM testU1 is being preempted. In this experiment, the preemption occurs at the host hypervisor level, when VMs are preempting each other.
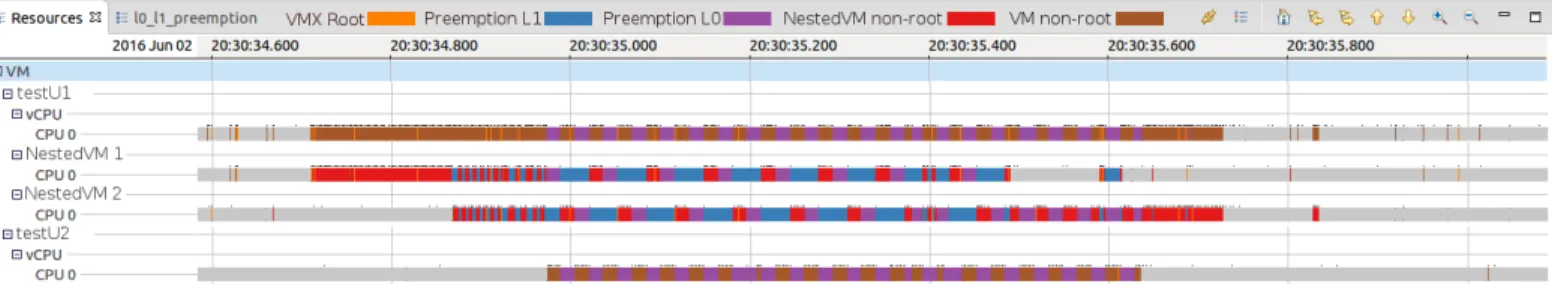
In the next experiment, we launch another nested VM inside VM testU1 (NestedVM 2). We also start VM testU2 and set Sysbench to find the first 1000 prime numbers, like in the previous experiment. In this experiment, each VM and nested VM have one CPU and all CPUs are pinned to pCPU 0. We start the test at the same time for the VM and all nested VMs. As a result of this experiment, we find that the completion time for the same task varies a lot. On average, the execution time for each task takes 651 ms, compared to 327 ms in the first experiment. Moreover, the standard deviation for 60 Sysbench runs was 371 ms. We investigated the cause of this problem by executing the NSD algorithm. Figure 10 shows that nested
VMs were preempting each other along with VM testU2. In this test, we have preemptions from L0 andL1, which cause
serious delays in the completion time of tasks. It is worth mentioning that none of these observed preemptions, at any level, are detectable with conventional state-of-the-art tools.
IX. OVERHEADANALYSIS
In this section, we first propose two new approaches to detect different states of nested VMs. Then, we compare these two approaches with the NSD algorithm in terms of added overhead to nested VMs.
The first approach is to trace the host and guest hypervisors (L1L0). Another technique is to trace both hypervisors and
each nested VM (L2L1L0). In both approaches, the cloud
administrator needs authorization to access each VM and Nested VM. Table II presents the added overhead to nested VMs for the different algorithms. We configured the Sysbench benchmark to study the overhead by running 60 times for CPU, Disk I/O, and Memory intensive evaluations. Then, we averaged all results to avoid unexpected latency in our analysis. We enabled all the necessary events for each analysis. It is worth mentioning that other approaches need to access VMs and nested VMs, as compared to our new proposed approach which is purely a host hypervisor based algorithm. As shown
Fig. 10: Resource view of CPU for two different nested VMs inside VM testU1 preempted by VM testU2 and each other by host tracing - L0 and L1 Levels Preemption
in the table, our approach adds less overhead to nested VMs since it just traces the host hypervisor. In the CPU and Memory intensive workloads, we add negligible overhead. For the I/O intensive evaluation, the overhead is 34.6 %, which is expected since LTTng is also using the same Disk to store trace. Indeed, the performance of a disk degrades significantly when two processes compete to access the disk since each may have an efficient sequential access load, but the mix of the two becomes an inefficient seemingly random access load. This is a well know problem and using a separate disk for storing tracing data is recommended whenever I/O bound processes are being traced.
TABLE II: Comparison of our approach and the other multi-level tracing approaches in term of overhead for synthetic loads
Benchmark BaselineL2L1L0 L1L0 NSD Overhead(%) L2L1L0 L1L0 NSD
File I/O (ms) 546 809 773 735 48.2 41.5 34.6 Memory (ms) 497 505 503 502 1.6 1.2 1
CPU (ms) 334 351 340 339 4.9 1.8 1.4
X. CONCLUSION
Nested virtualization is frequently used for software scal-ing, compatibility, and security in industry. However, in the nested virtualization context, current monitoring and analysis tools do not provide enough information about VMs for effective debugging and troubleshooting. In this paper, we address the issue of efficiently analyzing the behavior of such VMs. Our technique can detect different problems along with their root causes in nested VMs and their corresponding VMs. Furthermore, our approach can uncover different levels of code execution along all the host and nested VMs layers. Our approach is based exclusively on host kernel tracing, which adds less overhead as compared to other approaches. Our benchmarks show that the added overhead in our approach was around 1%. In contrast, the overhead of other approaches ranged from 1.2 to 4.9%. We also proposed a way to effectively visualize the different levels of code execution in nested VMs along with their state. These graphical views also show high resolution timing of all VMs and nested VMs executions. As future work, we plan to explore more faults in nested VMs such as I/O and memory access latency. In addition, our current technique can also be enhanced to further investigate interference between nested VMs.
REFERENCES
[1] Giuseppe Aceto et al. “Cloud monitoring: A survey”. In: Computer Networks 57.9 (2013), pp. 2093–2115.
[2] Ravello Systems: Virtual Labs Using Nested Virtualiza-tion. https://www.ravellosystems.com/. Accessed: 2016-06-01.
[3] Amazon CloudWatch. https : / / aws . amazon . com / cloudwatch/. Accessed: 2016-04-18.
[4] OpenStack telemetry measurements Metrics definition. http://docs.openstack.org/admin-guide-cloud/telemetry-measurements.html. Accessed: 2016-03-15.
[5] D. Dean et al. “PerfCompass: Online Performance
Anomaly Fault Localization and Inference in
Infrastructure-as-a-Service Clouds”. In: IEEE
Transactions on Parallel and Distributed Systems PP.99 (2015), pp. 1–1. ISSN: 1045-9219.
[6] Mathieu Desnoyers and Michel R. Dagenais. “The LT-Tng tracer: A Low Impact Performance and Behavior Monitor for GNU/Linux”. In: OLS (Ottawa Linux Sym-posium) 2006. 2006, pp. 209–224.
[7] Dejan Novakovi´c et al. “DeepDive: Transparently Iden-tifying and Managing Performance Interference in Vir-tualized Environments”. In: USENIX Conference on An-nual Technical Conference. USENIX Association, 2013, pp. 219–230.
[8] Mohamad Gebai, Francis Giraldeau, and Michel R Da-genais. “Fine-grained preemption analysis for latency investigation across virtual machines”. In: Journal of Cloud Computing. December 2014, pp. 1–15.
[9] Mariano Graziano, Andrea Lanzi, and Davide
Balzarotti. “Hypervisor Memory Forensics”. In: Research in Attacks, Intrusions, and Defenses: 16th International Symposium,2013, pp. 21–40.
[10] A Brief Review of VMs’ 40 Year History. http://www. vm.ibm.com/vm40hist.pdf. Accessed: 2016-06-01. [11] Intel Corporation. “Intel 64 and IA-32 Architectures
Software Developers Manual”. In: December 2015, pp. 1–3883.
[12] Muli Ben-Yehuda et al. “The Turtles Project: Design and Implementation of Nested Virtualization”. In: 9th USENIX Symposium on Operating Systems Design and Implementation (OSDI 10). Vancouver, BC: USENIX Association, 2010.
[13] Open source software for creating clouds. https://www. openstack.org/. Accessed: 2016-04-1.
[14] Trace Compass. https : / / projects . eclipse . org / projects / tools.tracecompass. Accessed: 2016-04-3.
[15] A. Montplaisir-Goncalves et al. “State History Tree: An Incremental Disk-Based Data Structure for Very Large Interval Data”. In: Social Computing (SocialCom), 2013 International Conference on. Sept. 2013, pp. 716–724.