HAL Id: hal-01018382
https://hal.sorbonne-universite.fr/hal-01018382
Submitted on 27 Aug 2014HAL is a multi-disciplinary open access archive for the deposit and dissemination of sci-entific research documents, whether they are pub-lished or not. The documents may come from teaching and research institutions in France or abroad, or from public or private research centers.
L’archive ouverte pluridisciplinaire HAL, est destinée au dépôt et à la diffusion de documents scientifiques de niveau recherche, publiés ou non, émanant des établissements d’enseignement et de recherche français ou étrangers, des laboratoires publics ou privés.
Effect of protein adsorption on the corrosion behavior of
70Cu-30Ni alloy in artificial seawater
Blanca E. Torres Bautista, Maria L. Carvalho, Antoine Seyeux, Sandrine
Zanna, Pierangela Cristiani, Bernard Tribollet, Philippe Marcus, Isabelle
Frateur
To cite this version:
Blanca E. Torres Bautista, Maria L. Carvalho, Antoine Seyeux, Sandrine Zanna, Pierangela Cristiani, et al.. Effect of protein adsorption on the corrosion behavior of 70Cu-30Ni alloy in artificial seawater. Bioelectrochemistry, Elsevier, 2014, 97, pp.34-42. �10.1016/j.bioelechem.2013.10.004�. �hal-01018382�
Effect of protein adsorption on the corrosion behaviour of 70Cu-30Ni alloy
in artificial seawater
Blanca E. Torres Bautistaa, Maria L. Carvalhob, Antoine Seyeuxa, Sandrine Zannaa, Pierangela Cristianib, Bernard Tribolletc, Philippe Marcusa, Isabelle Frateura,c,*
a
Laboratoire de Physico-Chimie des Surfaces, UMR 7045 CNRS-ENSCP, Chimie ParisTech, 11 rue Pierre et Marie Curie, F-75005 Paris, France
b
RSE SpA, Ricerca sul Sistema Energetico, Dipartimento Ambiente e Sviluppo Sostenibile, Via Rubattino 54, 20134 Milano, Italy
c
Laboratoire Interfaces et Systèmes Électrochimiques, UPR 15 CNRS, Université Pierre et Marie Curie, 4 place Jussieu, F-75252 Paris Cedex 05, France
*Corresponding author. e-mail: isabelle.frateur@upmc.fr
Tel.: +33 1 44 27 72 15; fax: +33 1 44 27 40 74; postal address:
Laboratoire Interfaces et Systèmes Électrochimiques, UPR 15 CNRS, Université Pierre et Marie Curie, Case courrier 133, 4 place Jussieu, F-75252 Paris Cedex 05, France
e-mail addresses of other authors:
blanca-torres@chimie-paristech.fr MariaLeonor.Carvalho@rse-web.it antoine-seyeux@chimie-paristech.fr sandrine-zanna@chimie-paristech.fr Pierangela.Cristiani@rse-web.it bernard.tribollet@upmc.fr philippe-marcus@chimie-paristech.fr
Abstract
Copper alloys often used in cooling circuits of industrial plants can be affected by biocorrosion induced by biofilm formation. The objective of this work was to study the influence of protein adsorption, which is the first step in biofilm formation, on the electrochemical behaviour of 70Cu-30Ni (wt. %) alloy in static artificial seawater and on the chemical composition of oxide layers. For that purpose, electrochemical measurements performed after 1 h of immersion were combined to surface analyses. A model is proposed to analyse impedance data. In the presence of bovine serum albumin (BSA, model protein), the anodic charge transfer resistance deduced from EIS data at Ecorr is slightly higher,
corresponding to lower corrosion current. Without BSA, two oxidized layers are shown by XPS and ToF-SIMS: an outer layer mainly composed of copper oxide (Cu2O redeposited layer) and an inner layer mainly composed of oxidized nickel, with a global thickness of ~ 30 nm. The presence of BSA leads to a mixed oxide layer (CuO, Cu2O, Ni(OH)2) with a lower thickness (~ 10 nm). Thus, the protein induces a decrease of the dissolution rate at Ecorr and
hence a decrease of the amount of redeposited Cu2O and of the oxide layer thickness.
1. Introduction
Power plants require cooling circuits with water as the cooling agent; therefore, they are generally located on seacoasts owing to the ready availability of abundant seawater. Tubes are the basic components of heat exchangers; they provide the heat transfer surface between one fluid flowing inside the tubes and other fluid flowing outside the tubes [1]. In cooling circuits, the water is usually circulating but, frequently, plant outages cause provisional stagnant condition that can persist for hours or, at worst, for days. This condition is of particular concern for corrosion risk, especially at the beginning of plant operation [2]. Therefore, hydrodynamics is one of the parameters to be studied.
Copper and copper alloys are commonly used in condensers and heat exchangers due to their high thermal conductivity, good resistance to corrosion and good mechanical workability. Cu-Ni alloys are preferred in marine environments because of their corrosion resistance due to the formation of a thin, adherent, protective surface film which forms naturally and quickly upon exposure to clean seawater. That surface film is predominantly made up of cuprous oxide, often containing nickel and iron oxides, cuprous hydroxychloride and cupric oxide; it becomes more complex when aggressive condition from the water causes corrosion [2].
Cooling circuits of industrial plants are ideal incubators for microorganisms because they offer plenty of water, are maintained at temperatures between 30 and 60°C, at pH of 6 to 9, and provide a continuous source of nutrients, such as inorganic or organic compounds. The microorganisms present in cooling water circuits can be divided into planktonic or sessile cells. Sessile ones attach to surfaces and form what is known as biofilm. The development of a biofilm is considered to be a multistage process involving the following major steps: a) formation of an organic conditioned film on the solid surface by adsorption of biomolecules such as proteins [3], b) transport of microorganisms from the water to the surface, c) adhesion of microorganisms onto the surface, d) replication of the attached cells and production of exopolymers, e) detachment of parts of the biofilm that are swept along by the flowing water to repeat the process of biofilm formation elsewhere [4]. Biofouling is hence a consequence of biofilm formation. The significant negative effects of biofouling are the blockage of water free flow in the cooling circuit and consequent mechanical damage to pumps, clogging of condenser tubes, reduction of the heat transfer efficiency and microbially induced corrosion (MIC) also called biocorrosion [5,6]. Cu-Ni alloys have also shown good resistance to biofouling; the reason for the antifouling behaviour of these alloys is still not fully understood but the protective surface film should play a role [7].
There are two opposite goals for the control of microbial adhesion and biofilm formation: one is the prevention of biofilms, and the other one is their promotion. Controlling the adsorption of biomolecules, which is the first step in biofilm formation, by modifying the surface properties of the material may represent a good strategy for inhibiting microbial growth [8]. The global objective of this work was to study the influence of biomolecules adsorption on the electrochemical behaviour of 70Cu-30Ni (wt. %) alloy and the chemical composition of oxide layers in seawater environment, in different hydrodynamics conditions (static conditions, and using a rotating electrode). For that purpose, artificial seawater (ASW) was chosen, either without any biomolecule or added with bovine serum albumin (BSA), a model protein often used to study the protein-surface interactions due to its low cost and to a good knowledge of its properties [9-11]. Electrochemical measurements (corrosion potential (Ecorr) vs time, polarization curves and electrochemical impedance spectroscopy (EIS)) performed, in
immersion time) were combined to surface analysis by X-ray photoelectron spectroscopy (XPS) and time-of-flight secondary ions mass spectrometry (ToF-SIMS). Electrochemical measurements in well-controlled hydrodynamics conditions, using a rotating electrode, have been performed, and will be the purpose of a forthcoming paper. Although 1 h immersion time is a short time for the formation of oxides, it is not a short time for the adsorption of BSA since an adsorption plateau (steady-state) is reached within 10-20 min [11-13].
2. Materials and methods
2.1 Samples and solution
The material under study was 70Cu-30Ni alloy (Cu 68.5, Ni 30, Mn 0.8, Fe 0.7 wt. %). The samples provided by RSE S.p.A. were disks cut from real new condenser tubes, and then flattened at Chimie ParisTech. The geometrical surface area exposed to the solution was either 0.45 cm2, and the tightness between the disk and the sample holder was ensured by a Viton® O-ring. Before electrochemical measurements, samples were mechanically polished with SiC papers down to grade 1200, then degreased in an ultrasonic bath three times in acetone for 10 min, once in ethanol for 10 min, and once in ultra-pure water for 10 min, dried under an argon flow, and finally exposed to UV for 20 min. Before surface analysis, samples were mechanically polished first with SiC papers down to grade 1200, then with 6 μm, 3 μm, and 1 μm diamond paste. Their subsequent treatment was the same as before electrochemical measurements.
The solution used was aerated artificial seawater (ASW; composition (g/L): NaCl (24.615), KCl (0.783), Na2SO4 (4.105), MgCl2(H2O)6 (11.060), CaCl2 (1.160), NaHCO3 (0.201); pH = 8.0; ionic strength = 0.7155 M), without and with 20 mg.L-1 of BSA (about 99% purity (Fraction V) ; Sigma-Aldrich).
All the experiments were performed at room temperature.
2.2 Electrochemical measurements
The electrochemical measurements were performed with a three-electrode cell, designed and manufactured at Chimie ParisTech, with a volume of solution of about 0.1 L. The working electrode was the 70Cu-30Ni alloy (disk samples), the counter-electrode was a platinum wire, and the reference electrode was a saturated calomel electrode (SCE; 0.245 V vs SHE). Experiments were carried out in stagnant conditions (static working electrode and solution). The corrosion potential (Ecorr) was measured during the first hour of immersion, then cathodic
or anodic polarization curve was plotted separately starting from +20 or -20 mV vs Ecorr,
respectively, using a scan rate of 0.5 mV.s-1. Electrochemical impedance diagrams were plotted at Ecorr after 1 h of immersion, with a frequency domain ranging from 105 Hz to 10-3
Hz, 7 points per decade, and an amplitude of 10 mV peak-to-peak. Electrochemical measurements were performed with an EC-Lab SP-200 system from Bio-Logic.
2.3 Surface analysis
Three 70Cu-30Ni samples were analyzed by XPS and ToF-SIMS: 1) after polishing, 2) after 1 h of immersion at Ecorr in ASW without BSA, and 3) after 1 h of immersion at Ecorr in ASW
ultra-pure water three times to remove the BSA molecules loosely bound to the surface, then dried with argon before introduction in the fast-entry lock chamber of the XPS spectrometer.
XPS analyses were performed with a Thermo Electron Escalab 250 spectrometer, using a monochromatised Al Kα X-ray source (1486.6 eV). The analyser pass energy was 100 eV for survey spectra and 20 eV for high resolution spectra. The spectrometer was calibrated using Au 4f7/2 at 84.1 eV. The following core levels were recorded: Cu 2p (and Auger lines), Ni 2p, O 1s, C 1s, and N 1s. All spectra were referred to the C 1s peak for the carbon involved in C-C and C-H bonds, located at 285 eV. The fitting of the complex C 1s signal was based on published data [11]. Curve fitting of the spectra was performed with the Thermo Electron software “Avantage”. The inelastic mean free path values were calculated by the TPP2M formula [14], and the photoemission cross-sections were taken from Scofield [15].
ToF-SIMS analyses were done using a ToF-SIMS V spectrometer (ION-TOF GmbH). The analysis chamber was maintained at less than 10−9 Pa in operation conditions. The depth profiles were performed using the instrument in dual beam mode. A pulsed 25 keV Bi+ primary ion source (LMIG) at a current of 1.2 pA (high mass resolution mode), rastered over a scan area of 100×100 μm², was used as the analysis beam. The sputtering was performed using a 1 keV Cs+ ion beam at a current of 50 nA, and rastered over an area of 300×300 μm². The depth profiles were obtained in negative polarity meaning only negative ions were analysed. The distribution of the ionized fragments, all measured quasi-simultaneously, were plotted versus Cs+ ion sputtering time. The intensity was reported using a logarithmic scale, which gave equal emphasis to signals of all intensities. The variation of the ion intensity with sputtering time reflects the variation of the in-depth concentration but is also dependent on the matrix from which the ions are emitted. Data acquisition and processing were performed using the IonSpec software.
3. Results
3.1 Electrochemical measurements
During the first hour of immersion, the corrosion potential Ecorr decreases till reaching a
steady-state value of -0.230 ± 0.011 V vs SCE without BSA. The presence of 20 mg.L-1 of BSA induces a more anodic Ecorr value (-0.203 ± 0.008 V vs SCE i.e. difference of ~ 30 mV
with the value found without protein).
Figure 1(a) shows the cathodic polarization curves obtained without and with 20 mg.L-1 of BSA. Two current plateaus illustrating mass transport limited reactions can be observed. The short plateau at around -0.30 V vs SCE (|j| ~ 10 μA.cm-2) illustrates the first step of dissolved oxygen reduction with production of H2O2, that can be written at pH = 8.0 as follows [16,17]:
O2 + 2H2O + 2e−→ H2O2 + 2OH− (1)
The wide plateau observed for potentials ranging from -0.40 to -1.00 V vs SCE corresponds to the second step of dissolved oxygen reduction with transfer of 4 electrons, that can be written at pH = 8.0 as follows:
The ratio between the two plateau current densities is comprised between 2 and 3 (theoretical value: 2). This observation is consistent with the presence on the alloy surface of a layer composed of reducible products (oxides) in the oxygen reduction domain.
The current increase (in absolute value) observed below -1.00 V vs SCE illustrates water reduction (hydrogen evolution reaction).
The second plateau current density is divided by 2 in the presence of the protein (|j| ~ 40 μA.cm-2
without BSA to be compared to |j| ~ 20 μA.cm-2 with BSA). This difference in plateau current is not necessarily due to the BSA but may also be induced by a difference in natural convection from one experiment to another.
Here Fig. 1
The anodic polarization curves obtained without and with 20 mg.L-1 of BSA are presented in Figure 1(b). In the absence of protein, the anodic polarization curves show very high dissolution currents. In particular, a pseudo-plateau, corresponding to a current density of ~ 2.5 mA.cm-2, can be observed at around 0.4 V vs SCE; therefore, this plateau current is not a passive current, and hence the oxide film formed on the surface is not a passive layer. Moreover, visual observation of the electrode surface after an anodic scan shows a green layer, the thickness of which increases with the end anodic potential. This green layer corresponding to high anodic currents may be formed by redeposition due to the saturation of the solution in copper ions. In the presence of BSA, lower current densities can be observed near Ecorr, for potentials lower than 0.0 V vs SCE; this difference in current densities is partly due to the difference in Ecorr values without and with BSA. Above 0.0 V vs SCE, the two anodic polarization curves overlap. Thus, only a slight influence of the protein on the anodic electrochemical behaviour can be seen. Moreover, after the anodic polarization curve, the green color is not observed in the solution with BSA.
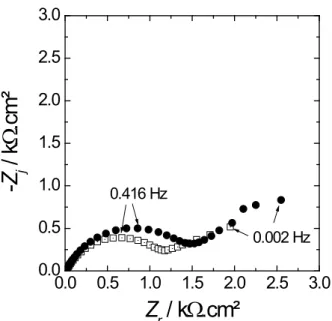
Figure 2 shows the impedance diagrams in the complex plane (opposite of the imaginary part of the impedance -Zj vs real part of the impedance Zr; the electrochemical impedance Z is a
complex number that can be written as: Z(f) = Zr(f) + j⋅Zj(f), with f the ac-frequency (in Hz))
plotted at Ecorr after 1 h of immersion in aerated artificial seawater, without protein and with
20 mg.L-1 of BSA. The diagrams exhibit two capacitive loops: one high frequency (HF) depressed semi-circle, and a low frequency (LF) loop. The size of the HF loop is slightly increased in the presence of BSA.
After impedance measurement at Ecorr without or with BSA, there is no sign of pitting corrosion on the electrode surface.
Here Fig. 2
3.2 Surface analysis
For the sample after polishing, it is observed from XPS and ToF-SIMS data (not shown here) a mixed copper oxides (Cu2O and CuO) and nickel hydroxide (Ni(OH)2) layer, with a thickness of ~1.3 nm and the following atomic composition: 43 at. % Cu2O + 25 at. % CuO + 32 at. % Ni(OH)2. An enrichment in copper of the alloy beneath the oxide layer is also detected (77 at. % Cu + 23 at. % Ni to be compared to 68 at. % Cu + 32 at. % Ni for the bulk alloy).
Differences in chemical composition and thickness of the oxide layers are observed without and with BSA.
After immersion in the BSA-free ASW, the XPS Cu 2p3/2 core level peak with a binding energy located at 932.3 eV (Fig. 3(a)) and the Cu Auger line (L3M45M45) at a binding energy of 570.2 eV (Fig. 3(b)) demonstrate the presence of Cu+ instead of Cu2+ as for the sample after polishing [18,19].
Here Fig. 3
From the XPS Ni 2p3/2 core level spectrum with a peak located at 856.1 eV and the corresponding satellite at 861.7 eV, the presence of Ni(OH)2 in the surface layer is shown (Fig. 4) [20]. The atomic composition of this oxide layer calculated from XPS data (93 at. % Cu2O + 7 at. % Ni(OH)2) indicates an enrichment in Cu2O. It is important to mention that the depth analyzed by XPS is about 10 nm.
Here Fig. 4
A characteristic ToF-SIMS negative depth profile obtained with 70Cu-30Ni alloy immersed during 1 h at Ecorr in ASW without BSA is presented in Figure 5. This profile allows
evidencing a possible stratification of the different compounds on the alloy surface. It shows four regions. A first one that extends from 0 s to 10 s of sputtering characterized by an increase of all signals and corresponding to the time necessary to reach a steady state. After 10 s, one enters the second region that extends up to 200 s of sputtering. This region is characterized by an intense CuO2- signal. As soon as one probes deeper into this region, a progressive increase of the NiO2- signal is observed. This indicates that the outer surface layer is mainly composed of copper oxide, with the presence of some Ni oxide and/or hydroxide, in agreement with XPS data. In the third region that extends from 200 s to 290 s, a sharp decrease of the CuO2- signal and a very intense NiO2- signal are observed. This region is assigned to the formation of a nickel oxide and/or hydroxide inner layer in which the presence of oxidized copper cannot be excluded. Finally, after 290 s of sputtering, one enters the fourth region characterized by a sharp decrease of all oxidized signals (18O-, CuO2- and NiO2-) and a constant and intense plateau for the Ni2- signal that is characteristic of the metallic substrate. From the ToF-SIMS depth profiles, it can be concluded that in the absence of BSA two oxidized layers can be observed: an 18nm-thick outer layer mainly composed of copper oxide and a 12nm-thick inner layer mainly composed of oxidized nickel, with a global thickness of ~30 nm.
Here Fig. 5
After immersion in the BSA-containing solution, the XPS Cu 2p3/2 core level spectrum exhibits three peaks (Fig. 3(a)): one located at 932.3 eV attributed to Cu0 and/or Cu+, another one with a binding energy of 934.5 eV and the corresponding satellite at higher binding energy attributed to Cu2+. Moreover, the Cu Auger line at a binding energy of 570.0 eV (Fig. 3(b)) shows the presence of Cu+. The XPS Ni 2p3/2 core level spectrum recorded in the presence of BSA exhibits the same features as without protein: a peak at a binding energy of 856.0 eV and the corresponding satellite at 861.6 eV showing the presence of Ni(OH)2 in the surface layer (Fig. 4). From these XPS data, it can be concluded that the presence of BSA leads to a mixed copper oxides (Cu2O and CuO) and nickel hydroxide layer, with the following atomic composition: 11 at. % Cu2O + 44 at. % CuO + 45 at. % Ni(OH)2. A lower
amount of Cu2O and higher amounts of CuO and Ni(OH)2 are detected compared to the results obtained in the absence of BSA.
By ToF-SIMS, it is not possible to identify a stratification of the different compounds on the alloy surface in the presence of the protein. The depth profiles show one mixed oxide layer (oxidized copper and nickel) with a lower thickness of ~ 10 nm.
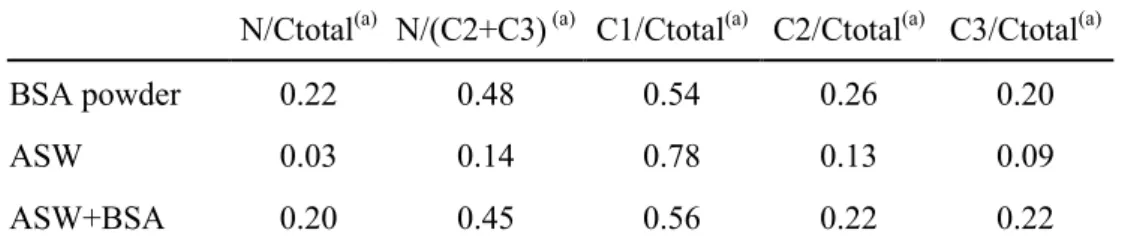
The N 1s spectrum recorded after immersion in ASW with BSA (Fig. 6(a)) exhibits a major symmetric peak, centered at 400.2 eV, as expected for the amine or amide groups of BSA [21]. The C 1s signal obtained in the same conditions is shown in Figure 6(b). It can be fitted with three contributions corresponding to well identified carbon bonds present in the BSA molecule: C1, at a binding energy of 285.0 eV, assigned to C-C and C-H; C2, at a binding energy of 286.4 eV, attributed to C-N and C-O single bonds; and C3, at a binding energy of 288.3 eV, assigned to O=C-O and O=C-N (peptide bonds) bonds [11].
Here Fig. 6
From the N 1s and C 1s signals, it is possible to calculate different “nitrogen/carbon” or “carbon/carbon” atomic ratios. The values of these ratios obtained for the 70Cu-30Ni alloy immersed in ASW without and with BSA, as well as those estimated in previous studies for the BSA powder [12,22] are presented in Table 1. The good agreement between the values for the sample put into contact with the BSA and the BSA powder provides a fingerprint for the protein, and allows us to conclude that the protein is present on the surface. The thickness estimated from XPS data for this adsorbed layer is ~ 3 nm which, according to the size of the BSA molecule [10], corresponds to one monolayer.
Here Table 1
4. Discussion
4.1 Impedance model (EIS)
It is accepted by many authors that the corrosion of copper is controlled by mass transport processes to and from corroding surfaces, involving O2, Cl-, OH-, Cu+ and CuCl2- species [23]. In aerated solution, the cathodic reaction is the reduction of dissolved oxygen, and the anodic reactions involve:
Cu + Cl−⇔ CuCl + e− (3)
followed by the formation of the soluble cuprous complex:
CuCl + Cl−⇔ CuCl2− (4)
Then, cuprous oxide can be formed from CuCl2- as follows [16]:
2CuCl2− + 2OH−→ Cu2O + H2O + 4Cl− (5)
At Ecorr, the anodic and cathodic currents have the same magnitude and the net current is
equal to zero. By principles of summation of currents, the anodic and cathodic impedances must be in parallel. Both the anodic and the cathodic reactions are mass transport limited. The anodic impedance can be depicted by a charge transfer resistance (Rta) in series with an
the cathodic impedance can be depicted by a charge transfer resistance (Rtc) in series with an
impedance that illustrates O2 mass transport (ZDc). A double layer capacitance Cdl is added in
parallel with the anodic and the cathodic impedances. As the impedance response for electrochemical systems often reflects a distribution of reactivity that is commonly represented in equivalent electrical circuits as a constant-phase element (CPE), Cdl is replaced
here by CPEdl which is a constant phase element related to the double layer. The CPE
impedance is expressed in terms of model parameters α and Q as:
α ω ω ) ( 1 ) ( j Q ZCPE = (6)
where ω is the angular frequency (in s-1) given by:
ω = 2πf (7)
When α = 1, the parameter Q has units of capacitance; otherwise, Q has units of Ω-1.cm-2.sα or F.cm-2.s(α−1).
Thus, in a first approach, the 70Cu-30Ni/ASW system can be modeled by the general equivalent electrical circuit illustrated in Figure 7(a), where Re is the electrolyte resistance.
Here Fig. 7
As the first current plateau for the reduction of dissolved oxygen is observed close to Ecorr,
one hypothesis is that this plateau can be extrapolated down to Ecorr; thus, Rtc can be neglected
and the cathodic mass transport impedance is a Warburg impedance (Wc) given by:
(
k jω)
ZW c
c =1 (8)
with kc expressed in s0.5.Ω-1.cm-2. Taking into account experimental cathodic voltammograms,
the 70Cu-30Ni/ASW system can be modeled by the simplified circuit presented in Figure 7(b).
For the same experimental impedance data as those presented in Figure 2 in the complex plane, the absolute value of the imaginary part of the impedance (|Zj|) was plotted as a
function of the frequency in logarithmic coordinates (Fig. 8(a)) [24]. Here Fig. 8
In the HF range, a pseudo-straight line with a slope lower than 1 in absolute value but varying slightly with the frequency can be observed. This slope value lower than 1 suggests a CPE-like behavior (it should be equal to 1 in case of pure capacitive behavior). The CPE parameters α and Q can be graphically obtained in the case of a R//CPE circuit, following the method presented by Orazem et al. [24]. The parameter α is calculated from the slope of the log|Zj| vs log f curve in the HF range:
f d f Z d j log ) ( log = α at HF (9)
and Q is obtained from α as follows: × − = 2 sin ) 2 )( ( 1 απ πf α f Z Q j (10)
However, as the slope varies with the frequency, α cannot be determined from Figure 8(a). To better visualize a possible constant value of the slope in a narrow frequency range, the
f d Z
dlog j log vs log f curves were calculated from those presented in Figure 8(a) (derivative curves; Fig. 8(b)). In the case of a R//CPE circuit, a plateau would be observed at HF corresponding to a value of -α. In Figure 8(b), no plateau is visible, in particular, at very HF, and again the value of α cannot be graphically obtained. It can be concluded from Figure 8 that the HF loop of the experimental impedance diagrams cannot be modeled by a R//CPE circuit, and therefore that the CPE parameters α and Q cannot be graphically estimated.
In conclusion, the HF loop of the experimental impedance diagrams corresponds to the
CPEdl//Rta//Wc equivalent circuit (Fig. 7(c)); thus, it illustrates mainly the anodic charge transfer (diameter equal to Rta), and its depressed shape is partly due to the CPE and partly
due to the cathodic Warburg impedance in parallel. Since no plateau is visible at very HF in Figure 8(b), the effect of Wc is not negligible compared to that of CPEdl even at 104 Hz, and
there is no clear frequency domain specifically assigned to each process. Whereas, the LF loop is related to the anodic mass transport and partial blocking effect by CuCl (Zθ,Da).
The circuits of Figures 7(a) and (b) do not take into account the presence of an oxide layer, as shown by surface analysis. In fact, those circuits are in series with the impedance of the oxide film, depicted by a film resistance in parallel with a film capacitance (Rf//Cf). If Rf is very low,
then the Rf//Cf circuit can be neglected and the oxide film cannot be seen by impedance. Thus,
EIS data are in agreement with an oxide layer with conductive or semi-conductive properties. On the other hand, the presence of Cu2O and CuO on the 70Cu-30Ni alloy was evidenced by surface analyses. These copper oxides are well-known p-type semi-conductors [25-28], which validates the impedance models proposed in Figure 7.
As the LF loop of impedance diagrams is not well defined (described only by a few points), the single HF loop was analysed by regression of the equivalent circuit presented in Figure 7(c), in which CPEdl, Rta and Wc are in parallel, using Simad® software developed at
Laboratoire Interfaces et Systèmes Electrochimiques. The regression results are presented in Figure 9 and in Table 2. The experimental frequency range taken into account for the regression is 0.416 Hz – 100 kHz without BSA and 0.582 Hz – 100 kHz with BSA, but the fitted curves in Figure 9 are shown in the whole frequency range (0.002 Hz – 100 kHz), with parameters values corresponding to those given in Table 2.
Here Fig. 9 Here Table 2
If the CPE behavior is assumed to be associated with surface distributed time constants for charge-transfer reactions (time-constant distribution along the electrode surface), then it is possible to apply the equation derived by Brug et al. to calculate the effective capacitance associated with the CPE [29,30]:
α α α 1 1 ( 1)/ / 1 − − − + = a t e eff Q R R C (11)
The capacitance values calculated from the impedance diagrams shown in Figure 2, taking for
Re and Rta the values extracted from the regression procedure (Table 2), are given in Table 2.
These capacitance values, of the order of several tens of µF.cm-2, are typical of those for a double layer capacitance, which validates the equivalent electrical circuits proposed in Figure 7. Hence, the HF loop illustrates mainly the anodic charge transfer and its diameter is equal to
Rta.
In the presence of BSA, Rta is 1.2 times higher than without protein. This indicates that
albumin leads to a slight decrease of the corrosion current (inversely proportional to Rta), and
hence of the corrosion rate.
4.2 Surface layers models (combined XPS and ToF-SIMS)
After short-term immersion (1 h of exposure) at Ecorr in ASW without BSA, combined XPS
and ToF-SIMS data show two oxidized layers: an outer layer mainly composed of cuprous oxide (Cu2O) and an inner layer mainly composed of oxidized nickel. Thus, the surface layers can be depicted by the model presented in Figure 10(a). This duplex structure, with a cuprous oxide-rich outer layer and a nickel oxide-rich inner layer, has already been observed by Souchet et al. for the early stages (1-2 h) of low temperature (100-200°C) air oxidation of CuNi alloys [31-32] but this result is not well-known for the oxidation of such alloys in aqueous solution.
The presence of BSA leads to a mixed oxide layer composed of CuO, Cu2O, and Ni(OH)2 (Fig. 10(b)). Compared to the results obtained without BSA, there is a marked decrease of the Cu2O content in the oxide layer, and its thickness is lower (~ 10 nm).
Here Fig. 10
There are basically two mechanisms of de-alloying for binary alloys proposed in the literature [16]:
1) simultaneous dissolution of both components of the alloy followed by redeposition of one component (usually the more noble one),
2) selective dissolution of one element from the alloy.
Beccaria and Crousier studied the de-alloying of Cu-Ni alloys exposed to natural seawater for 660 h and found simultaneous dissolution of both components with possible redeposition of copper for nickel contents lower than 50 %, whereas for nickel concentrations higher than 50% selective dissolution of copper took place [33]. Results obtained by Mansfeld et al. for long-term exposure (1-3 months) to natural seawater suggest that de-alloying of 70Cu-30Ni is initially due to simultaneous dissolution of copper and nickel and subsequent redeposition of copper in agreement with the results of Beccaria and Crousier [16].
Our results obtained for short-term exposure to ASW are in agreement with the conclusions drawn by Beccaria and Crousier, and Mansfeld et al.; the cuprous oxide Cu2O detected on the surface by XPS and ToF-SIMS is formed by redeposition of dissolved copper.
5. Conclusions
The influence of BSA adsorption on the electrochemical behavior of 70Cu-30Ni alloy and the chemical composition of oxide layers were studied in static artificial seawater by combined electrochemical measurements and surface analyses.
From polarization curves, high anodic dissolution currents are shown (no passive current). A model is proposed to analyse electrochemical impedance data obtained at Ecorr. The HF loop
of the experimental diagrams illustrates mainly the anodic charge transfer, and its depressed shape is partly due to the cathodic Warburg impedance in parallel and partly due to the CPE; whereas, the LF loop is related to the anodic mass transport and partial blocking effect by CuCl. EIS measurements show uniform reactivity of the surface and are in agreement with an oxide layer with conductive or semi-conductive properties (the oxide layer cannot be seen by impedance). The BSA has a slight effect on the electrochemical behavior of the copper alloy. Thus, Ecorr value after 1 h of immersion is ~ 30 mV more anodic with BSA, and EIS results
indicate a decrease of the corrosion current induced by the protein.
From XPS and ToF-SIMS analyses, different surface chemical compositions of 70Cu-30Ni are shown without and with BSA. In the absence of BSA, two oxidized layers can be observed: an outer layer mainly composed of copper oxide (Cu2O redeposited layer) and an inner layer mainly composed of oxidized nickel, with a global thickness of ~30 nm. In the presence of BSA, the protein is detected on the surface and the thickness of the adsorbed layer is ~3 nm, corresponding to one monolayer. The presence of BSA leads to a mixed oxide layer (CuO, Cu2O, Ni(OH)2) with a lower thickness (~ 10 nm).
The combination of electrochemical measurements and surface analyses allows us to conclude that in static conditions the BSA induces a decrease of the dissolution rate at Ecorr and hence a
decrease of the amount of redeposited Cu2O and of the oxide layer thickness.
As the water of cooling circuits is typically under flow and as the corrosion of copper is controlled by mass transport processes to and from corroding surfaces, electrochemical measurements in well-controlled hydrodynamics conditions, using a rotating electrode, have been performed. These experiments, which clarify the role of mass transport on the electrochemical behavior and strengthen the proposed impedance model, will be the purpose of a forthcoming paper.
Acknowledgements
The research leading to these results has received funding from the European Community's Seventh Framework Programme (FP7/2007-2013) under grant agreement n° 238579. Project website: www.biocor.eu/ip8 (RSP3).
References
[1] M.J. Fernandez Torres, F. Ruiz Bevia, Chlorine use reduction in nuclear or conventional power plants : a combined cooling-and-stripping tower for coastal power plants, J. Clean. Prod. 26 (2012) 1−8.
[2] P.Cristiani, G. Perboni, A. Debenedetti, Effect of chlorination on the corrosion behavior of CuNi 70/30 condenser tubing, Electrochim. Acta 54 (2008) 100−107.
[3] G.T. Taylor, P.J. Troy, S.K. Sharma, Protein adsorption from seawater onto solid substrata, I. Influences of substratum surface properties and protein concentration, Mar. Chem. 45 (1994) 15−30.
[4] S. G. Choudhary, Emerging microbial control issues in cooling water systems, Hydrocarb. Process. 77 (1998) 91−102.
[5] S. Rajagopal, K.V.K. Nair, J. Azariah, G. van der Velde, H. A. Jenner, Chlorination and mussel control in the cooling conduits of a tropical coastal power station, Mar. Environ. Res. 2 (1996) 201−221.
[6] D. Thierry, W. Sand, Microbially Influenced Corrosion, in: P. Marcus (Ed.), Corrosion Mechanisms in Theory and Practice, third ed., CRC Press, Boca Raton, 2011, pp. 737-776. [7] A.M. Alfantazi, T.M. Ahmed, D. Tromans, Corrosion behaviour of copper alloys in chloride media, Materials and Design 30 (2009) 2425−2430.
[8] K. Hori, S. Matsumoto, Bacterial adhesion: From mechanism to control, Biochem. Eng. J. 48 (2010) 424−434.
[9] T. Peters, Serum albumin, Adv. Protein Chem. 37 (1985) 161−245.
[10] D.C. Carter, J.X. Ho, Structure of serum albumin, Adv. Protein Chem. 45 (1994) 153−205.
[11] I. Frateur, J. Lecœur, S. Zanna, C.-O. A. Olsson, D. Landolt, P. Marcus, Adsorption of BSA on passivated chromium studied by a flow-cell EQCM and XPS, Electrochim. Acta 52 (2007) 7660−7669.
[12] A. Ithurbide, I. Frateur, A. Galtayries, P. Marcus, XPS and flow-cell EQCM study of albumin adsorption on passivated chromium surfaces: Influence of potential and pH, Electrochim. Acta 53 (2007) 1336–1345.
[13] V. Payet, S. Brunner, A. Galtayries, I. Frateur, P. Marcus, Cleaning of albumin−contaminated Ti and Cr surfaces: an XPS and QCM study, Surf. Interface Anal. 40 (2008) 215−219.
[14] S. Tanuma, C.J. Powell, D.R. Penn, Calculations of electron inelastic mean free paths II. Data for 27 elements over the 50-2000eV range, Surf. Interface Anal. 17 (1991) 911−926. [15] J.H. Scofield, Hartree-slater subshell photoionization cross-sections at 1254 and 1487 eV, J. Electron Spectrosc. 8 (1976) 129−137.
[16] F. Mansfeld, G. Liu, H. Xiao, C.H. Tsai, B. J. Little, The corrosion behavior of copper alloys, stainless steels and titanium in seawater, Corros. Sci. 12 (1994) 2063−2095.
[17] I. Frateur, Incidence de la corrosion des matériaux ferreux sur la demande en chlore libre en réseaux de distribution d’eau potable, Ph.D. Thesis, University of Paris 6, France, 1997.
[18] G. Deroubaix, P. Marcus, X-ray photoelectron spectroscopy analysis of copper and zinc oxides and sulphides, Surf. Interface Anal. 18 (1992) 39−46.
[19] A. Galtayries, J.-P. Bonnelle, XPS and ISS Studies on the interaction of H2S with polycrystalline Cu, Cu2O and CuO Surfaces, Surf. Interface Anal. 23 (1995) 171−179.
[20] H. Ayoub, V. Lair, S. Griveau, A. Galtayries, P. Brunswick, F. Bedioui, M. Cassir, Ageing of nickel used as sensitive material for early detection of sudomotor dysfunction, Appl. Surf. Sci. 258 (2012) 2724−2731.
[21] Y.F. Dufrêne, T.G. Marchal, P.G. Rouxhet, Probing the organization of adsorbed protein layers: complementary of atomic force microscopy, X-ray photoelectron spectroscopy and radiolabeling, Appl. Surf. Sci. 144-145 (1999) 638−643.
[22] L. Lartundo-Rojas, Influence de l’adsorption de protéine (BSA) sur le comportement électrochimique et la composition de surface d’un alliage Fe-17Cr en solution aqueuse, Ph.D. Thesis, University of Paris 6, France, 2007.
[23] C. Deslouis, B. Tribollet, G. Mengoli, M. Musiani, Electrochemical behaviour of copper in neutral aerated chloride solution. I. Steady-state investigation, J. Appl. Electrochem. 18 (1988) 374−383.
[24] M.E. Orazem, N. Pébère, B. Tribollet, Enhanced graphical representation of electrochemical impedance data, J. Electrochem. Soc. 153 (2006) B129−B136.
[25] G. Kear, B.D. Barker, F.C. Walsh, Electrochemical corrosion of unalloyed copper in chloride media – A critical review, Corros. Sci. 46 (2004) 109–135.
[26] L. Liao, Z. Zhang, B. Yan, Z. Zheng, Q.L. Bao, T. Wu, C.M. Li, Z.X. Shen, J.X. Zhang, H. Gong, J.C. Li, T. Yu, Multifunctional CuO nanowire devices: p-type field effect transistors and CO gas sensors, Nanotechnology 20 (2009) 085203 (6pp).
[27] U. Collisi, H.-H. Strehblow, The formation of Cu2O layers on Cu and their electrochemical and photoelectrochemical properties, J. Electroanal. Chem. 284 (1990) 385– 401.
[28] H.-H. Strehblow, V. Maurice, P. Marcus, Initial and later stages of anodic oxide formation on Cu, chemical aspects, structure and electronic properties, Electrochim. Acta 46 (2001) 3755–3766.
[29] G.J. Brug, A.L.G. van den Eeden, M. Sluyters-Rehbach, J.H. Sluyters, The analysis of electrode impedances complicated by the presence of a constant phase element, J. Electroanal. Chem. 176 (1984) 275−295.
[30] B. Hirschorn, M.E. Orazem, B. Tribollet, V. Vivier, I. Frateur, M. Musiani, Determination of effective capacitance and film thickness from constant-phase-element parameters, Electrochim. Acta 55 (2010) 6218−6227.
[31] R. Souchet, F. Danoix, A. D’Huysser, M. Lenglet, APFIM and XPS study of the first stages of low temperature air oxidation of industrial CuNi alloys, Appl. Surf. Sci. 87-88 (1995) 271–278.
[32] R. Souchet, M. Lenglet, P. Miché, S. Weber, S. Scherrer, Study of copper-nickel alloy oxidation by FTIR and SIMS, Analusis 21 (1993) 173–176.
[33] A. M. Beccaria, J. Crousier, Dealloying of Cu-Ni in natural seawater, Brit. Corros. J. 24 (1989) 49−52.
Tables
Table 1: XPS atomic ratios. Atomic ratios calculated from the XPS N 1s and C 1s core level spectra recorded for the BSA powder, and for 70Cu-30Ni after 1 h of immersion at Ecorr in aerated artificial
seawater without and with 20 mg.L-1 of BSA.
N/Ctotal(a) N/(C2+C3) (a) C1/Ctotal(a) C2/Ctotal(a) C3/Ctotal(a)
BSA powder 0.22 0.48 0.54 0.26 0.20
ASW 0.03 0.14 0.78 0.13 0.09
ASW+BSA 0.20 0.45 0.56 0.22 0.22
(a)
The atomic ratio X/Y is given by:
X BSA X X Y Y BSA Y Y X T /I T I Y / X = σ λ σ λ
where IX,Y is the intensity of the peak (peak surface area) associated to element X or Y(X and Y equal
to N or C), λBSAX,Y the attenuation length of photoelectrons emitted by the X or Y 1s core level in the BSA layer, σX,Y the photoionisation cross-section of X or Y 1s, and TX,Y the transmission factor of X or
Y 1s. The C 1s signal is fitted with three contributions C1, C2 and C3, corresponding to well identified carbon bonds present in the BSA molecule.
Table 2: Regression results and effective capacitance. Parameters values (electrolyte resistance Re,
anodic charge transfer resistance Rt a
, constant of the cathodic Warburg impedance kc, and CPE
parameters α and Q) obtained from the regression of the equivalent circuit presented in Figure 7(c) to experimental impedance data shown in Figure 2, and effective capacitance Ceff associated with the
CPE calculated from Eq. (11).
Re / Ω.cm 2 Rt a / Ω.cm2 kc / s 0.5 .Ω-1.cm-2 α Q / F.cm-2.s(α-1) Ceff / µF.cm -2 Without BSA 12 1410 2.5×10⁻⁴ 0.78 1.97×10-04 37 With BSA 12 1700 1.2×10⁻⁴ 0.76 2.01×10-04 30
Figure captions
Figure 1: Voltammograms. (a) Cathodic and (b) anodic voltammograms of 70Cu-30Ni after
1 h of immersion at Ecorr in aerated artificial seawater, () without BSA, and (− − −) with 20
mg.L-1 of BSA. Scan rate: 0.5 mV.s-1.
Figure 2: Experimental Nyquist diagrams. Experimental impedance diagrams in the
complex plane of 70Cu-30Ni plotted at Ecorr after 1 h of immersion in aerated artificial
seawater, () without and () with 20 mg.L-1 of BSA.
Figure 3: Cu 2p XPS spectra and Cu Auger lines. (a) X-ray photoelectron spectroscopy
(XPS) Cu 2p core level spectra and (b) Cu L3M45M45 Auger lines of 70Cu-30Ni after 1 h of immersion at Ecorr in aerated artificial seawater without and with 20 mg.L-1 of BSA. The
intensity is expressed in arbitrary unit (a.u.).
Figure 4: Ni 2p XPS spectra. X-ray photoelectron spectroscopy (XPS) Ni 2p core level
spectra of 70Cu-30Ni after 1 h of immersion at Ecorr in aerated artificial seawater without and
with 20 mg.L-1 of BSA. The intensity is expressed in arbitrary unit (a.u.).
Figure 5: ToF-SIMS depth profile. Characteristic time-of-flight secondary ions mass
spectrometry (ToF-SIMS) negative depth profile of 70Cu-30Ni after 1 h of immersion at Ecorr
in aerated artificial seawater without BSA.
Figure 6: N 1s and C 1s XPS spectra. X-ray photoelectron spectroscopy (XPS) (a) N 1s and
(b) C 1s core level spectra of 70Cu-30Ni after 1 h of immersion at Ecorr in aerated artificial
seawater with 20 mg.L-1 of BSA. Solid line: experimental spectra; dashed line: peak decomposition. The intensity is expressed in counts per second (CPS).
Figure 7: Impedance models. Equivalent electrical circuits to model the 70Cu-30Ni/ASW
system: (a) general circuit, (b) simplified circuit taking into account experimental cathodic voltammograms, and (c) circuit used to analyse the HF loop of experimental impedance diagrams. Re is the electrolyte resistance, CPEdl a constant phase element related to the double
layer, Rta the anodic charge transfer resistance, Zθ,Da an impedance that illustrates anodic mass
transport and partial blocking effect by CuCl, Rtc the cathodic charge transfer resistance, ZDc a
cathodic impedance that illustrates O2 mass transport, and Wc the cathodic Warburg
impedance.
Figure 8: Experimental impedance data. Experimental impedance data of 70Cu-30Ni
obtained at Ecorr after 1 h of immersion in aerated artificial seawater, () without and () with 20 mg.L-1 of BSA. (a) Imaginary part of the impedance as a function of frequency, and (b) derivative curves calculated from Figure 8(a) (dlogZj dlog f vs log f ). Same data as in Figure 2.
Figure 9: Fit of the impedance model to the data. High frequency loops of Nyquist
diagrams obtained for 70Cu-30Ni at Ecorr after 1 h of immersion in aerated artificial seawater,
(a) without and (b) with 20 mg.L-1 of BSA. (, ) Experimental curves and (, ) fit of the impedance model presented in Figure 7(c) to the data. Same data as in Figures 2 and 8.
Figure 10: Surface layers models. Models of the surface layers deduced from combined
X-ray photoelectron spectroscopy (XPS) and time-of-flight secondary ions mass spectrometry (ToF-SIMS) results for 70Cu-30Ni after 1 h of immersion at Ecorr in aerated artificial seawater
(a) (b) Figure 1 -1.4 -1.2 -1.0 -0.8 -0.6 -0.4 -0.2 10-7 10-6 10-5 10-4 10-3 10-2 10-1
|
j |
/ A
.c
m
-2E / V vs SCE
-0.2 0.0 0.2 0.4 0.6 0.8 1.0 10-7 10-6 10-5 10-4 10-3 10-2 10-1| j
| / A
.c
m
-2E / V vs SCE
Figure 2 0.0 0.5 1.0 1.5 2.0 2.5 3.0 0.0 0.5 1.0 1.5 2.0 2.5 3.0 0.416 Hz 0.002 Hz
-Z
j/ k
Ω
.c
m²
Z
r/ k
Ω.cm²
(a) (b) Figure 3 970 960 950 940 930 Cu 2p1/2 x 5
Int
ens
ity
/
a.
u.
Cu2+ Cu 2p3/2 With BSA Without BSABinding energy / eV
560 565 570 575 580Int
ens
it
y
/
a.
u.
Binding energy / eV
Without BSA With BSA x 5Figure 4 890 880 870 860 850 840 With BSA Without BSA
Int
ens
ity
/
a.
u.
Binding energy / eV
Ni 2p1/2 Ni 2p3/2Figure 5
0
50
100
150
200
250
300
350
400
450
10
010
110
210
310
410
5 116(58Ni2-) 95(63CuO2-) 90(58NiO2-) 18(18O-)Int
ens
ity
/
c
ount
s
Sputtering time / s
Cu oxide / oxidized Ni interface oxide / alloy interface(a) (b) Figure 6 1000 1500 2000 2500 3000 3500 390 395 400 405 410
In
te
n
s
ity
/
C
P
S
Binding energy / eV
0 500 1000 1500 2000 2500 3000 3500 4000 4500 5000 280 285 290 295In
te
n
s
ity
/
C
P
S
Binding energy / eV
C1
C2
C3
(a) (b) (c) Figure 7 Re Rtc ZDc Rta Zθ,D a CPEdl Rta Zθ,D a Wc CPEdl Re Rta Wc CPEdl Re
(a) (b) Figure 8 10-3 10-2 10-1 100 101 102 103 104 10-3 10-2 10-1 100
| Z
j|
/ k
Ω
.cm
2f / Hz
-3 -2 -1 0 1 2 3 4 -1.0 -0.8 -0.6 -0.4 -0.2 0.0 0.2 0.4d
log|
Z
j| /
d
log
f
log f / Hz
(a) (b) Figure 9 0.0 0.5 1.0 1.5 2.0 2.5 3.0 0.0 0.5 1.0 1.5 2.0 2.5 3.0 0.416 Hz 0.002 Hz
-Z
j/ k
Ω
.c
m²
Z
r/ k
Ω.cm²
0.0 0.5 1.0 1.5 2.0 2.5 3.0 0.0 0.5 1.0 1.5 2.0 2.5 3.0 0.416 Hz 0.002 Hz-Z
j/ k
Ω
.c
m²
Z
r/ k
Ω.cm²
(a) (b) Figure 10
68% Cu, 32% Ni
ALLOY
Cu2ONiO and/or Ni(OH)
2Cu
2O
~ 18 nm
~ 12 nm
93% Cu
2O, 7% Ni(OH)
268% Cu, 32% Ni
ALLOY
44% CuO, 11% Cu
2O,
45% Ni(OH)
2BSA
~ 10 nm
~ 3 nm
Vitae
Blanca Estela Torres Bautista received a Bachelor’s Degree in Chemical Engineering from
Chemical Engineering Faculty, Universidad Autónoma de Yucatán, Mexico. Since 2010, she is a Ph.D. student at the University of Paris 6, France, and Early Stage Researcher at the Laboratory of Physical Chemistry of Surfaces, CNRS−Chimie ParisTech, in the frame of a European Marie Curie Initial Training Network (ITN) called BIOCOR. Her field of research is surface electrochemistry, surface chemistry, molecular biology and microbiology. Her Ph.D. research aims at investigating the influence of bio-macromolecules adsorption on the chemical composition of oxide layers and the electrochemical behaviour of metallic materials.
Maria Leonor de Castro Rebelo de Azevedo Carvalho is a PhD student at the University of
Paris 6, France, and Early Stage Researcher at RSE S.p.A., Italy, within a Marie Curie Initial Training Network (ITN) called BIOCOR. She holds a Chemical Engineering degree with specialization in “Technology of Environmental Protection”, from Instituto Superior de Engenharia do Porto, Portugal. Her PhD research has the objective to clarify the effect of biofilm and chlorination on the oxide layers developed on copper alloys in seawater cooling circuits.
Antoine Seyeux received his Master 2 degree (2002) from University Paris-Sud, France, and
his Ph.D. (2006) in Material Science from University Pierre et Marie Curie, Paris, France. He is Research Engineer at CNRS (Centre National de la Recherche Scientifique) and responsible for the surface analytical ToF-SIMS platform at the Laboratory of Physical Chemistry of Surfaces. His field of research is surface chemistry and corrosion science, including oxidation of metals and alloys, and adsorption of molecules on metallic or oxidized surfaces.
Sandrine Zanna is graduated from École Nationale Supérieure de Chimie et de Physique de
Bordeaux (ENSCPB) (1994) and received her Ph.D. (1997) in Materials Science from Bordeaux University, France. She is Research Engineer at CNRS (Centre National de la Recherche Scientifique) and responsible for the surface analytical XPS platform at the Laboratory of Physical Chemistry of Surfaces, and is in charge of various projects in the field of metal surface chemistry, oxidation of metals and alloys, and adsorption of molecules on metal and oxide surfaces.
Pierangela Cristiani has a University degree in Biology and more than fifteen years
experience in microbial corrosion and biofouling prevention in industry. She is project leader at RSE S.p.A. (a fully public-controlled Italian Research Company for Energy fields). She is author of more than 100 international publications, including 4 books chapters, and more than 30 journal papers/peer reviewed proceedings. She has already made an international patent based on the “electro-active” effect of biocathode in a sensor which is actually used for the control of biofilm in industrial cooling circuits. Since 2008, her field of research includes microbial fuel cells development.
Bernard Tribollet after his graduation from the “Ecole Supérieure d’Electricité” (1973),
joined the laboratory of I. Epelboin (now LISE-CNRS UPR 15) where he prepared a PhD under his supervision. In 1981, with the support of a NSF fellowship, he spent one year as visiting scientist at the University of California, Berkeley under the supervision of Prof. John Newman. His current research field concerns different problems: mass transport, electrodissolution, corrosion and in particular biocorrosion. He co-authored, with Prof. Mark Orazem of the University of Florida, a textbook on impedance spectroscopy published in 2008 as part of the Electrochemical Society Series (Wiley).
Philippe Marcus is graduated from École Nationale Supérieure de Chimie de Paris (ENSCP)
(1975) and received his Ph.D. (1979) in Physical Sciences from University Pierre and Marie Curie, Paris, France. He is Research Director at CNRS (Centre National de la Recherche Scientifique) and Director of the Laboratory of Physical Chemistry of Surfaces at ENSCP Chimie ParisTech, France. His field of research is surface chemistry, surface electrochemistry, and corrosion science, with emphasis on the understanding of the structure and properties of metallic surfaces. His research interests include the applications of advanced surface analytical methods such as XPS, STM and ToF-SIMS.
Isabelle Frateur is graduated from École Nationale Supérieure d’Électrochimie et
d’Électrométallurgie de Grenoble, France (1994) and received her Ph.D. (1997) in Electrochemistry from Paris 6 University. Since 1999, she has been Research Scientist of CNRS (Centre National de la Recherche Scientifique) first at the Laboratory of Physical Chemistry of Surfaces, Chimie ParisTech, until 2012 then at the Laboratory of Interfaces and Electrochemical Systems, Paris 6 University. Her field of research is surface electrochemistry and corrosion science, with emphasis on the study of the corrosion/passivation behavior of metallic materials in the presence of organic or biological molecules by impedance spectroscopy.