Empty Container Management in the Benelux Waterways
SALMON F. ; LIMBOURG S.
HEC – Management School, Université de Liège,14 rue Louvrex, 4000 Liège, Belgium
Email (Corresponding author): [email protected]
ABSTRACT: The scientific contribution of this paper is the development of a model for empty container management in the hinterlands of the ports of Antwerp and Rotterdam. The objective of the proposed model is to minimize the total operational cost while satisfying the demand for empty containers. This goal is achieved by choosing the most efficient transportation mode between a seaport and its hinterland: road, inland waterways or intermodal transport. Moreover, to fit the real-life operation and management as well as possible, our model also includes container substitution and container leasing options.
1 INTRODUCTION
Compared with traditional cargo ships, maritime container transport allows shorter loading and unloading times and better opportunities for pre- and post-haulage. These save costs and reduce bottlenecks in seaports. This is why the degree of containerization has risen significantly in the main world seaports. Due to congestion issues and to the scarcity and cost of available land near seaports, regional import-export businesses and liner services have been moving from seaports to their hinterlands. Demand and supply of empty containers at a port mainly depend on the cost of building or leasing containers and on the cost of repositioning empty containers from a surplus to a demand region. Repositioning of empty containers implies container movements between regional importers, seaports and dry port terminals, depots and export customers.
The importance of container management for waterway networks is growing yearly mainly due to the road congestion, the rise in the cost of truck transports or the increasing interest for greener ways of transport. The surroundings of seaports are often congested which makes the transport of containers by inland waterways to the terminals a huge advantage. There are twice more containers transiting by the port of Antwerp by road than by waterway (Région Wallonne, 2005). But even if road is the dominant mode of transport in Belgium, it is quite saturated and opportunities for further developments lie in waterway transportation (Région Wallonne, 2005).
The intermodal barge transport of containers increased by over 45% during the last 10 years in the port of Antwerp (Port of Antwerp, 2012) and the port of Rotterdam is building new docks and storage locations for containers to improve their capacity (Maasvlakte 2, 2013). The network itself is evolving with the planned construction of new links between France, the Benelux countries and Germany (Economic commission for Europe, 1996).
On a maritime scale the empty container repositioning is made to tackle imbalances between areas with high level of supply and areas with high level of demand. The maritime imbalance is quite important between China, the main exporter and supplier of containers, and the rest of the world. The trade imbalance in 2006 was 1-2.6 between Asia and America and 1-1.8 with Europe (Robinson, 2007).
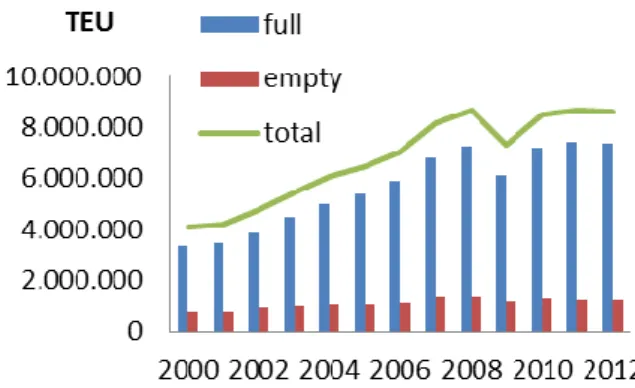
On a hinterland scale the demand and supply of containers can differ a lot from a region to another one and a common way of tackling the problem is to locate the majority of empty containers near a seaport. From there they can be sent to any customer in its hinterland or being used to reduce the maritime imbalance. The problem is that if after each loaded shipment the empty container is brought back to a sea port, the number of empty container movements on the hinterland would represent at least 50% of hinterland container movements (Veenstra, 2005). Overall, including maritime and regional movement, the transportation of empty containers was estimated in 2002 at more or less 20% of the total container flow: a worldwide $20 billion cost (Veenstra, 2005). Figure 1 shows
that empty containers represent 15% of all transiting containers in the port of Antwerp.
Figure 1: Number of containers, in Twenty-foot Equivalent Unit (TEU), transiting in the port of Antwerp per year.
According to Beelen (2011), the three major market segments on container transport are domestic transport, Rhine navigation and Rotterdam-Antwerp navigation. Containers between Rotterdam and Antwerp are often transported using push convoys taking advantage of the fact that pushed barges can be left behind while the pusher vessel can immediately be used for a different assignment. The independent charterers have a rather limited role, usually on small waterways, compared to the role of the shipping companies. Indeed, in the hinterland of Antwerp and Rotterdam most of the container transportation is made through liner services (Notteboom, 2007; Caris, Macharis, & Janssens, 2012). In these liner services, container barges follow a fixed schedule with a given order of dry ports to visit and the calling times; at the last dry port, this order is reversed to end up in the port, usually a sea port, where the tour began. Whereas a charter service is characterized by barges or trucks which are available at short notice to transport containers between any two ports (Figure 2).
Figure 2: On the left hand side charter services and on the right hand side liner services.
Unlike most of the papers in the literature, the proposed model takes into consideration charter services, liner services and bundling possibilities. Usually, sea ports are located at the extremity of major corridors and therefore liner services are the main way of moving containers by waterway with more competitive prices than charter services. This price advantage is explained by economies of scale: fixed costs are shared over customers.
The scientific contribution of this paper is the development of a model for empty container management in the hinterlands of the ports of Antwerp and Rotterdam. The objective of the proposed model is to minimize the total operational cost while satisfying the demand for empty containers. This goal is achieved by choosing the most efficient transportation mode between a seaport and its hinterland: road, inland waterways or intermodal transport. Moreover, to fit the real-life operation and management as well as possible, our model also includes container substitution and container leasing options.
The remainder of this paper is organized as follows. The next section covers the literature review; section 3 contains an exhaustive description of our mathematical model. Section 4 presents the case of the hinterlands of the ports of Antwerp and Rotterdam, followed by results section and a discussion. The paper is concluded in section 7. 2 LITERATURE REVIEW
At the operational level, the empty container issue for hinterland network has been studied by few researchers. Crainic et al. (1993) initiated their research from a deterministic and dynamic model where parameters vary from period to period in a rolling horizon framework; they then added the opportunity to substitute containers (multi-commodity), and eventually developed a stochastic single commodity model where they made the distinction between deterministic and stochastic demands and supplies. The aim is to minimize the total operational costs satisfying the demand for empty containers at all locations and choosing the most efficient transportation modes.
Later, Cheung and Chen (1998) made a similar two-stage stochastic network model for international shipments. The randomness arises from the demands for and the supplies of empty containers and from the ship capacities for empty containers. The model did not directly include customers’ demands but rather the global demand for empty containers at a given terminal. In addition to their stochastic model, they proposed various algorithms to solve it. They expressed a multistage model as a natural extension of their model. Indeed, in the two-+ fixed
stage model, all random parameters in stage two are assumed to be realized at once. In practice, parameters are realized over time.
In 2002, Choong et al. developed an integer program to model empty container management on the intermodal transportation networks of the Mississippi River. They took barge, train and truck into account. Their main result is related to the planning horizon effect the longer horizon allows better management of container outsourcing and encourages use of slower cheaper transportation modes (e.g., barge). Possible extensions of their work would be integrating loaded and empty container flow decisions in the same model and to consider the uncertain nature of demand and supply in the container management problem.
Di Francesco (2007) developed three optimization models for the empty container issues for local repositioning, in addition with a model about maritime reposition and another about street-turn problems, i.e. when empty containers are moved directly from consignees to shippers. His first model is a deterministic minimization cost model with a one-hour period and a weekly horizon. This model includes the possibility of inter-modality: boat, train, and lorry. The two other models add respectively the possibility of substitution and the possibility of renting.
More recently, Braekers et al. (2013) developed an empty container repositioning model for corridor networks with inter-modality taking into account the loaded containers movements.
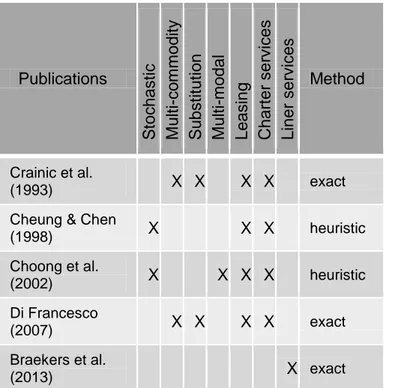
Publications S toch astic M ul ti -co m m od it y S ub st it utio n M ul ti -m od al Le asi ng C ha rt er ser vi ces Li ne r service s Method Crainic et al. (1993) X X X X exact
Cheung & Chen
(1998) X X X heuristic Choong et al. (2002) X X X X heuristic Di Francesco (2007) X X X X exact Braekers et al. (2013) X exact
Table 1: Characteristics considered in publications on empty container repositioning
In their literature review Braekers et al. (2011) identified few characteristics on which decisions have to be made for regional empty container management models. They indicated some research opportunities and more specifically opportunities at the operational level for stochastic allocation models with intermodal networks. The various characteristics of empty containers models are presented in Table 1 with the aforementioned authors’ characteristics. A more exhaustive table can be found in the literature review performed by Braekers et al. (2011).
3 MODEL FORMULATION
Before presenting our mathematical model, we first discuss some of its various components. Our model combines characteristics from the aforementioned models and adds the possibility of inter-modality with lorry. As in Braekers’ model (2013), it includes liner barges as mean of transport which allow round-trip and shuttle services between some inland terminals and sea ports. It also takes into account parameters such as loading and unloading costs. The model is based on forecasted demand and supply for empty containers in a given area. This area represents the hinterland of seaports with their relative dry ports and terminals. At each period empty containers’ demands must be met by repartitioning containers between ports, leasing new ones, substituting one type of containers to another or using previous stocks. Containers are moved by truck or barge between the different ports, either by charter services or liner services. In a liner service, the transport capacity for empty containers between two ports depends on both the overall capacity of the mean of transport and the number of loaded containers which are carried on this mean of transport.
Index set:
T time period, indexed by .
P sea ports and dry ports, indexed by , . A types of containers, indexed by = 1(20 ft)
or 2 (40 ft).
Λ set of liner services, indexed by .
ports included in a liner service , indexed by with being the number of ports included in the service.
M means of transportation: liner services are indexed as while charter services are given by (barge) and
(truck).
Deterministic parameters:
position of port in the list of ports belonging to corridor .
cost of unloading an empty container from a mean of transport .
cost of loading an empty container onto a mean of transport .
transportation cost of an empty container from port to by a mean of transport . holding cost per time unit of an empty container at port .
leasing cost per time unit for an empty container at port .
cost of using a substituted empty container instead of at port .
time needed to travel from the port to the port by a mean of transport .
demand for empty containers in port at time .
return of empty containers in port at time .
maximum capacity of port in terms of TEUs for empty containers.
capacity in terms of TEUs for a corridor .
capacity in terms of TEUs for a mean of transport from port to departing at
.
maximum number of containers that can be leased at port .
= 1 if the barge is staying in the wharf at the port at time for a corridor .
0 otherwise.
The parameter aims to localize liner barges along a corridor . One corridor represents a given path consisting of the succession of ports which will be visited by the barge in one-way. It takes two corridors to make the full round-trip. Repetitions of this round-trip are made by adding new corridors.
number of full containers to be transported from port to at departing time by a mean of transport .
For practical reasons, we define:
total number of full containers unloaded on a corridor at a location at time .
total number of full containers loaded on a corridor at a location at time .
Decision variables:
number of leased empty containers stored at port and time .
number of owned empty containers stored at port and time .
= 1 if empty containers of type are used at port and time as substitute to the other type.
0 otherwise.
number of empty containers of type used at port and time as subsitute to the other type.
number of empty containers to be repositioned from port to departing at time
by a mean of transport . , , , , are given.
For sake of clarity, we include the dependent variables:
total number of empty containers unloaded by a mean of transport at a location . It equals to the number of empty containers coming to the location by this mean of transport from any location where they were loaded at time :
and
total number of empty containers loaded on a mean of transport leaving location at time . It is the sum of empty containers loaded at the location on this mean of transport leaving for any location:
Note that the number of leased containers also directly depend on number of owned containers since the number of leased containers is equal to the number of containers needed minus the number of owned containers that are used to satisfy the demand. Objective function: Min (1) Subject to: (2) (3)
(4) (5) (6) (7) (8) where α is the number of containers used as substitutes of container and β the number of containers used as substitutes of container .
(9) (10) (11) (12) , , , , integer (13) The objective is to minimize the cost of moving empty containers (1). The transport capacities for charter services, either truck or barge, are defined by constraints (2) while the transport capacities for liner barges are calculated regarding the overall capacity and the loaded containers moved on the given corridor (3). Constraints (4) ensure that barges are empty at the end of their corridor. Constraints (5) and (6) define the possibilities of loading and unloading empty containers for liner services. Constraints (7) and (8) guarantee that empty container demand at each port is satisfied by empty containers already stored at the location, empty containers unloaded at the port, previously loaded containers returning as empty to the port or finally by substituting or leasing empty containers. The remaining containers are stored or sent elsewhere. The storage capacity at each port is constrained by (9) and leasing capacity by (10). Constraints (11) state that if containers of type (i.e. 20 ft) are used at port and time as substitutes thus the other type (40 ft) of containers cannot be used as substitutes. Finally, constraints (12) express that the number of empty containers of type used at port and time as subsitute to the other type has to be less than the maximum capacity of the port.
4 CASE STUDY
This section details a case based on the hinterlands of the ports of Antwerp and Rotterdam. Rotterdam and Antwerp mainly serve the Benelux countries but containers from these ports can also go down the Rhine to Brisfelden near Basle in Switzerland. They serve about 50 terminals and represent more than 85% of the inland waterway transport in the European Union (Koning, 2009). The Benelux is thus one of the main areas for containerization in the world and there are plenty of companies of all size, including the world leaders: MSC1, Maersk and Cosco2. That’s the reasons why our network includes the Benelux countries and the German part of the Rhine.
Nowadays, according to Notteboom (2007), container shipping services is the most used services between ports. They improve barge transport competitiveness compared with charter services. The barge can either make multiple terminals stops before reaching a seaport like in Rhine basin, or transport some containers between one seaport and one and only terminal. Due to the high number and small scale of the terminals, but also to the limited transport capacities induced by the waterway infrastructure, most of the container transportation made in the Benelux consists of movements between one seaport and one terminal (Notteboom, 2007; Caris, Macharis, & Janssens, 2012).
The priority is given to loaded containers because it is the core business for shipping companies (Cheung & Chen, 1998). As a result we consider that we know the origin, the destination and how the transportation is handled for loaded containers. The priority is also given to maritime vessels which move on regular basis with fixed schedules because the cost of delay is much higher than the one for barge transport. Moreover, seaports have legal agreements with maritime shippers and not with barge operators (Caris, Macharis, & Janssens, 2012).
In this research, the instance will take into consideration the main liner services between sea ports and dry ports. Corridors were retrieved from the web site: http://www.containerafvaarten.be/, which gathers departure lists of most liner services operating in the hinterland of Antwerp and Rotterdam. Liner services where taken as starting or ending port in one of these two main sea ports. The sample includes the most representative dry ports in the Nomenclature of Territorial Units for Statistics (NUTS) classification level 2, the geographical
1
Mediterranean Shipping Company
2
classification used Eurostat3. Demand and supply of containers for these ports have also been retrieved from Eurostat. The regional data are related to loaded containers; therefore we assume the number of loaded containers corresponds to the demand of empty containers and the number of unloaded to containers the supply of empty ones. Because data from Eurostat are given in terms of TEU, we assume that the distribution of 20’ and 40’ containers is the same as in the port of Rotterdam: 1/3 of 20’ and 2/3 of 40’ (Kim & Van Wee, 2009). Fluvial distances between ports were compute thanks to the NODUS model (Jourquin et al., 1999). Leasing capacities are unlimited at sea ports while dry ports have no leasing possibilities. Most parameters are the same in each terminal, such as loading/unloading costs, leasing costs and storage costs. Leasing a container costs 85€ per month according to Caru Containers (2013). This price is assumed to be the same in every port. The other costs are the one used in Braekers et al. (2013): the storage cost is 1 €/TEU/day in dry port and 2 €/TEU/day in sea ports. Costs of loading and unloading containers are assumed to be 13 €, either for barges or trucks. Transportation costs are taken from an average costs obtained in Limbourg and Jourquin (2009): 0.014 €/ton-km by barge and 0.105 €/ton-km by truck. We roughly estimate substitution costs at 40 € for substituting 40’ containers and 20 € for substituting 20’ containers. 5 RESULTS
In order to generate results, we have written an application in Java to prepare the data, to call the professional optimisation library IBM ILOG CPLEX and to analyse the results. The optimisation steps were performed on a personal laptop computer (Windows 7 Professional, Dual-Core 2.5GHz, 2.8GB of RAM) and with CPLEX 12.5. Since we must solve a mixed integer linear program, we have used the classical branch-and-cut CPLEX solver with the default parameters.
The instance includes 17 ports with 95 different scheduled liner services. Most of them are on the Rhine River. The instance runs for 120 periods each representing one hour for a total of 5 days. Initial stock in Antwerp is set to 10000 of 20’ containers and 20000 of 40’ containers. Other ports were empty at time t=0.
To start with, we compare two situations: in the first one, only charter services are available; in the second one liner services can also be used. When liner services are offered, they capture most of the transit due to their prices and their frequency. Thus, the total cost goes down by about 4% but the
3
http://ec.europa.eu/eurostat
computation time through CPLEX increases by 34%. As very few movements are made out of the corridors, empty container management could be done corridor per corridor. Note that, in this instance, liner capacity is considered as unlimited because demand and supply for the majority of ports are low compared to the capacity of a typical line services.
In the second place, we test three price policies regarding handling costs. Firstly, in scenario 1, costs of loading and unloading containers are assumed to be 13 €, either for barges or trucks. Secondly, in scenario 2, the customer is not assumed to be located at the port anymore. Consequently, the container has to be transported between the port and the customer’s warehouse by truck. This implies an extra transhipment cost of 13 €. Thirdly, the worst case scenario is tested with handling costs for barges of 30 € and handling costs for trucks of 25 € (Mediterranean Shipping Company, 2013). Results are summarized in table 2. Number of containers transported by Scenario 1 2 3 liner barge 3050 3066 2647 charter barge 292 224 9 truck 0 66 703
Table 2: Hinterland modal split according to various handling costs.
When there are no capacity restrictions, the vast majority of containers transit by liner services along corridors. Containers are transported by charter services mainly where there are any liner services. Even if the customer is not located at the port, the modal split remains quite the same. This means that, with those cost parameters, intermodal transport is competitive compared to road transport for empty container management. The third case scenario favours local services by truck: Antwerp and Rotterdam are not supplying any ports by barge anymore. The only liner services in activity are the ones between these two sea ports. Therefore, fast and cost-efficient transhipment of containers remains key for further enhancements towards sustainable competitiveness of inter-modality against mono-modal road transport.
6 DISCUSSION
It is important to point out the importance of data linked with the user’s perspective. In the developed instance, containers’ ownership is not taken into account. The problem is studied considering the overall fleet of containers alongside with overall capacities and average costs. This first approach
allows to obtain estimations of the current situation and to know where needs could arise and to highlight the modifications in terms of hinterland modal split.
An improvement is to represent the interactions between terminals, customers and shippers. Indeed containers’ owners want to manage their own fleet of containers. They often use only a few parts of the storage possibilities by getting official deposits in the form of contracts with storage facilities at terminals or by buying land to store their own containers without passing by a third-party logistic. Therefore, specific containers can move on longest distances to get stored, but contracts with official deposits usually mean lower storing costs. The same exists with charterers who can guarantee preferential prices for their faithful clients. Such quality data could be obtained by gathering all shippers’ data with their official deposits and the price they get from their subcontractors. However, these data are considered as competitive advantage for companies who would not be so eager to share them. Nevertheless, this model is coherent at the operational level if it is used by individual shippers with their own values or to move specific goods and not a full fleet of containers.
In addition, the model considers that customers’ demand and supply are gathered at the location of the port or terminal. This should not influence substantially results since the average distance covered by terminals is quite short, varying between 20 and 60 kilometres (Notteboom, 2007). The main cost differences are the handling costs induced by the addition of a new mean of transport, what we have tried to assess in scenario 2. The principal advantage of taking directly into account customers’ demands is the possibility of making street-turns. These street-turns allow reducing the total cost by lowering the travel distance. Street-turns could be added to our model in a way that, once a customer receives a loaded container, the model would reallocate an amount of empty ones being already stored at the customer’s warehouse to any destination (port, terminal or other customer). The transport capacity would be at most the number of loaded containers. With this method, the storage costs at customers are not considered and the storing capacity limited to its needs. This improvement will increase the problem size and is hard to solve, opening the way to heuristics.
Finally, at the operational level, the time factor and the stochasticity inherent in the system are the key players. In such cases, where uncertainties in future predictions exist, system variables cannot be deterministically known for the future periods and can only be predicted probabilistically. To take uncertainty in empty containers demand and supply
into account, a multi-stage stochastic optimization model should be developed. In stage one, all the parameters are deterministic; whereas parameters such as supplies, demands, and ship capacities for empty containers are random variables realized over time.
7 CONCLUSIONS
In order to minimize the total operational costs satisfying the demand for empty containers, a dynamic, multi-commodity model including opportunities for container substitution, container leasing and the possibility of inter-modality with road transportation has been developed.
The obtained results are supported by previous research concluding that, in the hinterland of Antwerp and Rotterdam, most of the container transportation is made through liner services (Notteboom, 2007; Beelen, 2011, Caris, Macharis, & Janssens, 2012)
The model allows testing the different parameters which could lead to a better use of intermodal transport. As we have seen in section 5, one of the most critical point, which appear to have an important impact on empty container management costs, is the handling costs which have to be quite low to make intermodal transports competitive. Nevertheless we’ve seen that if handling costs can be pushed down, intermodal transport becomes the cost leader. Hence the importance of efficient cranes to reduce handling costs in ports and terminals. Such decisions would need a strategic tool handling both loaded and empty containers.
The work is still in progress and the next step is to take into account street-turns. More importantly, a huge progress would be made with the incorporation of stochasticity. The addition of stochasticity is computationally intractable opening the way to heuristics. The first obtained results with our empty container management model would help to test the more suitable techniques and procedure combining heuristics and exact algorithms.
ACKNOWLEDGMENTS
We would like to thank the Interuniversity Attraction Poles Programme initiated by the Belgian Science Policy Office (research project COMEX, Combinatorial Optimization: Metaheuristics & Exact Methods). Special thanks are due to Kris Braekers for providing his instances, Bart Jourquin for providing the fluvial distances between ports and Martine Mostert who made very constructive comments, all errors remaining are ours.
REFERENCES
Maasvlakte 2. 2013. Retrieved from Port of Rotterdam: http://www.portofrotterdam.com/en/Port/
port-development/Pages/maasvlakte-2.aspx (13, 04, 2013)
Beelen, M. 2011. Structuring and modelling decision making in the inland navigation sector. Antwerp
Binnenvaart. (n.d.). Retrived from Binnenvaart: http://www.binnenvaart.be/nl/waterwegen/kaart_vlaa msewaterwegen.html (11, 01, 2013)
Braekers, K., Caris, A., & Janssens, G. K. 2013. Optimal shipping routes and vessel size for intermodal barge transport with empty container repositioning. Computers in Industry, 64, 155-164
Braekers, K., Janssens, G. K., & Caris, A. 2011. Challenges in Managing Empty Container Movements at Multiple Planning Levels. Transport Reviews, 31(6), 681-708
Caris, A., Macharis, C., & Janssens, G. K. 2012. Corridor network design in hinterland transportation systems. Flexible Services and Manufacturing Journal, 24, 294-319
Caru Containers. (2013, 1 11). Renting containers. (F. Salmon, Interviewer)
Cheung, R. K., & Chen, C.-Y. 1998. A Two-Stage Stochastic Network Model and Solution Methods for the Dynamic Empty Containeur Allocation Problem. Transportation Science, 32(2), 142-162
Choong, S. T., Cole, M. H., & Kutanoglu, E. 2002. Empty container management for intermodal transportation networks. Transportation Research, 423-438
Crainic, T. G., & Kim, K. H. 2007. Intermodal transportation. Handbooks in Operations Research and Management Science, 14, 467-537
Crainic, T. G., Gendreau, M., & Dejax, P. 1993. Dynamic and Stochastic Models for the Allocation of Empty Containers. Operations Research, 41(1), 102-126
Di Francesco, M. 2007. New optimization models for empty container management. doctoral thesis
Economic commission for Europe. 1996. European Agreement on Main Inland Waterwsays of International Importance (AGN). Retrieved from http://www.un.org/ru/documents/decl_conv/conventi ons/pdf/agn.pdf
Jourquin, B., Beuthe, M., Demilie, C.L. 1999, Freight bundling network models: methodology and application, Transportation Planning and Technology, 23, 1570-177.
Kim, N. S., & Van Wee, B. 2009. Assessment of CO2 Emissions for Intermodal Freight Transport Systems and Truck-Only System: Case Study of Western-Eastern Europe Corridor. Journal of Transport Geography
Koning, R. (2009). Intermodal Barge Transport: Network design, nodes and competitiveness.
Limbourg, S., & Jourquin, B. 2009. Optimal rail-road container terminal locations on the European network. Transportation Research Part E: Logistics and Transportation Review, 45, 551-563
Mediterranean Shipping Company. (2013, 1 11). Storage of containers. (F. Salmon, Interviewer)
Notteboom, T. 2007. Inland Waterway Transport Of Containerised Cargo: From Infancy To A Fully-fledged Transport Mode. Journal of Maritime Research, 63-80
Port of Antwerp. 2012. Yearbook of statistics Région Wallonne. 2005. Étude du potentiel de transport fluvial de conteneurs le long de la dorsale wallonne
Robinson, B. 2007. Can't keep running on empty. Cargo Systems, 59-61
Veenstra, A. W. 2005. Empty container reposition: the port of Rotterdam case. 65-76