Science Arts & Métiers (SAM)
is an open access repository that collects the work of Arts et Métiers Institute of Technology researchers and makes it freely available over the web where possible.
This is an author-deposited version published in: https://sam.ensam.eu Handle ID: .http://hdl.handle.net/10985/7215
To cite this version :
Jérémy PLOUZEAU, Damien PAILLOT, Baris AYKENT, Frédéric MERIENNE - Vibrations in dynamic driving simulator: Study and implementation In: CONFERE 2013, France, 20130704 -CONFERE 2013 - 2013
Any correspondence concerning this service should be sent to the repository Administrator : [email protected]
1
VIBRATIONS IN DYNAMIC DRIVING SIMULATOR:
STUDY AND IMPLEMENTATION.
Jérémy PLOUZEAU1, Damien PAILLOT2, Baris AYKENT1, Frédéric M ERIENNE1. 1 - Arts et Metiers ParisTech, CNRS, LE2I, Institut Image 2 rue T. Dumorey 71100 Chalon-sur-Saone France
2 - Laboratoire Electronique, Informatique et Image (Le2i), Université de Bourgogne – Arts et Métiers ParisTech – CNRS UMR 6306
{jeremy.plouzeau, damien.paillot, baris.aykent, frederic.merienne}@ensam.eu
ABSTRACT
This paper shows the effect of adding vibrations in a car cabin during driving simulation on driver perception. Actually, current dynamic driving simulators induce the simulator sickness and it still difficult for the driver to project himself in the virtual reality due to a lack of perception. To know the effect of vibrations on a subject, the effect of the whole body vibration must be defined, as the sources of vibration in a car cabin. After determining all the parameters we propose to determine a formula to produce the vibrations in function of the car state, the road and the boundary conditions. Then experimentation with nine subjects is done to define the exact effect of the vibrations and the new perception of the road in the simulation. In order to do these experimentations, three actuators were installed inside the cabin of the car driving simulator from Institut Image – Arts et Metiers ParisTech.
Key-words: virtual reality, driving simulation, perception, vibration. 1. INTRODUCTION
The driving simulation is used to study drivers’ behavior. It allows the studying of Advanced Driver Assistance Systems (ADAS) conception and their impact on human comportment in critical driving situation. This is the reason why driving simulator are used by car manufacturer in conception and validation projects phases or to study comportments for road safety.
The driver is immersed in the driving simulator with virtual reality technologies. Senses of sight, hearing, touch and vestibular are usually approached in this context. Whereas the vestibular excitation by a dynamic platform coupled with an adapted visual excitation allows to reduce the simulator sickness, some discomfort remains. These problems can be linked to the loss of information like road contact that induces vibrations on the driver.
The research works shows the issue of restitution of vibrations induced by a moving vehicle on the subject in simulated driving conditions.
2. SCIENTIFIC QUESTION
Yet dynamic driving simulators frequently induce the simulator sickness. Actually they do not render finely enough the vibrations generated by the moving vehicle. Thus, we assume that adding vibrations on driving simulators induces a positive effect on the subject.
The scientific issue of this presented research work is related to the effect of vibration on the perception of simulated driving. In this context, the research questions we propose to address are: - What is the effect of vibration on the simulator sickness?
2 - What should be the optimal intensities of vibration?
2.1. The whole body vibration
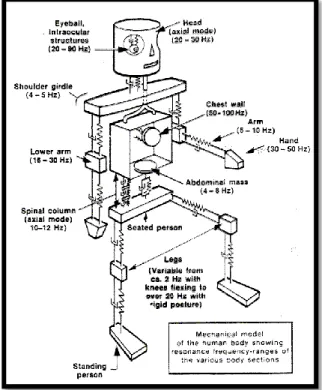
Human vibration is defined as the effect of mechanical vibration on the human body. The human body is not equally sensitive to all frequencies of vibration. We have to consider the human body as a mechanical system. This illustration below shows a greatly simplified mechanical model of the body, where each section is represented by a mass, spring and damper unit. The human body is a strongly damped system and therefore, when a part of it is excited at its natural frequency, it will resonate over a range of frequencies instead of at a single frequency. (Brüel & Kjaer, 1989).
Figure 1: Whole body vibration frequencies responses
The sensitivity of the human body to mechanical vibration is known to be dependent on the frequency and the amplitude and the direction of excitation.
2.2. Vibrations induce in the cabin of a car
There are two principal sources of vibration in the cabin of a car, the powertrain and the tire/road contact.
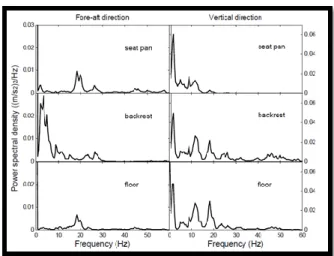
The characteristics of the vibrations generated by the tire/road contact depend on the quality of the road and the speed of the vehicle. These vibration frequencies are different depending on measurement positions. Different measure points are the ground, the seat and backrest. A study (Griffin, 1978) (Qiu & Griffin, 2003) shows that for a speed of 64 km/h on roads with different drivers different height and build, the measured frequencies lie between 4 and 20Hz.
3
Figure 2: Vibration spectra of a car seat
We can observe that harmonics are at 4, 13 and 18 Hz for each measure point.
Vibrations made by the powertrain have frequencies higher than 50Hz. But we are only interested in non-audible frequency range that is why these vibrations do not interest us. (Lecclère, Polac, Laulagnet, & Guyader, 2006)
2.3. Vibrations axis
Vibrations can be oriented by the three dimensional axis X, Y, and Z.
Figure 3: Car axis
Depending on the orientation, the driver feels the orientation in different way. Vibrations oriented by Y axis are assimilated to the adherence of the car to the road. Thus, they represent the feeling of security. Whereas vibrations oriented by the Z and X axis induce the motion sickness. (Katu, Desavale, & Knanai)
With the dynamic driving simulator the mobile platform allows to reproduce the very low frequencies oriented by Y and X axis.
3. SCIENTIFIC APPROACH
To increase the realism, ergonomics simulation and sensations experienced by the user, we propose to study the effect of vibration on the perception of the subject. Vibrations depend on the state of the road and the state of the car. Thus, our works are made of three complementary parts:
-Studying, measurement and defining a mathematical model of vibrations on a real moving vehicle,
-Simulation and reproduction of the vibrations on the driving simulator, -Experimental studies on subjects.
3.1. Vibrations on real vehicle
The road roughness, causes vertical acceleration of vehicle because of which passenger gets the proving and this adds to their discomfort. When a vehicle is being drive over the road, the
4
oscillations of its spring have frequencies which has not only dependent on the frequency at which road impulses or bumps are encountered but also on the relation between the spring stiffness and the mass of the spring part of vehicle. The real description of road is random in nature. Therefore, the statistical description of the track will be more appropriate. (Katu, Desavale, & Knanai)
Measurements have been made on real moving vehicle with accelerometer. They have been made on different roads at different speeds. The different measurement points are the ground and the seat. Vibrations are measured on the Z axis at a sample time of 100 Hz; based on Shannon’s theorem this allows us to make a FFT up to 50 Hz.
For all speed and roads, same expected vibrations spectra have been measured. The measured frequencies are 4, 12, 18 Hz.
Figure 4: Results of a measurement on the ground at 50 Kkm/h
So our hypotheses are:
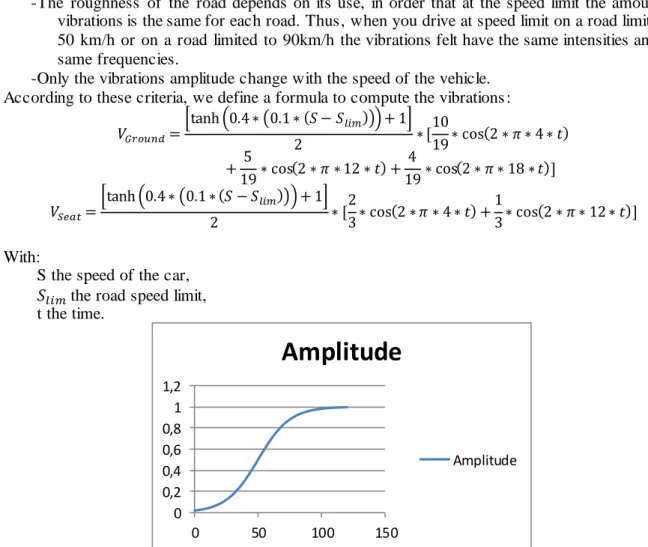
-The roughness of the road depends on its use, in order that at the speed limit the amount of vibrations is the same for each road. Thus, when you drive at speed limit on a road limited at 50 km/h or on a road limited to 90km/h the vibrations felt have the same intensities and the same frequencies.
-Only the vibrations amplitude change with the speed of the vehicle. According to these criteria, we define a formula to compute the vibrations :
[ ( ( ( ))) ] ( ) ( ) ( ) [ ( ( ( ))) ] ( ) ( ) With:
S the speed of the car, the road speed limit, t the time.
Figure 5 : Amplitude of the vibrations in function of the speed for a speed limit of 50km/h 0 0,2 0,4 0,6 0,8 1 1,2 0 50 100 150
Amplitude
Amplitude5 3.2. Vibrations on the driving simulator
The study has been done on SAAM, a six degree of freedom dynamic driver simulator from Institut Image, Arts et Metiers ParisTech.
Considering the frequencies range, devices that will reproduce the vibrations need to be able to produce very low frequencies. Gaming systems or cinema’s equipment are the best systems toproduce these vibrations.
That is the reason why the choosen systems are: -A Clark Synthesis TST429 for the seat
(5-17 000 Hz)
-A ButtKicker LFE for the ground (5-200 Hz) -A ButtKicker Gamer 2 for the pedals (5-200
Hz)
The TST429 is fixed on the seat frame under it, the ButtKicker LFE is fixed on a wood plank put on the ground and the ButtKicker Gamer 2 is fixed on the brake pedal jack. They each have one amplifier linked to a computer. They are controlled by a program made with Pure Data. The program get the amplitude on a UDP port and builds the different signals with different harmonics then sends the signals to each amplifier. The amplitude is computed in a ScanerStudio (software from Oktal company) module depending on the road under the car and the speed of the car.
3.3. Experimentation
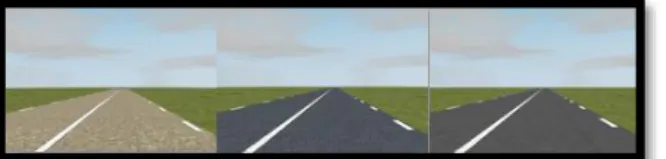
The subjects have to drive on three characteristic roads with three different speed limits 30, 50 and 70 km/h. Each road has a texture reflecting the visual quality of the road (cf. Figure 7).
Figure 7 : Different road textures for visual correlation.
The driving simulator is used in static mode in order to have a better feeling of the vibrations. First the subject drives without the vibration and after
the simulation he answers some questions. Then one day minimum after, he drives again with the vibrations this time and answers to the same questions. For each drive the head acceleration is measured to define the acceleration threshold. Acceleration is measured by an accelerometer disposed on the right of the head at the ear. It measures the , and the acceleration in m/s² and the ̇, ̇, ̇ as the yaw velocity, the pitching velocity and the roll velocity in rad/s (cf. Figure 10). These measures allow to define the acceleration threshold of each subject and each simulation.
Figure 6 : Vibration systems, TST429, LFE, and Gamer 2 30km/h speed limit 50km/h speed limit 70km/h speed limit
6 4. RESULTS AND ANALISYS
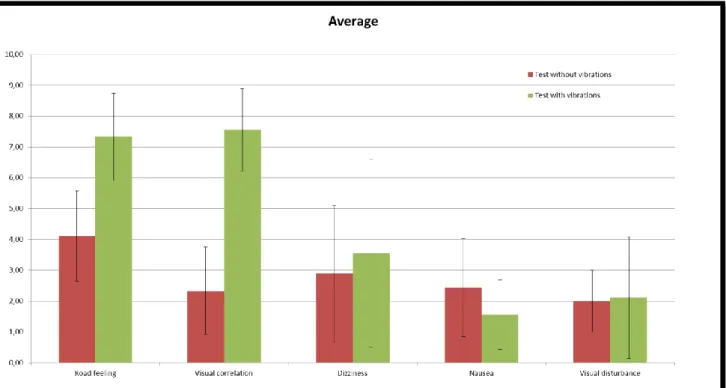
Nine subjects (30 years old and 10 years driving experience average) did the experimentation and answered to this list of questions:
-From 1 to 10, 10 the best and 1 the worst, did you have the feeling of the road under the car? -From 1 to 10, 10 the best and 1 the worst, how was the visual correlation between the visual
roughness of the road and the feeling?
-From 1 to 10, 1 the best and 10 the worst, did you feel dizziness? -From 1 to 10, 1 the best and 10 the worst, did you have nausea?
-From 1 to 10, 1 the best and 10 the worst, did you have visual disturbance?
Figure 9 : Mean results with standard deviation
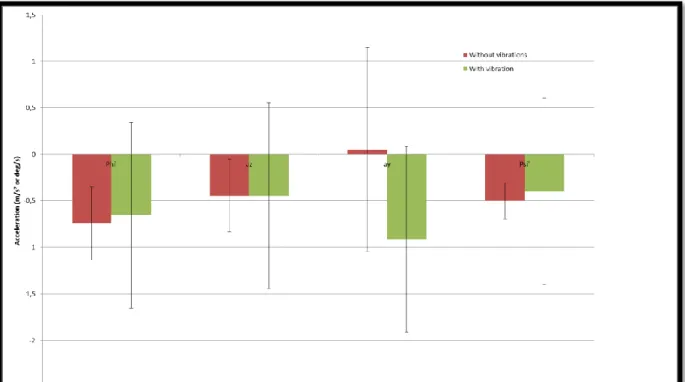
The two first columns (cf. Figure 9) represent the realism of the simulation and the last three represent the sickness. The implementation of vibration increases the realism without really impact with the simulation sickness. These results are confirmed by the head acceleration measures (cf. Figure 10). Actually the vestibular system of the humans can only detect the movements if they are above the perception thresholds. Many studies in series of experiments reported that the human detection threshold of the rotational movements is between 0.1°/s and 3.0°/s and the detection threshold of the linear motions is between 0.014 m/s2 and 0.25 m/s2. These detection threshold values depend on the duration of motion stimuli as well as the rates of the acceleration and they vary from pers on to person. (Qaisi & Treachtler, 2012) These analyses are confirmed by the Mann–Whitney U test. This test demonstrates that the two first columns reveal independent results between the with and the without vibrations simulation; with p=0,0014 and p=0,0003 while all other columns have dependent results with p=0,8551, p=0,1303, and p=0,5986.
7
Figure 10: Mean threshold with standard deviation
Test Without vibrations
Subjects Road feeling
Visual
correlation Dizziness Nausea
Visual disturbance 1 4 3 2 1 3 2 3 1 1 1 1 3 3 2 3 3 3 4 4 1 1 2 1 5 3 2 2 2 2 6 3 5 3 3 3 7 4 4 7 3 1 8 7 2 1 1 1 9 6 1 6 6 3
Test With vibrations
Subjects Road feeling
Visual
correlation Dizziness Nausea
Visual disturbance 1 9 8 1 1 2 2 8 9 1 1 1 3 8 6 8 3 7 4 7 8 1 1 1 5 8 6 2 4 2 6 7 9 4 1 3 7 4 7 6 1 1 8 8 9 1 1 1 9 7 6 8 1 1
8
Furthermore each subject say that vibration add something missing until now to the simulation. 5. CONCLUSION
In a driving simulation, the driver is immersed in the virtual world. This research work shows that the vibrations have to be produce on the floor and the seat to have an impact on the subject and the simulation. The computed vibrations, with the mathematical model based on observations and measures, have real impact on the subject, whereas it does not decrease the simulator sickness in a static configuration, it significantly increases the realism of the simulation and permits to the subject to project themselves more in the virtual world as if they were there.
We can assume that the mathematical model is appropriate and it is realistic to generate the vibration with these formulas:
[ ( ( ( ))) ] ( ) ( ) ( ) [ ( ( ( ))) ] ( ) ( ) With:
S the speed of the car, the road speed limit, t the time.
Whereas vibrations do not decrease the simulator sickness, they give a kind of dynamism to the simulation. Dynamism that jacks cannot retranscribe because it will damage the system. Actually the system is too heavy and has too much inertia to move with this kind of dynamism. For example with this system it is possible to exactly reproduce the sound and haptic feeling made when we drive on rumble strips (cf. Figure 11). For a futur work, it would be interesting to study the effect of vibrations on a dynamic simulation and how to produce vibrations on the steering wheel. And it will be interesting to take more measures on each subject besides the measures of the head acceleration.
Figure 11 : Rumble strips
REFERENCES
Brüel & Kjaer. (1989). Human Vibration.
Griffin, M. J. (1978). The evaluation of vehicle vibration and seats. Applied Eergonomics, 15-21. Katu, U. S., Desavale, R. G., & Knanai, R. A. (n.d.). Effect Of Vehicle Vibration On Human Body –
RIT Experience.
Lecclère, Q., Polac, L., Laulagnet, B., & Guyader, J.-L. (2006). Vibro-acoustique des moteurs d'automobile. Ref : bm2773, Techniques de l'ingénieur.
Qaisi, I. A., & Treachtler, A. (2012). Constrained Linear Quadratic Optimal Controller for Motion Control of ATMOS Driving Simulator. Driving Simulation Conference. Paris.
Qiu, Y., & Griffin, M. J. (2003). Transmission of fore–aft vibration to a car seat using field tests and laboratory simulation. Journal of sound and vibration, 135-155.