Use of Assessments to Inform Educational
Policies in French-Speaking Belgium
Dominique Lafontaine
In French-speaking Belgium, the national assessments developed only lately, and there are not yet national assessments developed by professionals that can be used to evaluate trends. Therefore, the only tools available to rigorously evaluate trends are international assessments. French-speaking Belgium has participated in interna-tional assessments since the early 1970s and their results are highly valued by policy- makers. Their level of awareness of the strengths and weaknesses of the edu-cation system can be considered as good. However, until recently, the impact of international assessments on education policies has been limited. Only scattered initiatives have been taken. From 2014, an extremely ambitious plan called Pacte
pour un enseignement d’excellence has been launched. The Pact tackles most of the systemic weaknesses of the education system in FS Belgium and addresses at the same time structural change (lowering grade repetition, moving to a comprehensive lower secondary education), curricular changes and governance in a long-term per-spective. A significant reform of the system of national assessments is currently under discussion.
Introduction
Belgium is a federal state. Besides the federal state, there are three “communities”, defined on the basis of language: the Flemish-, French- and German-speaking com-munities. Since 1989, the three education systems and their policies have been man-aged autonomously by their respective Ministries of Education. National assessment policies are different in each community and even the decision to participate in international assessments is taken at the community level. In view of this, covering
D. Lafontaine (*)
University of Liège, Liège, Belgium e-mail: dlafontaine@uliege.be
the three different systems in one contribution is not practicable. The focus will therefore be on the French community, for the simple reason that the author of this contribution is from the French community and is more knowledgeable about edu-cational policies and national and international assessments in this community. When the term “national” is used, it refers to French-speaking (FS) Belgium, not to Belgium as a nation.
The education system in Belgium is a non-comprehensive one. The orientation towards academic or vocational tracks officially starts at the end of grade 8. Beyond that point, the system tends to stream pupils according to their abilities. The propor-tion of pupils attending special educapropor-tion is rather high (4% of all pupils) (Fédérapropor-tion Wallonie-Bruxelles 2016). Rates of grade repetition are extremely high, the highest of any OECD country: by the age of 15, nearly one student out of two (46%) has repeated at least one grade (Quittre et al. 2018). There is no catchment area: students and their families can freely choose the school they want to attend without any geo-graphic limitation. This “free choice” results in huge competition between schools, which develop strategies to attract students. Middle-class parents develop strategies in order to find the “best” school for their children. This has been described by soci-ologists as a “quasi-market” (Dupriez and Maroy 2003). It results in huge differ-ences in school intake: on the one hand, “sanctuary” schools attended mostly by middle-class students; on the other hand, “ghetto” schools attended by lower-class students or students from a migration background. The system is highly segregated from both an academic and a sociocultural point of view (Monseur and Lafontaine 2009; Monseur and Lafontaine 2012). Since the end of the 1980s (1988), more resources have been allocated to schools attended by a high proportion of students coming from underprivileged backgrounds (“positive discrimination policy”) (Demeuse and Monseur 1999; Friant et al. 2008).
Teacher training for primary and lower secondary education takes the form of a 3-year bachelor’s programme and is organised in teacher training institutes (not in university faculties of education). For upper secondary education, teachers are trained at university, in a consecutive training model. They first study a subject (e.g. mathematics, science or French language) for at least 4 years, and then an additional half or full year is dedicated to pedagogy, educational psychology, didactics and practical training in the field.
Up to 2006, there was no external certificate assessment or examination at any level. All examinations were internal, designed by the teacher for his/her own stu-dents. Schools issued diplomas on the basis of their own criteria, and obviously the level of standards and value of diplomas were not equivalent from school to school. External “diagnostic” assessments had been set up in 1995, focusing on teachers and aimed at providing them with useful information about their students’ strengths and weaknesses in three domains: reading, mathematics and science. This kind of assessment, which still takes place, has no impact at all on students’ careers, which is why it will not be described in detail here (for additional information, see http:// www.enseignement.be/index.php?page=25162&navi=2024). Since 2006, external certificate assessments have been gradually adopted (in accordance with the Law of June 2006), firstly at the end of primary education (certificate of basic education,
grade 6), secondly at the end of lower secondary (grade 8, in mathematics, mother tongue, science and foreign languages only) and thirdly at the end of upper second-ary (grade 12). At that level, the scope of the assessment is very narrow (history in the academic track, reading informational texts in the vocational track), meaning that the certificate of upper secondary education is still delivered mostly on the basis of internal and local standards. The external certificate assessments are developed under the responsibility of the Compulsory Education Monitoring Service of the Administration of the Ministry of Education (http://www.enseignement.be/index. php?page=26245). The developers are teachers, supervised by inspectors. They have plenty of good will, very limited resources, and limited professional knowl-edge about assessments, cognitive item development and basic notions of psycho-metrics. A limited field trial is organised, but the psychometric properties of the tests are not controlled for.
Finally, and this is important with respect to international assessments, the sys-tem of national external assessments has been designed so that all tests are publicly available as soon as they have been taken. Items are obviously under strict embargo up to the time of testing; after that, all the material is released, so that parents, teach-ers and pupils can use the previous vteach-ersions of the tests for information and training. Consequently, as no item is kept under embargo, items cannot be reused from one year to the next for comparison and calibration purposes. Although the developers try to assess the same knowledge and skills each year, variations in the results can-not be interpreted as reflecting changes in students’ achievement. In other words, in terms of monitoring of the education system, there is no rigorously designed national assessment (such as NAEP in the USA or tests in the Netherlands developed by the CITO), supervised by assessment professionals, that can be used to evaluate trends. The only tools available to rigorously evaluate trends are international assessments. This has not prevented the media and others from using the national assessments as evidence of “true” variations in students’ achievement, even though academics have repeatedly pointed out their limitations.
The History of International Assessments
The French community has regularly taken part in the IEA studies (Six Subject Study, SIMSS, IEA Reading Literacy 1991, TIMSS 1995) (Lafontaine and Blondin 2004); since the beginning, results were reported separately for the Flemish and French communities. Despite alarming outcomes in FS Belgium, especially in sci-ence and reading comprehension, the impact on education policies – if any – has been very small. The IEARL results in 1991 (Lafontaine 1996) and the TIMSS results in 1995 (Monseur 1997) were reported in the media (to a lesser extent than PISA, however), but had limited or no impact on educational policies.
The power of the OECD and its eagerness to disseminate the PISA message as widely as possible have obviously led to the PISA results being more visible in the French community than the IEA studies. In 2001 especially, but also at the time of
the following PISA cycles, many articles/features were published in newspapers and magazines (even the most popular ones, such as TV magazines), debates on radio and TV channels were organised and PISA experts were regularly asked to give lectures to educational audiences (such as schools, teachers’ unions, inspec-tors, principals and parents’ associations) and public audiences (such as political parties). Since December 2001, every sneeze in the educational field has been related – rightly or wrongly – to PISA! This has been PISA’s achievement: when it comes to educational matters, it has become the measure of everything, a kind of all-purpose assessment, supposedly capable of providing answers to all questions.
International and/or National Assessments Today
Since 2000, the French Community of Belgium has participated in PISA, in PIRLS (2006, 2011 and 2016) and most recently in TALIS (2018). As the example of PISA will be examined hereafter, it is important to say a few words about the results in PIRLS and their dissemination. In the three cycles in which FS Belgium has partici-pated, it has ranked last among EU and OECD education systems. National reports have described the situation and given recommendations in terms of curriculum and teachers’ initial and in-service training (Lafontaine et al. 2017). Meetings and dis-cussions have been organised with the Ministry of Education, as well as with the Monitoring Compulsory Education Board. The decision has been taken by the authorities to avoid holding a press conference, on the grounds that the disastrous results would undermine teachers’ morale. In other words, when OECD pressure is not there to push decision-makers to disseminate the results widely, the impact of international assessments is similar to what it was in the 1980s and the 1990s. Knowledge of the results is restricted to a handful of researchers and stakeholders; decision-makers in education play the politics of the ostrich.
As a representative of FS Belgium in the IEA General Assembly, I have several times highlighted the interest and value of participating in other international stud-ies. Despite the authorities’ interest in participating, the main argument put forward for not doing so was a financial one. While it is true that budgets allocated to inter-national assessments are limited, they could obviously be increased if the political will were there.
An Example in Question: PISA Results and Their Links
with Educational Policies
An overview of the PISA results and trends is shown below with minimal use of figures. Those interested in more detail can access the “national” reports on the page http://www.aspe.ulg.ac.be/ or consult Baye et al. 2009; Demonty et al. 2013;
Lafontaine et al. 2003; Quittre et al. 2018; Lafontaine et al. 2019. Three main topics will be discussed: achievement, equity and segregation. As a reminder, three domains (reading, mathematics and science) are assessed in each cycle, but with a major focus on one domain.
Achievement
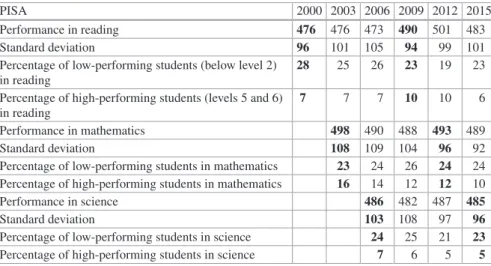
Since 2000, performances and, more broadly speaking, all indicators in the FS com-munity have been remarkably stable (Quittre et al. 2018) (Table 7.1). For the sake of clarity, we will comment only on the results of the cycles in which each domain is the major domain. In mathematics, the mean performance in all cycles was close to the OECD average: 498 in 2003, 493 in 2012 and 489 in 2015. In science, the mean performance is also stable across the different cycles, but significantly below the OECD average (486 in 2006 and 485 in 2015). In reading literacy, the mean performance was well below the OECD average from 2000 to 2006. In 2009 and 2012, the mean performance increased and reached the OECD average (501); how-ever, in 2015, it decreased again (483). There is no room here to develop an inter-pretation of this positive (followed by a negative) trend. According to our analyses (Lafontaine 2014), the change does not result from change in the curriculum or teaching practices, because no curricular change was implemented. Instead, it seems to be related to a structural reform in the organisation of lower secondary education (grades 7 and 8). In 2006–2007, in parallel with the introduction of a certificate assessment at the end of primary education, a reform (“réforme du 1er degré”) intro-duced remedial classes for students who had failed this examination. Since then, the
Table 7.1 Overview of the PISA results in French-speaking Belgium
PISA 2000 2003 2006 2009 2012 2015
Performance in reading 476 476 473 490 501 483
Standard deviation 96 101 105 94 99 101
Percentage of low-performing students (below level 2)
in reading 28
25 26 23 19 23
Percentage of high-performing students (levels 5 and 6)
in reading 7
7 7 10 10 6
Performance in mathematics 498 490 488 493 489
Standard deviation 108 109 104 96 92
Percentage of low-performing students in mathematics 23 24 26 24 24 Percentage of high-performing students in mathematics 16 14 12 12 10
Performance in science 486 482 487 485
Standard deviation 103 108 97 96
Percentage of low-performing students in science 24 25 21 23
Percentage of high-performing students in science 7 6 5 5
Note. The major domain per cycle is shown in bold. The time series begins when the domain is the major domain for the first time: 2000 for reading, 2003 for mathematics, 2006 for science
programme for these low achievers has been adapted: they receive extra classes, especially in mother tongue and mathematics, the goal being to prepare them to take this examination again until they pass it. Previously, students were oriented towards pre-vocational classes with no obligation to gain their certificate of basic education (CEB). It seems that this reform (since abandoned), combining the effects of an external assessment, a clear standard to reach and additional courses in the two main domains, led not only to an increase in the mean performance in reading, but also to a quite substantial reduction of the proportion of low achievers in reading (9% decreasing between 2000 and 2012).
Apart from this temporary improvement in reading performance in 2009 and 2012, the PISA results are congruent with the results of IEA surveys: TIMSS 1995 and PIRLS 2006 to 2016. Students’ performances, especially in reading literacy and science, have been – and still are – a matter of concern (Lafontaine et al. 2017; Monseur 1997). These quite poor performances in the three domains (which are, at best, close to the OECD average) correspond to an uneven distribution of the pro-portion of students of different levels of ability, especially in reading: FS Belgium has fewer high achievers (levels 5 and 6 on the PISA scale) than OECD countries on average, but above all has a higher proportion of low achievers.
In reading in 2000 (Lafontaine et al. 2003), for instance:
– 7.5% of the students showed an excellent level of reading literacy (level 5 and above). This proportion was only somewhat lower than the OECD average (9.5%).
– 28% of the students scored below level 2 (very low reading ability). This propor-tion of low performers was much higher than the average in the OECD countries (18%).
In mathematics, this asymmetry does not apply: the proportion of low and top performers is very close to the OECD average. In science (2006), as in reading, there were somewhat fewer top performers (7%) than the average in OECD coun-tries (9%), but significantly more low achievers (24% in FS Belgium and 19% on average).
The most striking result in the French community is the huge gap between top and low performers. The French community’s education system has one of the high-est such gaps (standard deviation), although it has been decreasing over time. The width of the dispersion is likely to be related to the frequent use of grade repetition in the French community. The French community has the highest rate of grade rep-etition among OECD countries: in PISA 2015, 46% of 15-year-olds had repeated at least one grade, and 13% out of this 46% had repeated at least two grades. In addi-tion, differences of achievement between academic and vocational tracks are very large (68 points on the PISA scale between academic and vocational tracks at grade 10) (Quittre et al. 2018).
Socioeconomic Gap
Since the beginning of PISA, numerous analyses have focused on equity, namely, the relationship between students’ sociocultural background (parents’ socio- professional status, parents’ level of education, migration background, family wealth and resources, cultural communication and so on) and achievement in read-ing, mathematical and scientific literacy (OECD 2011, 2016).
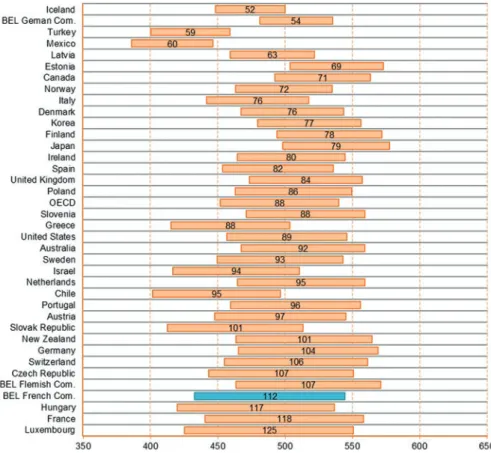
In terms of equity, the French Community of Belgium appears as one of the edu-cation systems in which the gap in performance according to socioeconomic status is the highest (Fig. 7.1.). In all cycles, the gap between the top quartile of students from the most privileged backgrounds and the bottom of most underprivileged stu-dents is more than 100, while the OECD average is around 80 (88 in 2015) (Quittre et al. 2018). Students who are vulnerable in terms of socioeconomic background are more at risk of being among the low achievers in the French Community of Belgium than similar subgroups of students in the majority of other education systems.
Segregation
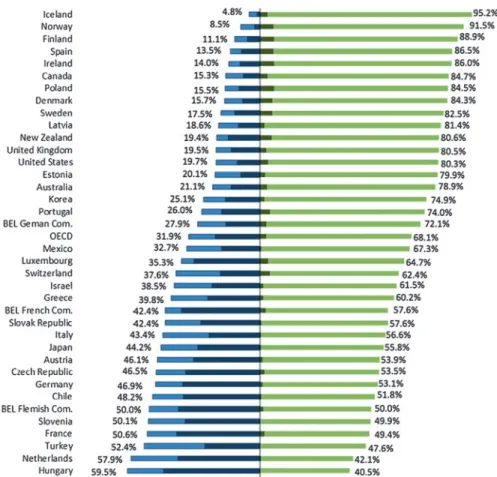
In French-speaking Belgium, the between-school variation is high: the perfor-mances in the PISA test are very different from one school to another. By compari-son, in the Nordic countries, school performances are very similar. The situation in FS Belgium has slightly improved over time: in 2006, the between-school variance was 46%; in 2015 it decreased to 42% (Quittre et al. 2018). As shown in Fig. 7.2, the percentage of the differences between schools explained by the socioeconomic composition of the schools is very high, one of the highest among OECD countries (around 75%). This means that students are sorted not only according to their abili-ties, but also according to their social background. One of the major lessons learned from PISA is that the French community education system is not successful in cop-ing with or compensatcop-ing for social inequalities. Although equity is highly valued in
Fig. 7.2 Breakdown of the variance between schools and within schools and proportion of the
variance explained by the socioeconomic status of the students and of the school (in bold). PISA 2015 data
official laws (especially in the “Décret Missions”, in which the goals of the educa-tion systems are defined), and despite compensating policies (positive discrimina-tion), the education system remains highly segregated, as demonstrated by PISA in an unequivocal way.
This overview of the results was the key message delivered by the successive national reports and by the PISA experts through reports, lectures, and interviews about PISA. The relative underachievement in reading and science calls for changes in teaching practices or curricular measures, while low equity and high school seg-regation call for more fundamental thinking about the core structure of the educa-tion system – the non-comprehensive or streaming/“segregated” approach reflected in grade repetition, early assignment to tracks and complete freedom of choice of schools (resulting in the so-called quasi-market).
How to Go Further? Critical Discussion
Before going into details, we want to underline that the results of PISA and other international assessments are valued by decision-makers in FS Belgium. PISA is neither strongly criticised nor disregarded. PISA and the results of other interna-tional studies are congruent with other indicators. The annual publication (Fédération Wallonie-Bruxelles 2016) issued by the Compulsory Education Monitoring Service also shows alarming results in terms of grade repetition, dropout and percentage of students leaving the education system at 18 without any certificate from secondary education.
PISA experts such as Prof. D. Lafontaine and her team are influential and often consulted by decision-makers; every Minister of Education since 2000, regardless of political affiliation, has paid careful attention to the PISA results. However, although efforts have been made to provide information to schools (principals and teachers), it cannot be taken for granted that PISA is well known by these categories of actors. Nevertheless, the main stakeholders represented at the Board of Compulsory Education – inspectors, teachers’ unions, parents’ associations and heads of education networks (organising state schools, municipalities and prov-inces, Catholic schools) – are well aware of the main PISA results. In terms of information and awareness among stakeholders, the situation is quite positive. In other words, the lack of major reform cannot be attributed to a lack of awareness.
Between PISA 2000 and 2015: Change in Educational Policies
No Change in Curricula
In terms of curricula, no change has been implemented since 2000. In the late 1990s, new standards were adopted defining key competencies for primary and secondary
competency- based pedagogy would contribute to an enhancement of students’ knowledge and skills. In the field of reading, there were scattered initiatives, but no major or comprehensive action was taken to change teachers’ practices, despite the fact that the national reports, especially the PIRLS ones, clearly showed that teach-ers’ practices for reading literacy in FS Belgium were outdated and that pupils defi-nitely had fewer opportunities to learn effective reading comprehension strategies than in more effective education systems (Lafontaine et al. 2017; Lafontaine et al. 2018).
Change in Terms of Governance
One domain in which PISA might have acted as a catalyst is the governance of the education system. Discussions around the creation of a Monitoring Compulsory Education Board and external assessments had started before the release of the PISA 2000 reports, but the process may have been sped up by PISA. A law adopted by Parliament in 2002 established a Board in which all the stakeholders involved in education are represented: the administration, the school organising authorities, teachers’ unions, inspectors, researchers in education, teacher training colleges and parents’ associations. The goals of this Monitoring Board include:
– Guiding educational reforms and helping their implementation – Developing a coherent system of indicators
– Defining priorities for in-service teacher training
– Organising external assessments in order to improve the quality of education
Equity and Segregation: Structural Reforms
After the results of the first PISA cycles, discussions and debates around equity issues and segregation were numerous. Many policy-makers and politicians, espe-cially those on the left wing, saw the inequity revealed by PISA as unacceptable.
Between 2003 and 2009, the two governments in which the Ministers of Education were socialist defined a plan called the “Strategic plan for education” in which several initiatives to reduce inequity and segregation were defined:
– Strengthening the resources allocated to underprivileged schools (Friant et al. 2008).
– Regulating the enrolment of pupils in secondary education (grade 7) and increas-ing the social mix in schools. Several versions of the “Décret Inscriptions” were adopted between 2007 and 2010. Despite the fact that this attempt to regulate the enrolment was restricted to grade 7 and preserved families’ right to choose a school, this law met with massive opposition from privileged families and the principals of the most privileged schools.
Apart from that, up to 2015, no major initiative was taken regarding the structural organisation of the education system, namely, the rate of grade repetition and early tracking. Several studies, including OECD reports, had highlighted the link between these stratification features and lack of equity (Mons 2007; Monseur and Lafontaine 2009; Monseur and Lafontaine 2012; OECD 2011, 2016). Between 2009 and 2014, a government formed from the same parties (socialists and Christian democrats), but in which the Minister of Education was a Christian democrat, explicitly opted for a “no-more-top-down-reform” approach in education; the Minister deliberately encouraged and supported only local initiatives. From 2014 on, with the same coali-tion partners and another Christian democrat Minister of Educacoali-tion, the new gov-ernment made a complete U-turn and launched an extremely ambitious plan called
Pacte pour un enseignement d’excellence (Pact for excellence in education). The main goal of the Pact is to “enhance the quality of teaching and education for all students”. All stakeholders have been involved in collaborative work on several topics since 2015. The process began in 2015 with two reports: an overview of the current situation, heavily relying on international assessments, and a report on knowledge and skills for the twenty-first century. Almost all topics related to educa-tion have been under scrutiny and some major reforms have been adopted, while others either definitely will or may be in the coming years, because the Pact goes beyond the term of the current government (2019). Some reforms are anticipated with long-term goals and gradual implementation.
Among the major topics, one might mention:
– A substantial increase in the resources allocated to kindergarten – a comprehensive school from grade 1 to grade 9
– The halving of grade repetition by 2030
– An update and revision of all curriculums, at all levels and in all subjects – A huge bank of validated tools to help teachers adapt their teaching for all levels
and all subjects
– In terms of governance, a shift towards a system giving more autonomy to schools but making them accountable.
For people interested in more details, the five strategic axes of the Pact are sum-marised in a document available (in French only) at http://www.pactedexcellence. be/index.php/lessentiel-du-pacte/. Although the need to strengthen teacher train-ing – initial and in-service – is highlighted in the Pact, a reform of teachers’ initial training is not part of the Pact, because this dossier is the responsibility of another Minister – the Minister of Higher Education – controlled by the other coalition party (the socialists).
It is far too soon to anticipate what could be the effects of the Pact. For sure, this is an extremely ambitious multidimensional plan that tackles most of the systemic weaknesses of the education system in FS Belgium at the same time, which is a huge challenge. The time span of implementation is lengthy: some measures have already been adopted, such as the new monitoring of schools, while others are scheduled for the long term (i.e. the comprehensive school, gradually starting in 2021 with a cohort of 5-year-olds).
One group has just started work on how to redefine the system of national assess-ments (those leading to certificates and the diagnostic ones) in parallel with interna-tional assessments and in congruence with the new comprehensive school system. This group has to meet several challenges. In my view, one critical decision is what should be assessed at the end of the comprehensive school (grade 9): should the assessment focus only on minimal competencies defined in the standards, or should it include a broader range of knowledge and skills, and different levels to achieve in order to access different tracks? The direction that is taken will clearly have a back-wash effect on the meaning of this new comprehensive school. A second focus of attention is who will be in charge of the development of national assessments in the future. So far they have been developed by teachers supervised by inspectors and with very limited resources. This system has clearly reached its limits and it is time to switch to a more professional approach matching the high ambitions of the Pact in terms of excellence. Excellence in teaching also means excellence in assessment policies and high quality of testing instruments. In this regard, decisive progress must be achieved.
References
Baye, A., Fagnant, A., Hindryckx, G., Lafontaine, D., Matoul, A., & Quittre, V. (2009). Les com-pétences des jeunes de 15 ans en Communauté française en sciences, en mathématiques et en lecture. Résultats de l’enquête PISA 2006. Cahiers des Sciences de l’Éducation, 29–30, 1–245. Retrieved from http://hdl.handle.net/2268/19520.
Demeuse, M., & Monseur, C. (1999). Analyse critique des indicateurs déterminant l’attribution des moyens destinés à la politique de discrimination positive en Communauté française de Belgique. Mesure et évaluation en éducation, 22(2–3), 97–127.
Demonty, I., Blondin, C., Matoul, A., Baye, A., & Lafontaine, D. (2013). La culture mathématique à 15 ans. Premiers résultats de PISA 2012. Cahiers des Sciences de l’Éducation, 34, 1–28. Retrieved from http://www.aspe.ulg.ac.be/Files/premiers_resultats_pisa_2012__cahiers_34_. pdf.
Dupriez, V., & Maroy, C. (2003). Regulation in school systems: A theoretical analysis of the structural framework of the school system in French-speaking Belgium. Journal of Education Policy, 18(4), 375–392.
Fédération Wallonie-Bruxelles. (2016). Les indicateurs de l’enseignement. Bruxelles: Service général du pilotage du système éducatif. Edition 2016. Retrieved from http://www.enseigne-ment.be/index.php?page=0&navi=2264B13
Friant, N., Demeuse, M., Aubert, A., & Nicaise, I. (2008). Les politiques d’éducation prioritaire en Belgique: deux modes de régulation des effets d’une logique de marché. In M. Demeuse, D. Frandji, D. Greger, & J.-Y. Rochex (Eds.), Les politiques d’éducation prioritaire en Europe. Conceptions, mises en œuvre, débats (pp. 85–133). Institut national de recherches péda-gogiques: Lyon.
Lafontaine, D. (1996). Performances en lecture et contexte éducatif. Bruxelles: De Boeck. Lafontaine, D. (2014). A petits pas dans la bonne direction. Traces de changements, 215, 4–5.
Retrieved from http://hdl.handle.net/2268/173350.
Lafontaine, D., & Blondin, C. (2004). Regards sur les acquis des élèves en Communauté française Apports des enquêtes de l’I.E.A, de PISA et des évaluations externes. Bruxelles: De Boeck.
Lafontaine, D., Baye, A., Burton, R., Demonty, I., Matoul, A., & Monseur, C. (2003). Les com-pétences des jeunes de 15 ans en Communauté française en lecture, en mathématiques et en sciences. Cahiers du Service de Pédagogie expérimentale, 13–14, 1–230.
Lafontaine, D., Dupont, V., & Schillings, P. (2017). Pratiques d'enseignement et compétences en lecture des élèves: qu’évaluent les enquêtes internationales et que peuvent en apprendre les enseignants? In M. Bianco & L. Lima (Eds.), Comment enseigner la compréhension de lecture (pp. 63–81). Paris: Hatier.
Lafontaine, D., Dupont, V., & Schillings, P. (2018). Teaching and assessing reading literacy in primary education: Identifying patterns of differences between English, German and French- speaking education systems (PIRLS 2016) (IEA Compass: Briefs in Education, 4). Amsterdam: IEA.
Lafontaine, D., Bricteux, S., Hindryckx, G., Matoul, A., & Quittre, V. (2019). Performances des jeunes de 15 ans en lecture, mathématiques et sciences. Premiers résultats de PISA 2018 en Fédération Wallonie-Bruxelles. Université de Liège: Analyse des systèmes et des pratiques d’enseignement.
Mons, N. (2007). Les nouvelles politiques éducatives. Paris: PUF.
Monseur, C. (1997). L’enseignement des sciences est-il dans le 36e dessous? Unpublished
docu-ment. Université de Liège, Liège.
Monseur, C., & Lafontaine, D. (2009). L’organisation des systèmes éducatifs: quel impact sur l’efficacité et l’équité? In V. Dupriez & X. Dumay (Eds.), L’efficacité en éducation, promesses et zones d’ombre (pp. 185–219). Bruxelles: De Boeck.
Monseur, C., & Lafontaine, D. (2012). Structure des systèmes éducatifs et équité: un éclairage international. In M. Crahay (Ed.), Pour une école juste et efficace (pp. 145–173). Bruxelles, Belgique: De Boeck.
OECD. (2011). PISA 2009 results. Overcoming social background. Equity in learning opportuni-ties and outcomes. Paris: OECD.
OECD. (2016). PISA 2015 results. Excellence and equity in education. Paris: OECD.
Quittre, V., Crépin, F., & Lafontaine, D. (2018). Les compétences des jeunes en sciences, en mathé-matiques et en lecture. Résultats de PISA 2015 en Fédération Wallonie-Bruxelles. Cahiers des Sciences de l’éducation, 37, 1–188. Retrieved from http://hdl.handle.net/2268/218401.