ON AFRICAN ECOSYSTEMS “CLANIMAE”
D.VERSCHUREN,P.-D.PLISNIER,C.COCQUYT,H.HUGHES, J.LEBRUN,V.GELORINI,B.RUMES,G.MAHY,L.ANDRÉ
Biodiversity
Promotors
Universiteit Gent (UGent)
Prof. Dr. Dirk Verschuren, Limnology Unit, Department of Biology
Royal Museum for Central Africa (RMCA)
Prof. Dr. Luc André, Biogeochemistry and aquatic geochemistry Unit, Mineralogy and Petrography
Gembloux Agro-Bio Tech, Université de Liège (ULg)
Prof. Dr. Laurent Bock, Laboratoire d‟Ecologie, Unité Sol-Ecologie-Territoire
National Botanic Garden of Belgium (NBGB)
Dr. Christine Cocquyt, Department Cryptogamy
York Institute for Tropical Ecosystem Dynamics (KITE)
Dr. Robert A. Marchant, Environment Department, University of York
Authors of this report
Dirk Verschuren (Ugent), Pierre-Denis Plisnier (RMCA), Christine Cocquyt (NBGB), Harold Hughes (RMCA), Julie Lebrun (ULg), Vanessa Gelorini (UGent), Bob Rumes (UGent), Grégory Mahy
(ULg), Luc André (RMCA)
(SSD)
FINAL REPORT
CLIMATIC AND ANTHROPOGENIC IMPACTS ON AFRICAN ECOSYSTEMS
“CLANIMAE”
D/2011/11/53
Published in 2011 by the Belgian Science Policy Avenue Louise 231 Louizalaan 231 B-1050 Brussels Belgium Tel: +32 (0)2 238 34 11 – Fax: +32 (0)2 230 59 12 http://www.belspo.be
Contact person: Sophie Verheyden +32 (0)2 238 36 12
Neither the Belgian Science Policy nor any person acting on behalf of the Belgian Science Policy is responsible for the use which might be made of the following information. The authors are responsible for the content.
No part of this publication may be reproduced, stored in a retrieval system, or transmitted in any form or by any means, electronic, mechanical, photocopying, recording, or otherwise, without indicating the reference:
Verschuren, D., Plisnier, P.-D., Cocquyt, C., Hughes, H., Lebrun, J., Gelorini, V., Rumes, B., Mahy, G., André, L. Climatic and Anthropogenic Impacts on African Ecosystems. Final Report. Brussels: Belgian Science Policy 2011 – 93 pp. (Research Programme Science for a Sustainable Development)
Contents
SUMMARY ... 5
A. Context ... 5
B. Objectives ... 5
C. Major results and conclusions of the research ... 6
D. Contribution of the project to sustainable development policy ... 8
E. Keywords ... 10
1. INTRODUCTION ... 11
1.1 Context of the research ... 11
1.2 CLANIMAE research objectives and expected outcomes ... 13
2. METHODOLOGY AND RESULTS ... 15
2.1. Methodology of research ... 15
2.2 Project results in relation to the work programme ... 16
3. POLICY SUPPORT ... 73
4. DISSEMINATION AND VALORISATION ... 75
4.1. Knowledge transfer to local stakeholders and the general public .. 75
4.2 Invited seminars for a non-specialist audience ... 77
4.3 Active contributions to (inter-)national research conferences ... 78
5. PUBLICATIONS ... 83
5.1 PhD theses ... 83
5.2 Published, in press or submitted (*= included in Annex 1) ... 83
5.3 Manuscript in advanced stage of preparation ... 84
6. ACKNOWLEDGEMENTS ... 87
7. REFERENCES ... 89
SUMMARY A. Context
The magnitude and geographic reach of human impact on Earth‟s biosphere has increased rapidly over the last century, in particular in East Africa where rates of population growth and the intensification of agriculture are among the highest in the world, and where developing economies strongly depend on water and other goods and services provided by natural ecosystems. Economic development with conservation of biodiversity and ecosystem functioning requires spatially and temporally explicit knowledge of the timing and relative magnitude of (pre-)historical and modern human impact on terrestrial and aquatic ecosystems to 1) evaluate the current health of these ecosystems and their resilience to anthropogenic disturbance, 2) model the range of their possible responses to future climatic, demographic and economic change, and from these 3) develop locally optimal strategies for land and water-resource management.
B. Objectives
CLANIMAE aimed to produce guidelines for sustainable management of land and water resources in tropical East Africa, partly through comparative study of pristine and disturbed ecosystems in the modern landscape, and partly by reconstructing the long-term historical perspective to climate-environment-human interactions affecting those ecosystems today. This „the past is the key to the present (and future)‟ approach was developed by coupling data of past vegetation and water-quality changes preserved in dated lake-sediment records to information on decadal to century-scale climate variability across the gradient from humid western Uganda to semi-arid eastern Kenya. With this methodology, CLANIMAE achieved to
1) separate the influences of past natural climate variability and past human activity on East African ecosystems, and determine the timing and relative magnitude of pre-20th century ecosystem disturbances by indigenous people
compared to colonial-era and recent landscape alteration;
2) determine the severity of water-quality losses due to siltation and excess nutrient input directly caused by deforestation and agriculture, compared to temporal variability in water quality associated with natural long-term ecosystem dynamics; and
3) evaluate the resilience of African ecosystems, and the prospects for restoration of disturbed ecosystems if human pressure were to be reduced. C. Major results and conclusions of the research
CLANIMAE activities were grouped in 5 work packages dealing with 1) the calibration and validation of paleoenvironmental indicators; 2) reconstruction of past climate variability; 3) reconstruction of (pre-)historical changes in terrestrial ecosystems; 4) reconstruction of (pre-)historical changes in water quality; and 5) data integration and causal attribution of past environmental change. Part of these activities were developed through comparative study of diverse crater lake ecosystems in western Uganda. We completed seven field campaigns, during which we surveyed a total of 66 lakes. For all lakes we collected data on basin morphometry, land use, water-column transparency and frequency of mixing, water chemistry, nutrients, aquatic biota (algae, zooplankton, zoobenthos) and aquatic productivity; and collected intact surface-sediment samples for calibration of diverse paleoecological proxies in relation to modern-day environmental gradients and the intensity of human activity within lakes‟ catchments. Analysis of the water-quality and environmental data revealed significant negative exponential relationships between transparency (measured as Secchi depth, SD) and total phosphorus concentration, and between transparency and algal biomass (measured as the concentration of chlorophyll a). This relationship allows rough estimation of the productivity of Uganda crater lakes using simple measurements of Secchi disk depth. There was no significant correlation between transparency and dissolved inorganic nitrogen. Our data indicate that the water column of most fresh Uganda crater lakes mixes completely at least occasionally, but only those less than about 30 m deep mix completely at least once per year. Meteorological conditions allowing the complete mixing of deeper lakes (cold air temperature coinciding with windy conditions) are relatively rare, on the order of once in several decades for some of the deepest lakes.
We then selected 30 principal study lakes to determine the influence of water-column depth and frequency of mixing on a lake‟s vulnerability to water quality loss when subjected to human exploitation of the surrounding landscape. We classified these lakes according to their aquatic productivity using the Trophic Lake index TLi = Chl a/SD. Among the 30 study lakes, 7 are oligotrophic (low productivity, TLi < 0.02), 9 are mesotrophic (moderate productivity, 0.02 < TLi < 0.12), 11 are eutrophic (high productivity, 0.12 < TLi < 0.6) and 3 are hypertrophic (very high productivity, TLi ≥ 0.6). Uganda crater
lakes not or little impacted by human activity tend to be oligotrophic when >90 m deep, and mesotrophic when <90 m deep. Lakes with significant human impact can be oligotrophic (depth >90 m), mesotrophic (depth range 35-90 m) or eutrophic/hypertrophic (depth <35 m). Thus, significant land use within a crater basin is likely to raise the productivity of shallow and moderately deep lakes, while very deep lakes remain relatively unaffected. The large volume of their rarely mixed lower water column allows more or less permanent nutrient storage, because the low frequency of deep mixing hampers nutrient recycling to the lake surface where production takes place.
CLANIMAE developed the first inference model to reconstruct past changes in the aquatic productivity of African lakes based on assemblages of fossil diatom algae preserved in lake sediments. Simultaneous investigation of the silicon-isotope composition of fossil diatoms as a possible geochemical tracer for past aquatic productivity resulted in improved understanding of the important silica cycle in African lakes. We also studied environmental controls on the distribution of aquatic plants in Ugandan crater lakes, similarly to explore their value as environmental indicators. This analysis revealed eight major ecological communities, each with particular indicator species and with distinct habitat requirements for local water depth, distance from shore, transparency (or its inverse, turbidity), temperature, dissolved ion content and dissolved oxygen. Use of fossil remains of aquatic plants to infer past changes in lake hydrology and water quality is compromised by poor preservation of several species, which introduces bias in paleo-environmental interpretation. This can be partly resolved by using well-preserved species as proxy indicator for particular aquatic plant communities. Parallel studies on the distribution of Cladocera (water fleas) and Ostracoda (mussel shrimps) in 62 Uganda crater lakes demonstrated their potential as biological indicators for water quality and ecosystem health in East African lakes. By playing an important role in the aquatic food web, both groups contribute to the ecological integrity of these lake ecosystems. The distribution of Cladocera among lakes was influenced mainly by nutrient availability (total phosphorus concentration), aquatic plant diversity, pH and the fraction of the lake basin under agriculture.
An important part of the work programme focused on reconstructing past vegetation dynamics based on analysis of fossil pollen in well-dated lake-sediment records. We also calibrated the magnitude of terrestrial ecosystem response to climate change as recorded in pollen data, by comparing the vegetation history of a pristinely natural and an anthropogenically disturbed landscape. We found that even a few decades of mildly wetter weather
(5-10% more rainfall), such as during the late 19th century and in the 1960s-1970s,
caused significant migration of the grassland-woodland ecotone. This finding is important because this ecotone reflects the difference in ecological carrying capacity required for pastoralism vs. (irrigated) crop agriculture.
Some important African food staples such as banana can be traced in time using phytoliths, glass bodies present in plant tissue. Partly through a BelSPO-funded visiting postdoctoral fellowship, CLANIMAE validated fossil phytoliths as indicator of past banana cultivation by calibrating the relation between phytolith abundance in the sediments of 25 Ugandan lakes and the surrounding cover of banana plantations. This test classified land-cover in 6 types of natural vegetation, 16 types of cultivated crops, and 4 types of fallow agricultural land. We used the same sediment samples and land-cover data to calibrate the ecological indicator value of African non-pollen palynomorph microfossils recovered in fossil pollen preparations, also along a landscape gradient ranging from pristinely natural to severely impacted by human activity. CLANIMAE produced new vegetation reconstructions for the Queen Elisabeth NP, Bunyaruguru and Kasenda areas of western Uganda, and for the eastern Lake Victoria and Mt. Kilimanjaro areas of southern Kenya. These and published records indicate that significant human impact on the East African landscape (deforestation, crop cultivation) dates back to (at least) ~1000 AD in sub-humid western Uganda, and to ~1700 AD in central Kenya. Semi-arid environments reveal tentative signatures of land use by pastoralists dating back up to 600 years, but the more intense vegetation and soil disturbance typical of crop cultivation, and the resulting water-quality loss, appears mostly limited to the last 70-80 years. Fossil-diatom data from Lake Chibwera showed no evidence of recently increasing productivity or water-quality loss, consistent with the undisturbed condition of savanna vegetation in Queen Elisabeth National Park. In contrast, data from the heavily impacted Lake Katinda (and Kanyamukali) indicate that anthropogenic water-quality loss started ~700 years ago. Earlier evidence for increased productivity can also be explained by temporary, climate-driven episodes of low lake level. D. Contribution of the project to sustainable development policy
Referring to stated priorities of the „Science for a Sustainable Development‟ (SSD) programme, CLANIMAE addressed important research questions with critical relevance to the environmental policy on 1) sustainable economic development, 2) natural resource management, 3) biodiversity conservation, 4) adaptation of vulnerable communities to global change, and 5) a more
humane globalization. Project results particularly relevant to policy development on water and land resources in tropical Africa are:
1) The productivity of Uganda crater lakes can be monitored using simple, repeated measurements of water-column transparency with a Secchi disk. 2) The vulnerability of Uganda crater lakes to eutrophication and water-quality
loss for a given intensity of land use is strongly related to lake depth and the associated frequency of water-column mixing. Lakes < 35 m deep are highly vulnerable, lakes > 90 m deep are relatively resistant to water-quality loss. In their pristine condition, shallow Uganda lakes are usually mesotrophic (with slightly elevated productivity), not oligotrophic (unproductive).
3) Clear-water crater lakes (now almost without exception >90 m deep) are a most valuable source of drinking-quality water, and should be managed for ecotourism and modest recreation only. More productive lakes of shallow or intermediate depth (35-90 m) already subject to intensive land use can be managed for fisheries development and agricultural water extraction, the latter within limits determined by lake volume and water renewal rate. In both shallow and intermediate-depth lakes, runaway algal production leading to noxious blooms and frequent fish kills can be avoided by creating buffer strips of vegetation preventing soil run-off from reaching the lake. Fish farming should be limited to productive shallow lakes, where added nutrients and food are continually recycled into the water column.
4) Variation in species of aquatic plants, diatom, zooplankton and zoobenthos along gradients of natural habitat and intensity of human impact confirm their applicability as biological water-quality indicators in African lakes. 5) Evidence for major natural vegetation response to modest historical rainfall
variability shows that strategies for sustainable economic development must take into account large temporal variability in ecosystems, which affects their carrying capacity and realized service to society.
6) In semi-arid regions (e.g., the central Kenya Rift Valley), hydrological sensitivity of lakes to naturally large water-balance fluctuations requires creation of a water-resource buffer against intermittent severe drought. Studies of sedimentation help set appropriate limits to water extraction by identifying the lake-level threshold below which a clear-water, healthy ecosystem state switches to a turbid state with poor water quality.
7) The crater lakes of Uganda carry value well beyond their own economic significance as analogs of ecosystem functioning in the large lakes Victoria and Tanganyika, in their historical, present-day and possible future state.
E. Keywords
Biodiversity, climate change, East Africa, ecosystem services, hydrology, natural resources, paleoecology, soil erosion, sustainable water-resource development, vegetation dynamics, water quality
1. INTRODUCTION
1.1 Context of the research
The magnitude and geographical reach of human impact on the Earth‟s biosphere has increased rapidly over the last 100-200 years, and rates attained in the last three decades are unprecedented (IGBP-LUCC, 2005). This has resulted in a critical situation of widespread biodiversity loss and ecological damage, which can only be countered by implementing targeted policies which successfully balance the needs of human populations with the space and resources available to them. To help marry the goal of sustainable development with meaningful conservation of natural ecosystems and biodiversity in a rapidly changing world, climate and natural-resource modelers urgently need both spatially and temporally explicit databases of historical land use at regional scales (Lambin & Geist 2001). Specifically, we critically need a long-term historical perspective to modern-day climate-environment-human interactions, in order to
1) properly evaluate the current health of regional ecosystems and their resilience to diverse anthropogenic disturbances,
2) model the range of potential ecosystem responses to future climate change and demographic pressures, and, based on this understanding,
3) develop sound local strategies for ecosystem management and biodiversity conservation.
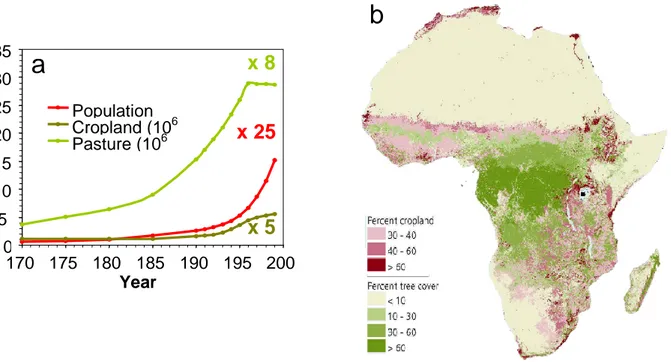
In other words, we need to document the exact timing (onset), trajectory (evolution), and relative magnitude of ancient and modern human impact on the natural environment in specific world regions (HITE, 2002). This is particularly the case for tropical East Africa, where increases in population and natural resource use are among the highest in the world (Fig. 1a), and developing economies strongly depend on (often scarce) water resources and other goods and services provided by natural ecosystems (Fig. 2). Although most climate models predict East African rainfall to increase rather than decrease in a greenhouse world (IPCC 2007), its beneficial effect will most likely be lost because large-scale forest clearance has compromised the recharge of aquifers which used to provide a buffer against episodes of prolonged drought (Fischer & Heilig 1997). Large-scale stripping of natural vegetation in both sub-humid and semi-arid African landscapes (Fig. 1b) has also contributed to massive soil erosion, devastating floods, and excess nutrient inputs to lakes and
Fig. 1. a. The area of land under cropland and pasture in East Africa has multiplied over the past
200 years in proportion to population size, but in recent decades has reached a plateau, suggesting that unexploited land in suitable climate regimes and soils is becoming scarce. Based on data from Klein Goldewijk (2001). b. Human impact on the landscape in sub-Saharan Africa is most intensive in deciduous mosaic forest and grass or scrub savanna, located in sub-humid to semi-arid climate regimes.
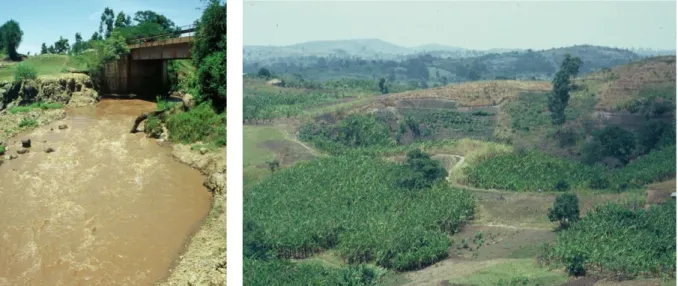
Fig. 2. The west-to-east climate gradient from a humid climate regime in western Uganda to a
semi-arid climate regime in eastern Kenya translates into a gradient of agricultural practices, from rain-fed cultivation to irrigated cultivation using surface waters (lakes, rivers) to irrigated cultivation using wells pumping fossil groundwater.
0 5 0 10 0 15 0 20 0 25 0 30 0 35 0 170 0 175 0 180 0 185 0 190 0 195 0 200 0 Year AD Population (106) Cropland (106 Mha) Pasture (106 Mha)
x 8
x 25
x 5
a
b
coastal marine habitat (Fig. 3). These impacts seriously threaten the natural functioning of terrestrial and aquatic ecosystems, and thus also the goods and services they provide to human society.
Fig. 3. Soil erosion and flooding due to the large-scale stripping of natural vegetation.
1.2 CLANIMAE research objectives and expected outcomes
The principal objective of the CLANIMAE project is to produce guidelines for sustainable management of land and water resources in tropical East Africa. Given the above-mentioned knowledge gaps, CLANIMAE specifically aimed to achieve the following outcomes:
1) separate the influences of past natural climate variability and past human activity on East African ecosystems;
2) determine the timing and relative magnitude of pre-20th century ecosystem
disturbances by indigenous people compared to colonial-era and recent landscape alteration;
3) determine the severity of lake water-quality losses due to siltation and excess nutrient input directly linked to deforestation and agriculture, compared to temporal variability in water quality associated with natural long-term ecosystem dynamics;
4) determine the influence of water-column depth and frequency of mixing on a lake‟s vulnerability to water quality loss when subjected to human exploitation of the surrounding landscape; and
5) evaluate the resilience of African ecosystems, and the prospects for restoration of disturbed ecosystems if human pressure were to be reduced.
2. METHODOLOGY AND RESULTS 2.1. Methodology of research
CLANIMAE has pursued these research objectives partly through comparative study of natural (pristine) and disturbed (impacted) ecosystems in modern-day western Uganda, and partly by reconstructing the long-term historical perspective to the climate-environment-human interactions affecting those ecosystems today. This „the past is the key to the present and future‟ approach was developed by coupling data of past vegetation and water-quality changes preserved in dated lake-sediment records to information on decadal to century-scale climate variability, across the climatic moisture-balance gradient from humid western Uganda to semi-arid eastern Kenya. The essential characteristic of this project, therefore, is that it addressed questions of climate-environment-human interaction at the time scales at which the relevant processes actually occur. Our integrated paleoecological research method involved 1) calibration of new paleo-environmental proxies along modern-day regional gradients of environmental variables sensitive to human impact; 2) validation of those and more traditional proxies in the time domain; 3) production of a significant number of new, multi-proxy paleoenvironmental reconstructions from key sites in equatorial East Africa; and 4) regional integration of these site-specific reconstructions to obtain a coherent regional assessment of the timing, magnitude and principal causes of past landscape and water-quality changes.
Evidently, this project nor any research investment can ever achieve a fully complete reconstruction of historical climate-environment-human interactions throughout East Africa at the local scale (i.e., all individual lakes and terrestrial ecotones). Success in achieving our research objectives required 1) that the network of selected study sites adequately captured regional gradients in climate (humid to semi-arid) and human impact (historical versus recent, severe versus relatively benign), and 2) that all project sites produced data of comparable quality and information content. Project tasks were facilitated considerably by substantial previous work by UGent (partner 1) on the calibration and validation of climate proxies in African lakes, and availability of a substantial body of high-quality paleo-environmental reconstructions. By filling critical data and knowledge gaps, CLANIMAE optimally exploited these existing reconstruction methods and existing paleoenvironmental data sets. Activities funded by this project have largely focused on study lakes in the humid and
sub-humid regions of western Uganda. All CLANIMAE fieldwork was conducted with research permission from the Uganda National Council for Science & Technology (UNCST permit NS21), the Uganda Wildlife Authority (UWA permit TBDP/RES/50), and the Permanent Secretary of the Ministry of Education, Science & Technology of Kenya (MOEST permit 13/001/11C).
2.2 Project results in relation to the work programme
CLANIMAE activities were grouped in 5 work packages dealing with 1) comparative analysis of modern-day lake ecosystems, and calibration of paleoenvironmental indicators; 2) reconstruction of past climate variability; 3-4) reconstruction of (pre-)historical changes in terrestrial ecosystems and water quality; and 5) data integration and causal attribution of past environmental change.
Work package 1 activities were developed through comparative study of the diverse crater lake ecosystems in western Uganda. We completed six field campaigns, during which we surveyed a total of 66 lakes, 38 lakes in the Kasenda-Fort Portal area; 28 lakes in the Kikorongo-Bunyaruguru area. For all lakes we collected data on basin morphometry, land use, water-column temperature, pH, oxygen content and transparency, water chemistry, nutrients, aquatic biota (phytoplankton, zooplankton, zoobenthos) and aquatic productivity (Table 1). In each lake we also collected intact surface-sediment samples from a mid-lake location to calibrate a range of paleoecological proxies in relation to modern-day ecological gradients and the intensity of human activity within the lakes‟ catchments. To record seasonal patterns of water-column stratification and mixing we installed chains of automatic water-temperature loggers in a total of eight study lakes, each consisting of four ONSET Tidbits v2 or VEMCO Minilog 12 thermistors. These loggers were downloaded in August 2008, yielding 18 contiguous months of data. The resulting collection of CLANIMAE field data were added to an accumulating long-term dataset of basin morphometry, temperature (e.g., Fig. 4), oxygen, transparency and algal productivity from a total of 83 Ugandan crater lakes (Verschuren et al., unpublished data). This includes all published data (Beadle, 1966; Melack 1978; Kizito et al., 1993; Chapman et al. 1998) and unpublished data previously collected by UGent (2000-2002), Dr. D. A. Livingstone (1994) and Dr. L. Chapman (late 1990s).
Pearson correlation coefficients between environmental characteristics of the Uganda crater lakes, based on pre-existing and new CLANIMAE data, are
L a ke Name L a ke Dep th (m) A n th ro p ic Im p a ct in d e x S e cch i D isk De p th (c m ) D e p th to a n o xia (m) Turb idity (N TU) T o ta l P h o s p h o rus (m g /l) T o ta l N itr o g e n (m g /l) Chl o rop h yll a (µg /l) T rop h ic L a ke in d e x Tr o p h ic Cat e g o ry Kyasunduka 2 1 20 1,5 71,2 0,23 3,71 147,2 7,362 H Nyungu 23 3 25 2,8 66,3 0,23 47,1 1,882 H Nyamusingere 4 0 40 3,3 25,2 0,07 2,29 32,2 0,805 H Katinda 16 3 58 3,0 34,0 0,10 1,66 31,7 0,552 E Kitere 51 2 61 2,0 7,6 0,23 1,44 32,4 0,536 E Saka 10 3 30 3,4 74,7 0,40 15,9 0,530 E Mbajo 35 2 59 4,3 11,0 0,14 2,99 24,8 0,424 E Mirambi 21 3 82 5,3 24,9 33,2 0,405 E Kanyamansira 31 1 57 7,5 16,7 0,08 1,54 20,7 0,363 E Lugembe 18 3 70 6,6 6,3 0,09 0,55 19,76 0,282 E Kifuruka 5 3 75 4,0 11,7 0,02 0,66 15,6 0,208 E Kasenda 14 2 95 6,4 6,2 0,04 0,62 17,28 0,182 E Nyabikere 57 1 146 3,7 4,0 0,08 1,01 22,03 0,151 E Kigezi 30 3 100 5,0 4,2 0,20 1,32 13,7 0,137 E Nyahirya 98 3 125 7,3 6,2 0,08 13,6 0,109 M Nkugute 59 3 139 12,8 3,1 0,05 0,96 11,5 0,083 M Chiberwa 12 0 142 9,2 3,6 0,16 0,3 11,6 0,081 M Nyanswiga 66 3 150 4,0 4,8 0,21 9,9 0,066 M Kyanga 57 2 164 16,9 3,4 0,08 1,63 9,8 0,060 M Kacuba* 15 0 210 9,0 2,0 0,07 11,5 0,055 M Murabyo 16 0 283 8,5 2,3 0,05 1,13 12,1 0,043 M Bugwagi 82 3 179 13,8 3,0 0,02 7,4 0,041 M Kyerbwato 14 0 240 9,0 2,0 0,09 0,41 9,29 0,039 M Katanda 149 2 342 21,4 1,5 0,02 0,45 5,24 0,015 O Kyaninga 220 1 488 36,0 1,2 0,03 0,17 6,00 0,012 O Mahuhura 269 2 593 36,0 0,8 0,23 0,234 6,2 0,011 O Rukwanzi 172 1 526 19,0 1,4 0,05 0,56 5,24 0,010 O Mwengenyi 138 3 370 13,9 1,4 0,20 0,79 3,61 0,010 O Karolero 34 0 380 12,0 1,6 0,23 1,78 3,3 0,009 O Kerere 77 0 406 12,0 1,4 0,02 0,88 3,47 0,009 O
Table 1. Productivity-related variables and mixed-layer (water column above the
thermocline) nutrient concentrations of 30 CLANIMAE study lakes in western Uganda, and their trophic status (aquatic productivity) classification based on the TLi index. The Anthropic Impact index (AI) ranges from crater basins being pristine (0) to fully under agriculture (3); Lake trophic status: H = hypertrophic, E = eutrophic, M = mesotrophic, O = oligotrophic.
Fig 4. New (CLANIMAE) and previously collected continuous temperature profiles
through the water column of 16 Uganda crater lakes, at various times of the year.
0 2 4 6 8 10 12 14 16 18 24 25 26 27 28 D e p th ( m ) Temperature (°C) Verschuren, 07/07/02 Rumes,21/02/07 Karolero 0 2 4 6 8 10 12 14 16 18 23 24 25 26 27 D e tp h ( m ) Temperature (°C) Verschuren, 08/01/02 hydrol Rumes,31/01/07 Plisnier, 9/08/07 Katinda 0 2 4 6 8 10 12 14 24 26 28 30 D e p th ( m ) Temperature (°C) Verschuren, 03/07/02 Rumes, 26/01/07 Plisnier,10/08/07 Melack, 1/6/71 Chibwera 0 5 10 15 20 25 30 22 23 24 25 D e p th (m ) Temperature (°C) Rumes,25/02/07 Plisnier, 11/08/07 Nyungu 0 10 20 30 40 50 60 70 24 25 26 27 28 D e p th ( m ) Temperature (°C) Verschuren, 08/07/02 Rumes,24/02/07 Plisnier, 12/08/07 Bugwagi 0 20 40 60 80 100 120 140 160 21,0 22,0 23,0 24,0 25,0 D e p th ( m ) Temperature (°C) Romero, 6/8/94 Rumes,20/01/07 Plisnier, 14/08/07 Mwengenyi 0 20 40 60 80 100 120 140 21 22 23 24 25 D e p th (m ) Temperature (°C) Chapman; 14/07/97 Rumes,20/01/07 Plisnier, 15/08/07 Melack, 18/5/71 Romero, 6/8/94 Katanda 0 5 10 15 20 25 30 35 40 45 50 21,5 23,5 25,5 D e p th ( m ) Temperature (°C) Chapman, 25/01/98 Verschuren, 15/07/02 Plisnier, 18/08/07 Verschuren,22/3/00 Romero, 7/8/94 Nyabikere
Appendix 1 (b) : Thermic profiles of a selection of crater lakes in Uganda
0 2 4 6 8 10 12 14 16 18 20 22 23 24 25 D e p th (m) Temperature (°C) Chapman; 07/03/98 Verschuren, 05/01/02 Verschuren, 14/07/02 Plisnier, 30/07/07 Verschuren, 23/3/00 Rumes, 15/01/07 Melack,14/5/71 Romero, 3/8/94 Lugembe 0 2 4 6 8 10 12 14 16 23 24 25 26 27 28 d e p th ( m ) Temperature (°C) Chapman; 26/11/97 Verschuren, 11/07/02 Rumes, 17/01/07 Plisnier, 31/07/07 Rumes, 31/07/07 Kasenda 0 2 4 6 8 10 12 14 23 24 25 26 27 D e p th ( m ) Temperature (°C) Chapman, 27/04/98 Verschuren, 10/07/02 Rumes, 23/01/07 Rumes, 01/08/07 Kyerbwato 0 5 10 15 20 25 30 35 40 45 50 21,5 22,5 23,5 24,5 D e p th (m ) Temperature (°C) Verschuren, 05/01/01 Verschuren, 16/07/02 Rumes, 10/02/07 Plisnier, 2/08/07 Kyaninga 0 10 20 30 40 50 60 23 24 25 26 27 D e p th ( m ) Temperature (°C) Verschuren, 02/01/01 Verschuren, 17/07/02 Rumes, 03/08/07 Kyanga 0 10 20 30 40 50 60 70 20 21 22 23 24 25 D e p th ( m ) Temperature (°C) Chapman; 18/10/97 Plisnier, 4/08/07 Nyanswiga 0 10 20 30 40 50 60 70 80 15 20 25 D e p th (m ) Temperature (°C) Chapm an, 08/09/97 Plisnier, 05/08/07 Rum es 05/08/07 Kizito,3-1992 Nyahirya 0 10 20 30 40 50 21 21,5 22 22,5 23 23,5 24 24,5 25 D e p th ( m ) Temperature (°C) Verschuren, 12/01/02 Rumes,1/02/07 Plisnier, 7/08/07 Melack, 2/6/71 Beadle,10/8/52 Beadle,19/8/63 Beadle,20/4/63 Beadle, 4/1/64 Beadle, 3/9/54 Romero, 13/8/1994 Nkugute
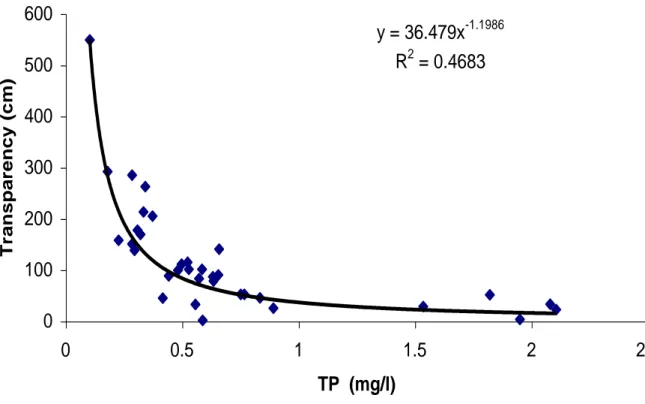
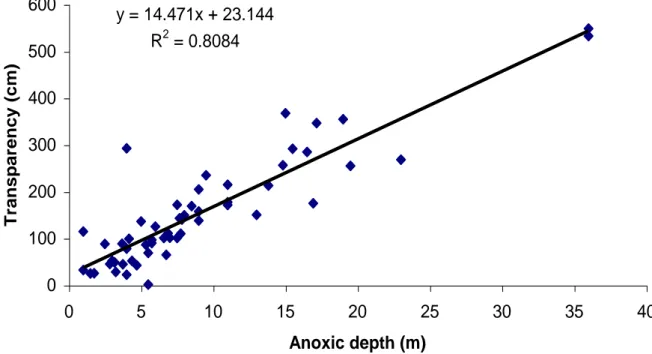
presented in Table 2. Analysis of the water-quality and environmental data revealed significant negative exponential relationships between transparency (measured as Secchi disk depth, SD) and total phosphorus concentration (Fig. 5), and between transparency and algal biomass (measured as the concentration of the ubiquitous algal pigment chlorophyll a, Chl a; Fig. 6). These relationships allow rough estimation of the aquatic productivity of Uganda crater lakes using simple measurements of Secchi disk depth. We also found a strong, linear and positive relationship between transparency and the depth of anoxic water (defined as the level where dissolved oxygen falls below 0.5 mg/l; Fig. 7). This is because in more productive (less transparent) lakes, decomposition of dead algae settling during the stratified season more rapidly depletes the deep-water oxygen supply, causing the oxycline to move up towards the thermocline. There was no significant correlation between transparency and dissolved inorganic nitrogen.
We selected 30 principal CLANIMAE study lakes to determine the influence of water-column depth and frequency of mixing on a lake‟s vulnerability to water quality loss when subjected to human exploitation of the surrounding landscape. These lakes cover a large gradient of relative depth and have drainage basins with contrasting levels of human impact, expressed by Anthropic Impact index values between 0 (pristine, no human impact), 1 (cultivated surface < 33%), 2 (33-66%) and 3 (>66%). Most of these lakes, including the „shallow‟ lakes mentioned above, develop pronounced temperature and oxygen stratification during part of the year; our study included only three truly shallow lakes (<5-6 meter) of which the water column is mixed on a daily basis. In these 30 lakes we combined water-column measurements of temperature, dissolved oxygen, dissolved ion content (measured as specific ion conductance, or conductivity), and pH with measurements of surface- and deep-water concentrations of algal biomass (Chl a) and the essential nutrients silicon, phosphorus and nitrogen. We classified lakes according to their aquatic productivity using the Trophic Lake index TLi = Chl a/SD. Among these 30 study lakes, 6 are oligotrophic (low productivity, TLi < 0.02), 10 are mesotrophic (moderate productivity, 0.02 < TLi < 0.12), 11 are eutrophic (high productivity, 0.12 < TLi < 0.6) and 3 are hypertrophic (very high productivity, TLi ≥ 0.6).
Marked differences between the nutrient content of surface and deep water in deep (> 30 m) lakes suggested a strong influence of mixing frequency on the contribution of recycled deep-water nutrients to lake productivity. In our
N obs 66 22 59 55 77 67 78 77 78 78 78 77 78 77 76 71 76 51 83 S D ( c m) Chl a (µg/l ) PEA Ano x D-Mo y S urf. A rea A 0 (ha) Ma x de pth Zm ( m) Me an Di am ( m) Ma x L (m) S ho rel ine L (k m) L theor Sho r de v ( L/L the or) c rate r area A ( Ha) ri m h ei gh t m ax ( m) ri m h ei gh t m in (m) A /A 0 Di am /Ri m h ei gh t Ma x L/ ri m m in (Dept h/(A/ A 0) A lt (m) 66 SD (cm) 1,00 22 Chla (µg/l) -0,54 1,00 59 PEA 0,43 -0,30 1,00 55 AnoxD-Moy 0,90 -0,44 0,36 1,00
77 Surf. Area A0 (ha) -0,24 0,13 -0,07 -0,12 1,00
67 Max depth Zm (m) 0,64 -0,42 0,71 0,61 -0,18 1,00
78 Mean Diam (m) -0,25 0,17 -0,04 -0,08 0,92 -0,15 1,00
77 Max L (m) -0,20 0,15 -0,06 -0,02 0,94 -0,14 0,95 1,00
78 ShorelineL (km) -0,23 0,17 -0,07 -0,06 0,95 -0,14 0,96 0,98 1,00
78 L theor -0,22 0,16 -0,04 -0,04 0,93 -0,13 1,00 0,95 0,97 1,00
78 Shor dev (L/Ltheor) -0,13 0,11 -0,12 -0,03 0,37 -0,12 0,35 0,50 0,53 0,35 1,00
77 crater area A (Ha) -0,30 0,23 -0,06 -0,12 0,91 -0,23 0,84 0,86 0,85 0,84 0,35 1,00
78 rim height max (m) 0,05 0,28 0,14 0,22 0,01 0,15 0,10 0,05 0,06 0,11 0,01 0,08 1,00
77 rim height min (m) 0,04 -0,27 0,39 0,18 -0,09 0,14 -0,06 -0,08 -0,09 -0,05 -0,10 0,04 0,64 1,00
76 A/A0 -0,18 0,03 0,00 -0,10 -0,14 -0,17 -0,27 -0,21 -0,22 -0,27 0,08 0,01 0,10 0,15 1,00
71 Diam/Rim height -0,16 -0,05 -0,08 -0,15 0,71 -0,15 0,53 0,65 0,59 0,54 0,24 0,54 -0,23 -0,14 -0,07 1,00
76 Max L/rim min -0,23 0,24 -0,18 -0,09 0,57 -0,26 0,58 0,60 0,63 0,58 0,36 0,41 -0,23 -0,52 -0,11 0,33 1,00
51 (Depth/(A/A0) 0,54 -0,42 0,62 0,59 -0,07 0,93 0,03 0,03 0,02 0,06 -0,02 -0,07 0,18 0,23 -0,30 -0,13 -0,07 1,00
83 Alt (m) 0,49 -0,39 0,21 0,32 -0,37 0,43 -0,43 -0,32 -0,35 -0,43 -0,03 -0,47 -0,12 -0,24 -0,16 -0,17 -0,07 0,23 1,00
Table 2. Pearson correlation coefficients for linear regressions between various
limnological and topographic characteristics of Uganda crater lakes, based on CLANIMAE and other available data. The number of observations are listed on top; topographic data derived from maps are available on 78 lakes in total; CLANIMAE surveyed 66 lakes in the field.
Fig. 5. Relationship between Secchi disk transparency (SD) and total phosphorus (TP)
concentration in 55 Uganda crater lakes.
y = 36.479x-1.1986 R2 = 0.4683 0 100 200 300 400 500 600 0 0.5 1 1.5 2 2.5 TP (mg/l) Transpa renc y (cm )
Fig. 6. Relationship between Secchi disk transparency (SD) and surface-water
Chlorophyll a concentration in 55 Uganda crater lakes.
Fig. 7. Relationship between Secchi disk transparency (SD) and the uppermost depth
occurrence of anoxic water in 55 Uganda crater lakes. y = 14.471x + 23.144 R2 = 0.8084 0 100 200 300 400 500 600 0 5 10 15 20 25 30 35 40 Anoxic depth (m) Transpa renc y (cm )
wet- and dry-season surveys the nitrogen to phosphorus molar ratio in surface waters usually exceeded the Redfield ratio of 16, indicating that lake productivity is more often limited by phosphorus than by nitrogen. Yet, several lakes (e.g., Katanda, Mahuhura, Mwengenyi) may be nitrogen-limited during the dry-season period of water-column mixing. Uganda crater lakes not or little impacted by human activity tend to be unproductive (oligotrophic) when >90 m deep, and moderately productive (mesotrophic) when < 90 m deep (Fig. 8). Lakes with significant human impact can be oligotrophic (when > 90 m), mesotrophic (in the depth range 35-90 m) or eutrophic/hypertrophic (< 35 m). Thus, significant land use within a crater basin is likely to raise the productivity of shallow and moderately deep lakes, whereas the water quality of very deep lakes remains relatively unaffected.
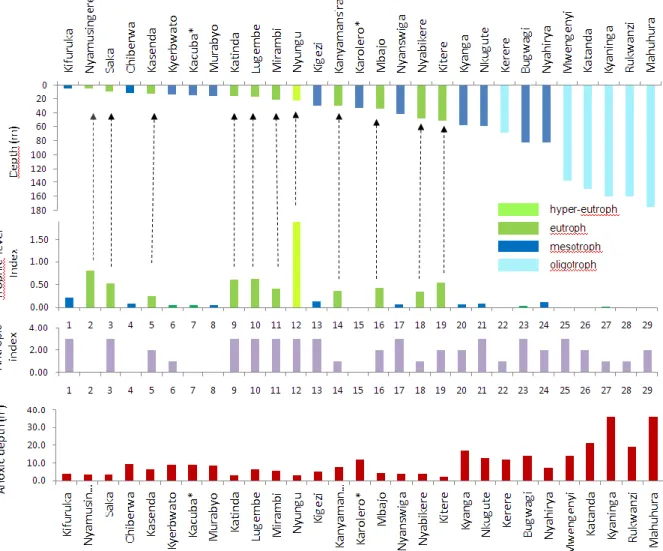
Fig. 8. Selection of 29 CLANIMAE study lakes arranged in order of increasing lake
depth (top), colour-coded according to their aquatic productivity. In lakes shallower than ~35 m, human impact has increased productivity; deep lakes (> 90 m) remain relatively unaffected. Note that shallow lakes are naturally mesotrophic (e.g., the pristine forest lake Karolero and the pristine savanna lake Chibwera).
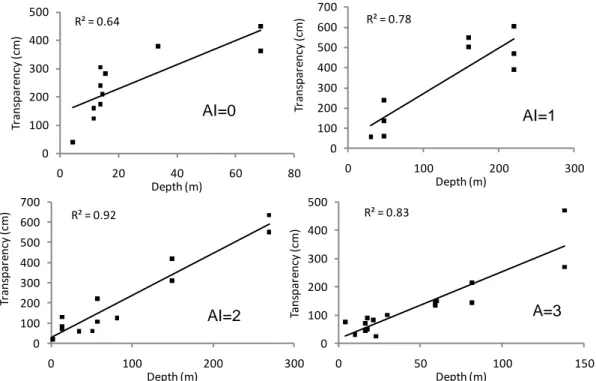
Very probably the large volume of their rarely mixed lower water column represents more or less permanent nutrient storage space, because the low frequency of deep mixing hampers nutrient recycling to the surface water where primary production takes place. As a result, a significant positive relationship exists between lake depth and transparency (as measure for algal biomass: Fig. 6) for each of the four lake disturbance categories (AI index 0 to 3; Fig. 9). The Trophic Lake index (TLi) is also generally inversely related to lake depth. This implies that when the depth of a lake is significantly reduced, either because of climatic drying (a long period of low rainfall) or through excessive water abstraction, aquatic productivity and lake trophic status are likely to increase, and water transparency is likely to decrease.
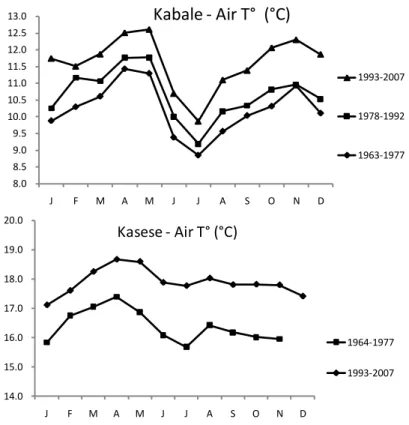
Meteorological information has been compiled from various sources obtained from the Meteorological Department in Kampala. The annual average cycle in air temperature at Kabale (1.25°N, 29.9 °E) and Kasese (0.18 N, 30.1 E; Fig. 10) indicate the seasonal difference with a warmer rain season from March to April and a cooler dry season in October-November. The high radiation budget during the rain season leads to stronger temperature stratification and reduced internal nutrient recycling, leading to lower algal productivity and higher transparency.
R² = 0.78 0 100 200 300 400 500 600 700 0 100 200 300 Tr an sp ar en cy (cm ) Depth (m) R² = 0.64 0 100 200 300 400 500 0 20 40 60 80 Tr ans pa re ncy (cm ) Depth (m) R² = 0.92 0 100 200 300 400 500 600 700 0 100 200 300 Tr ans pa re ncy (cm ) Depth (m) AI=2 R² = 0.83 0 100 200 300 400 500 0 50 100 150 Ta ns pa re ncy (cm ) Depth (m) AI=0 AI=1 A=3
Fig. 9. Relationship between the depth and transparency of Uganda crater lakes for
14.0 15.0 16.0 17.0 18.0 19.0 20.0 J F M A M J J A S O N D 1964-1977 1993-2007 Kasese - Air T° (°C) 8.0 8.5 9.0 9.5 10.0 10.5 11.0 11.5 12.0 12.5 13.0 J F M A M J J A S O N D 1993-2007 1978-1992 1963-1977 Kabale - Air T° (°C)
Fig. 10. Annual cycle of mean monthly air temperature at Kabale and Kasese
meteorological stations during the periods 1963-1977, 1978-1992 and 1993-2007 (Kasese data 1978-1992 are incomplete).
0 20 40 60 80 100 120 140 160 180 0.00 0.20 0.40 0.60 0.80 DRY 07 WET 09 TP Kyaninga 0 20 40 60 80 100 120 140 160 180 0.00 0.50 1.00 1.50 2.00 DRY 07 WET 09 TN Kyaninga 0 20 40 60 80 100 120 140 160 180 0.00 1.00 2.00 3.00 DRY 07 WET 09 NH4 Kyaninga 0 20 40 60 80 100 120 140 160 180 0.00 0.02 0.04 0.06 DRY 07 WET 09 NO3 Kyaninga 0 20 40 60 80 100 120 140 160 180 0.000 0.010 0.020 0.030 DRY 07 WET 09 NO2 Kyaninga 0 20 40 60 80 100 120 140 160 180 0.00 5.00 10.00 DRY 07 WET 09 Chl a Kyaninga
Fig. 11. Vertical profiles of total phosphorus (mg/l P), total nitrogen (mg/l N),
Chlorophyll a (µg/l), ammonia (mg/l N), nitrates (mg/l N) and nitrites (mg/l N) during the dry (July) and wet (April) season at Lake Kyaninga.
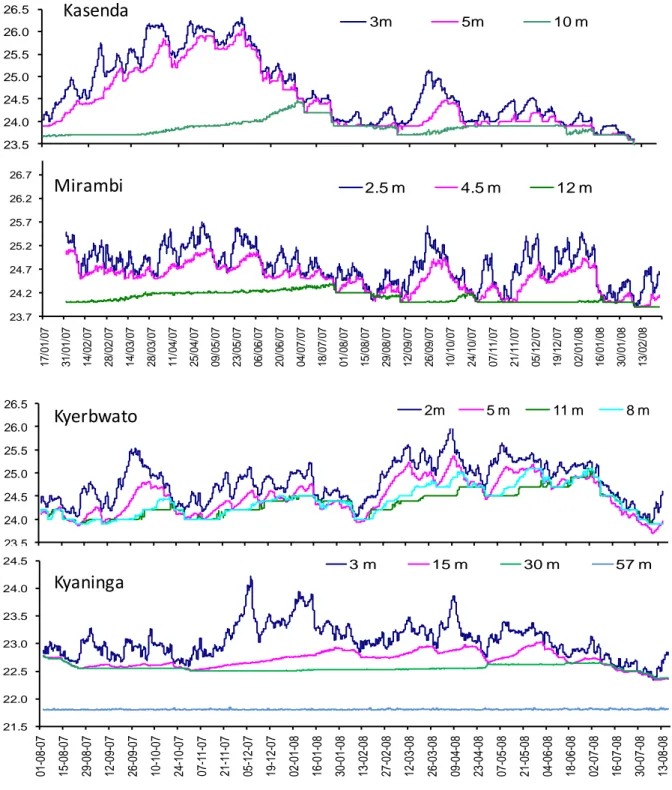
This process overwhelms the effect of rainfall on the input of new nutrients. Water-column mixing during the dry season affects surface-water chemistry (e.g., Lake Kyaninga: Fig. 11) by increasing concentrations of phosphorus and nitrogen compounds, except the concentration of ammonia which is oxidized to nitrate. 23.5 24.0 24.5 25.0 25.5 26.0 26.5 1 7 /0 1 /0 7 1 7 /0 2 /0 7 1 7 /0 3 /0 7 1 7 /0 4 /0 7 1 7 /0 5 /0 7 1 7 /0 6 /0 7 1 7 /0 7 /0 7 1 7 /0 8 /0 7 1 7 /0 9 /0 7 1 7 /1 0 /0 7 1 7 /1 1 /0 7 1 7 /1 2 /0 7 1 7 /0 1 /0 8 1 7 /0 2 /0 8 3m 5m 10 m 23.7 24.2 24.7 25.2 25.7 26.2 26.7 1 7 /0 1 /0 7 3 1 /0 1 /0 7 1 4 /0 2 /0 7 2 8 /0 2 /0 7 1 4 /0 3 /0 7 2 8 /0 3 /0 7 1 1 /0 4 /0 7 2 5 /0 4 /0 7 0 9 /0 5 /0 7 2 3 /0 5 /0 7 0 6 /0 6 /0 7 2 0 /0 6 /0 7 0 4 /0 7 /0 7 1 8 /0 7 /0 7 0 1 /0 8 /0 7 1 5 /0 8 /0 7 2 9 /0 8 /0 7 1 2 /0 9 /0 7 2 6 /0 9 /0 7 1 0 /1 0 /0 7 2 4 /1 0 /0 7 0 7 /1 1 /0 7 2 1 /1 1 /0 7 0 5 /1 2 /0 7 1 9 /1 2 /0 7 0 2 /0 1 /0 8 1 6 /0 1 /0 8 3 0 /0 1 /0 8 1 3 /0 2 /0 8 2.5 m 4.5 m 12 m Kasenda Mirambi 23.5 24.0 24.5 25.0 25.5 26.0 26.5 01 -08 -07 15 -08 -07 29 -08 -07 12 -09 -07 26 -09 -07 10 -10 -07 24 -10 -07 07 -11 -07 21 -11 -07 05 -12 -07 19 -12 -07 02 -01 -08 16 -01 -08 30 -01 -08 13 -02 -08 27 -02 -08 12 -03 -08 26 -03 -08 09 -04 -08 23 -04 -08 07 -05 -08 21 -05 -08 04 -06 -08 18 -06 -08 02 -07 -08 16 -07 -08 30 -07 -08 13 -08 -08 2m 5 m 11 m 8 m Kyerbwato 21.5 22.0 22.5 23.0 23.5 24.0 24.5 01 -08 -07 15 -08 -07 29 -08 -07 12 -09 -07 26 -09 -07 10 -10 -07 24 -10 -07 07 -11 -07 21 -11 -07 05 -12 -07 19 -12 -07 02 -01 -08 16 -01 -08 30 -01 -08 13 -02 -08 27 -02 -08 12 -03 -08 26 -03 -08 09 -04 -08 23 -04 -08 07 -05 -08 21 -05 -08 04 -06 -08 18 -06 -08 02 -07 -08 16 -07 -08 30 -07 -08 13 -08 -08 3 m 15 m 30 m 57 m Kyaninga
Fig. 12. Continuous temperature measurements at 3 or 4 depth levels in the water
column of four Uganda crater lakes: January 2007 to February 2008 at Kasenda and Mirambi, and from August 2007 to August 2008 at Kyerbwato and Kyaninga.
Continuous (2h-interval) temperature measurements using thermistors suspended at discrete depths in the water column (Fig. 12) illustrate the inverse relationship between depth and frequency of mixing, with conditions for deep wind-induced mixing improving when surface-water temperature is at a minimum. Shallow lakes such as pristine Kyerbwato (14 m) and impacted Kasenda (14 m) and Mirambi (21 m) are monomictic (mixing completely at least once per year) to polymictic (mixing completely several times each year) independent of their productivity. Lake Kyaninga (>220 m) mixes at least once per year down to 30 m depth, but not down to 57 m (Fig. 12).
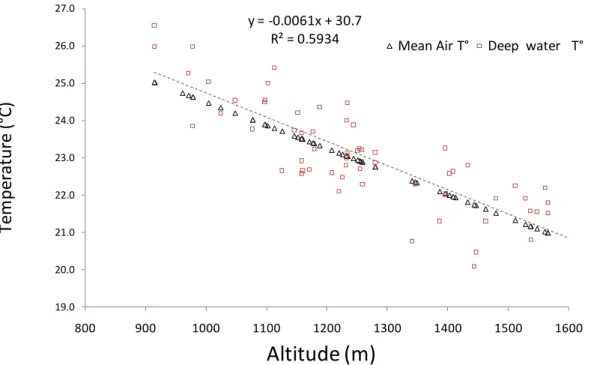
Water temperature versus air temperature, and a possible global-warming signature in Uganda crater lakes. The relationship between lake temperature, local annual mean air temperature and lake altitude (Fig. 13) is important to relate meteorological information available from only a few dispersed meteorological stations with observations of lakes situated at altitudes ranging between 900 and 1600 m above sea level (a.s.l). Lake surface temperature at any one time reflects weather-related variability in day-time solar insolation and night-time or wind-driven cooling. The bottom temperature of deep stratified lakes approximates the lowest annual surface-water temperature, and is therefore a guide to long-term trends. The bottom temperature of 55 Ugandan crater lakes surveyed in this study ranges between 20.0 and 26.6 °C, which is greater than the regional, altitude-related variation in mean annual air temperature (21-25 °C). The higher variability in bottom temperature mainly reflects variation in lake depth (shallower lakes have higher bottom temperatures) and differences in exposure to solar radiation and wind.
Preliminary evaluation of all available historical and recent temperature profiles indicates an apparent deep-water warming trend in the Uganda crater lakes, such as Lake Katanda (Fig. 14), superimposed on inter-annual variability reflecting notable warmer (e.g., 2002) and colder (e.g., 2007-2008) years. The temperature increase is around 0.2 to 0.7 °C in the last decades, comparable to that observed in Lake Victoria (Hecky et al., 1994), Lake Tanganyika (Plisnier, 2000) and Lake Malawi (Vollmer et al., 2005). This warming trend in the western Uganda crater lakes mirrors the regional increase in air temperature observed between 1963 and 2007 (Fig. 10).
Finally, information on recent or historical fish kills collected during this project or from the published literature reveals a broad inverse relationship between the frequency of fish kills and lake depth (Table 3). Since fish kills occur when a large volume of anoxic water suddenly mixes with surface water, fish kills
y = -0.0061x + 30.7 R² = 0.5934 19.0 20.0 21.0 22.0 23.0 24.0 25.0 26.0 27.0 800 900 1000 1100 1200 1300 1400 1500 1600
Mean Air T° Deep water T°
Te m p er atu re (° C)
Altitude (m)
Fig. 13. FAO mean annual air temperature data from 63 meteorological stations,
between 1.4° S and 1.0° N and 29.5° to 31° E, corrected with recent data from the Meteorological Department of Uganda, compared with near-bottom water temperature in 55 Ugandan crater lakes. Lake data from the last 30 years: Kizito et al. (1993); Chapman et al., (1998); Verschuren & Rumes (unpublished data); this study.
0 20 40 60 80 100 120 140 21.5 23.5 25.5 D e p th (m ) Temperature (°C) Melack, 18/5/71 Romero, 6/8/94 Chapman; 14/07/97 Rumes,20/01/07 Plisnier, 15/08/07 Plisnier, 19/4/09 Katanda
Trend
Interannual & interseasonnal changesFig. 14. Variability in surface and deep-water temperature at Lake Katanda between
Lakes Depth (m)
Prob. mix. type
Observations Source
Katinda 17 dimictic Fish kill every July and December (3 days) Pers. com.
Mirambi 21 dimictic Fish kill every June and November (3 days) Pers. com.
Nyungu 25 dimictic Fish kill every July and December (3 days) Pers. com.
Mbajo. 35 dimictic? Some dead fish in February 2008 Gelorini & Lebrun, pers.com.
Njarayabana 38 dimictic? Fish breathing near the surface in Feb 2008 Gelorini & Lebrun, pers.com.
Bunyoni 45 oligomictic Serious fish kill in 1964 Beadle, 1981
Nyabikere 48 oligomictic Fish kill +/- 2 years ago (2005?); not every year Pers. com.
Nkugute 58 oligomictic Fish Kill 8-7-1956 and some years before Beadle, 1966
Nyanswiga 61 oligomictic Fish kill observed (in March or June) Kizito, 1993
Bugwagi 85 oligomictic Last fish kill in 1989 (before: every 10 y+/-) Pers. com.
Kyaninga 58/135 oligomictic Fish kills every 5 years - Fish kill in 2006 Beadle, 1966 & pers. Com. Mwengenyi 140 oligomictic Fish kill in 1998 (2 weeks in July) & every lakes in the region Pers. com.
Katanda 152 oligomictic Fish kill in 1998 (2 weeks in July) & every lakes in the region Pers. com.
Mahuhura 154 oligomictic Fish kill observed but date not remembered Pers. com.
Table 3. Frequency of fish kills in 14 Uganda crater lakes (in sequence of increasing
depth) in relation to their probable seasonal mixing regime.
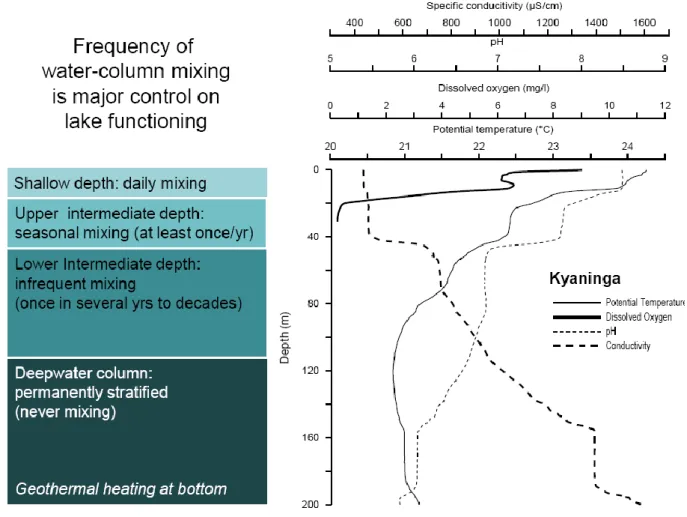
Fig. 15. Relationship between depth and frequency of mixing, with Lake Kyaninga as
example. The approximate transition depths can be derived from changes in the physical parameters temperature, dissolved oxygen, pH and specific conductance.
are associated mostly with deep lakes, and the frequency of fish kills is an indicator of the frequency of deep water-column mixing. The upwelling of ammonia in surface water must also play a role in fish kill events, particularly when pH increases during algal blooms, because these conditions promote higher surface-water concentration of toxic ammonia.
Bottom anoxia also occurs in relatively shallow Ugandan crater lakes: it was observed in all lakes sufficiently deep to develop seasonal temperature stratification (i.e., their temperature profile contains a marked thermocline; Fig. 3), with the exception of the pristine Lake Kyerbwato in Kibale National Park, where 0.8 mg/l of oxygen was measured near the bottom at 12 m depth. Overall our physical data indicate that the water column of most fresh Ugandan crater lakes mixes completely at least occasionally, but only the more shallow lakes (<30 m) tend to mix completely at least once per year. Meteorological conditions allowing the complete mixing of deep lakes (cold air temperature coinciding with windy conditions) are relatively rare, on the order of once in several decades for some of the deepest lakes. Lake Kyaninga (>220 m deep) is one of a handful Uganda crater lakes with a deep-water zone that never mixes; this permanently stratified deep-water zone is characterized by slightly elevated dissolved ion concentrations (measured as specific conductance; Fig. 15). We use the terms oligomictic and meromictic as defined by Hutchinson (1957): oligomictic are lakes mixing completely at frequencies of less than once a year, and meromictic are lakes with a part of the lower water column that is permanently stratified. The term dimictic could be used to refer to lakes which mix completely during each of the two dry, colder and windy seasons. However, true dimictic lakes are restricted to high-latitude regions where cold surface stratification (<4°C) can develop during winter. The Uganda lakes mixing twice each year remain in a warm temperature range, therefore could be defined as „warm dimictic‟. Diatom-based inference model for aquatic productivity in East African lakes. CLANIMAE aimed to develop the first diatom-based inference model for past changes in the aquatic productivity of African lakes, as already exist for lakes in Europe (Bennion et al. 1996) and North America (Hall & Smol 1999). We calibrated diatom species distribution along a wide productivity gradient involving 48 Uganda crater lakes, through analysis of fossil diatom assemblages in recently deposited surface sediments. This produced a reference dataset on the modern distribution of African diatom species in
relation to nutrients (total phosphorous, total nitrogen, dissolved silica; Fig. 16) and other measures of aquatic productivity (Secchi disk depth, Chl a; Fig. 17). Analyses of algal pigments by the HPLC technique (courtesy of the UGent research group Protistology & Aquatic Ecology) on water-filtration residues produced data on total phytoplankton community composition. This allowed to analyse associations between diatom species recorded in surface sediments and important communities of African phytoplankton (which are often dominated by other groups of algae or cyanobacteria). For 27 lakes these data were calibrated with semi-quantitative data on phytoplankton species composition based on microscopic cell counting of preserved dry-season samples. For example, the characteristic phytoplankton community of Lake Kyogo with several common desmid species (e.g., Staurastrum,
Closterium, Cosmarium) can be detected only by direct microscopic analysis,
because their pigments are identical to those of other green algae. Table 4 shows species abundance data in 11 of these lakes, in five abundance classes from sporadic (X) to abundant (XXXXX). Finally, wet-season (April 2009) phytoplankton collections allowed assessment of seasonal dynamics in the lakes‟ diatom communities.
In all studied lakes, the phytoplankton was dominated by Cyanobacteria (blue-green algae) and Chlorophyta (green algae). Oligotrophic lakes were characterized by Aphanocapsa and Aphanizomenon (Cyanobacteria),
Chlorobium (Chlorophyta) and Urosolenia and Cyclotella (diatoms).
Mesotrophic lakes were characterized by Lemmermaniella (Cyanobacteria) and Kirchneriella (Chlorophyta). Eutrophic lakes were characterized by
Cyanobium, Oscillatoria and Synechococcus (Cyanobacteria), Chlorella, Pseudoquadrigula, Crucigenia and Pediastrum (Chlorophyta), Lepocyclis
(Euglenophyta) and Ulnaria and Aulacoseira (diatoms). Principal Components Analysis (PCA) of the distribution of 49 genera of phytoplankton in 25 crater lakes showed oligotrophic lakes separated from eutrophic lakes along PCA axis 1 (Fig. 18), confirming the dominant influence of lake productivity on phytoplankton community composition in the Uganda lakes. Our preliminary diatom-based inference model for aquatic productivity uses the relationship between diatom species composition in surface sediments and the surface-water concentration of total phosphorus (TP, i.e. phosphorus in particulate and dissolved form) in our 48-lake reference data set (Fig. 16).
Fig. 16. Species composition of diatom algal communities in 36 Uganda crater lakes, analyzed in
recently deposited surface sediments, which integrate seasonal variability. Lakes are arranged from top to bottom in order of increasing total phosphorus concentration (TP), a measure of lake productivity.
Fig. 17. Species composition of diatom algal communities in 37 Uganda crater lakes, as analyzed in
recently deposited surface sediments, which integrate seasonal variability. Lakes are arranged from top to bottom in order of decreasing Secchi disk transparency (SD), a measure of lake productivity.
L ak es Kat and a Mw eng enyi Bu g w agi L u g emb e Kat ind a Kyanin g a Nkug u te Kar o le ro S ak a -Cra te r Ma h u h u ra Kyog o Cyanobacteria Anabaena cf. verrucosa Anabaena sp. xx xx x xxx Aphanizomenon flos-aquae xx Aphanocapsa x xx x x xxx x x Aphanothece x xx xx x x x x cf. Cylindrospermum xx Chroococcales xx xx xxxx xx xx Chroococcus spp. xx xx xx xx xx xx Coelosphaer. cf kuetzingianum x Coelosphaerium cf. lacustris xxx x xxxx xx Cylindrospermopsis sp. xxxx xx xx xxxxx xx xx xxx xx Gomphosphaeria sp. xx Gomphosphaeria cf. aponina Merismopedia minima xx xx xxxx xx xxxx xxx Merismopedia tenuissima xx xx Microcystis aeruginosus x Microcystis sp. x x Oscillatoria agardhii x xxxxx Oscillatoria sp. xx Planktolyngbya cf. limnetica x xx xxx Planktolyngbya contorta xxx xx xxxx xx xx xxxxx xxx Planktolyngbya limnetica xxxx xxxx xxx xxxx xxx xxx xx xxx x xxxx xxx Spirulina sp. xx Synechococcus sp. xxx xx x Synechocystis sp. x Chlorophyta Chlorococcales (coccoid spp.) xx xx Actinastrum sp. x Ankistrodesmus falcatus x xx Ankyra sp. x Botryococcus braunii x x Chlorella sp. xx xx xx xx xx xx xx xx xx xx Chodatella sp. x cf. Astroideum sp. x Crucigenia sp. xx xx x Crucigeniella crucifera Dictyosphaer. ehrenbergianum x x Dictyosphaerium pulchellum x xx Dictyosphaerium sp. x Didymocystis bicellularis xx xx xx xx cf. Didymocystis bicellularis xx xx cf. Eremosphaeria x x Kirchneriella cf. irregularis x xx xx Kirchneriella obesa x xx Lagerheimia sp. x Monoraphidium cf. arcuatum x Monoraphidium circinale xx xx Monoraphidium contortum x xx xx Monoraphidium dybowskii x Monorap. flexuosum/irregulare xxx xxx xxx xx xxxxx xx xx xxx xx Monoraphidium komarkovae xx x x xx x x xx Monoraphidium skujae x xx Monoraphidium minutum x x x x Oocystis sp.
Pediastrum duplex x
Ped. duplex var. gracillimum x
Pediastrum tetra
Quadrigula lacustris x
Scenedesmus acuminatus x xx
Sc. acuminatus var. elongatus x
Scenedesmus ecornis xx x
Scenedesmus cf. ginzbergeri x
Scenedesmus cf. obliquus x xx x
Sc. opoliensis var. bicaudatus x
Scenedesmus cf. platydiscus xx Scenedesmus quadricauda x Scenedesmus sp. xxx xx Schroederia setigera x Tetraedron triangulare x x x x x Tetraedron minimum x x xx x xx xx x x x x Closterium sp. x x Cosmarium spp. x x xx x xx Staurastrum spp. x x x Dinophyta Gymnodinium sp. x x x x x x Peridinium cf. africanum x x x x xx Peridinium sp. x x x x Euglenophyta Euglena sp. x x Lepocinclis sp. x Bacillariophyta Achnanthidium minutissimum xx Amphora copulata x Aulacoseira granulata x Navicula sp. x x x Nitzschia cf. gracilis x Nitzschia spp. x x x
Chrysophyta & Cryptophta
cf. Mallomonas x x Chromulina sp. x Chroomonas sp. xx Ochromonas sp. x Dinobryon sp. xx unidentified sp. 1 xx unidentified sp. 2 xx unidentified sp. 3 x unidentified sp. 4 x unidentified sp. 5 unidentified sp. 6 x xx unidentified sp. 7 x
Table 4. Species composition of pelagic phytoplankton communities in a selection of
11 Uganda crater lakes, as sampled in February 2008 (Kyogo) or July/August 2008 (all other lakes). Relative abundance classes from sporadic (x) over rather common (xx), common (xxx), and very common (xxxx) to abundant (xxxxx). CLANIMAE produced such phytoplankton composition data for 27 Uganda crater lakes.
SSD - Science for a Sustainable Development - Biodiversity 35
Fig. 18. PCA axes 1 and 2 of the ordination of 49 genera (groups) of phytoplankton in
25 Uganda crater lakes. Lakes numbered 1-7 are oligotrophic, 8-14 are mesotrophic and 15-25 are eutrophic. The phytoplankton data are log-transformed percent abundances of cell volumes.
Fig. 19. Estimates (left) and residuals (right) of a diatom-based, WA-PLS type total
phosphorus (TP) inference model versus the corresponding observed values (x-axes).
1,0 2,0 3,0 M o d e l 0 1 ! E st im a te s ! W A P L S _ C 2 -0,60 -0,45 -0,30 -0,15 0,00 0,15 0,30 0,45 M o d e l 0 1 ! R e si d u a ls ! W A P L S _ C 2 0,0 0,2 0,4 0,6 0,8 1,0 1,2 1,4 1,6 1,8 2,0 0,0 0,2 0,4 0,6 0,8 1,0 1,2 1,4 1,6 1,8 2,0
Model 01 ! Estimates ! Obs_TP (µM)
M o d e l 0 1 ! E st im a te s ! W A P L S _ C 2 _ X 0,0 0,2 0,4 0,6 0,8 1,0 1,2 1,4 1,6 1,8 2,0 -2,0 -1,0 0,0 1,0
Model 01 ! Residuals ! Obs_TP (µM)
M o d e l 0 1 ! R e si d u a ls ! W A P L S _ C 2 _ X
-1.0
1.5
-0
.8
0
.8
1 2 3 4 5 6 7 8 9 10 11 12 13 14 15 16 17 18 19 20 21 22 23 24 25Data quality screening reduced the data set for model development to 44 lakes and the 56 most common diatom taxa, TP values (in µg/liter) were log-transformed, and the analysis was done in C2 (Juggins et al.). The result (Fig. 19) is unimpressive: with jack-knifing the best-performing transfer function (WA-PLS) has a R2 value of only 0.204 between inferred and observed TP values,
and a root-mean-square error of prediction of 0.355 log TP units. Presumably, model performance is compromised by the apparent scarcity of diatoms in the living phytoplankton of most Ugandan crater lakes, as much of the aquatic productivity is contributed by other groups of algae.
Environmental regulation of aquatic macrophyte communities. Also in work package 1, CLANIMAE studied environmental controls on the distribution of aquatic macrophyte species in Ugandan crater lakes, similarly to explore their value as environmental indicators. This involved a total of 216 survey plots in 36 lakes, where a total of 140 terrestrial, semi-aquatic and aquatic plant species were identified along transects between the lakeshore and the depth limit of aquatic plant development. Local species abundance was scored visually on the DAFOR scale (Kent & Coker, 1995). Submerged macrophytes in deeper water were sampled using a 4-m long rake. At each plot, water depth, bottom slope, sediment type (soft or compact) and distance from shore were recorded. Turbidity was measured with a Hach turbidimeter, and physical variables (pH, conductivity, temperature and dissolved oxygen) were measured with a Hydrolab Quanta multi-probe. Prior to analysis, floristic data were transformed to ordinal coefficients using the van der Maarel scale (Jongman et al., 1995).
The habitat requirements of individual plant species were reflected in distinct ranges of distribution along gradients of 13 relevant physical and chemical habitat characteristics (Figs. 20-21). Clustering analysis revealed eight major ecological communities (groups), each with particular indicator species (Fig. 22). Group I is dominated by Phragmites mauritianus and lianas growing in association with it. Group II is characterized by the co-dominance of the emergent aquatic plants Cladium mariscus subsp. jamaicense, Cyperus
alternifolius and Cyperus dives. Group III is heterogeneous and contains many
plots which were difficult to associate to a particular group. It is characterized by lake-edge species (Phoenix reclinata, Hibiscus diversifolius) and re-colonization stage species (Penisetum purpureum, Hyparrhenia sp.).
Fig. 20. Box plots (mean, standard deviation SD, minimum and maximum values) of
the distribution range of 16 aquatic macrophyte species in 36 Uganda crater lakes, in relation to the habitat variables (from top to bottom) water depth, distance to shore, water temperature, pH and turbidity.
Box plots T. australis P. geminatum L. hexandra C. papyrus C. dives C. interuptus C. mariscus P. mauritianus N. nouchali N. horrida P. schweinfurthii P. pectinatus C. zeylanica C. setosa C. demersum C. reniformis 0 5 10 15 20 25 30 35 40 45 50 D is ta nc e f rom t he s ho re ( m ) Box plots T. australis P. geminatum L. hexandra C. papyrus C. dives C. interuptus C. mariscus P. mauritianus N. nouchali N. horrida P. schweinfurthii P. pectinatus C. zeylanica C. setosa C. demersum C. reniformis 0 50 100 150 200 250 300 T u rb id it y ( N T U ) Box plots T. australis P. geminatum L. hexandra C. papyrus C. dives C. interuptus C. mariscus P. mauritianus N. nouchali N. horrida P. schweinfurthii P. pectinatus C. zeylanica C. setosa C. demersum C. reniformis 5 7 9 11 pH Box plots T. australis P. geminatum L. hexandra C. papyrus C. dives C. interuptus C. mariscus P. mauritianus N. nouchali N. horrida P. schweinfurthii P. pectinatus C. zeylanica C. setosa C. demersum C. reniformis 20 25 30 35 T e m p e ra tu re ( °) T. australis P. geminatum L. hexandra C. papyrus C. dives C. interuptus C. mariscus P. mauritianus N. nouchali N. horrida P. schweinfurthii P. pectinatus C. zeylanica C. setosa C. demersum C. reniformis 0 1 2 3 4 5 6 D ep th ( m ) D e p th ( m) D is ta n c e f ro m s h o re ( m) Temp e ra tu re ( °C) Tur b idit y ( N TU ) pH