Abstract—This paper introduces a simple method to monitor power system voltage stability conditions in real-time. The method is based on the concept of Voltage Instability Predictor (VIP). The essence of the method is a simple computation of a voltage stability boundary based on VIP derived quantities. The stability boundary is assumed as a parabolic equation in the P-Q plane identified using measurements collected at a specific substation, transmission path, or load center. The computed stability boundary is further visualized in a P-Q plane, together with a point representing the current operating conditions, and generally re-computed as soon as the new set of measurements is collected (preferably at high rates using phasor measurement units). Simplicity and easy interpretation of the results brings this method as a useful tool to increase system operator situational awareness. Supporting results are provided using relatively big test system (52 bus Nordic test system) and a real-life system (a portion of the North-West USA system).
Index Terms—Voltage stability monitoring and detection, Power margins, Phasor measurements, Visualization
I.INTRODUCTION
HE objective of power system voltage stability monitoring and instability detection is to assess stability conditions based on the information about current system operating state and to detect the onset of instability [1]. Advanced voltage stability monitoring and instability detection schemes include two basic elements: collection of measurement data and pre-processing and computation of the proximity to voltage instability (voltage stability limit). Measurement systems (SCADA, phasor measurement units (PMUs), or a mix of these measurements) provide the information about the system’s current operating conditions. In this respect, development of the PMU technology in late 80’s opened new perspectives in dealing with problems of voltage stability monitoring and instability detection [1,2,3].
Computation of the proximity to voltage stability limit maps current system state into a single value known as voltage stability index. Voltage stability indices are defined as a smooth, computationally inexpensive scalar with predictable shape that can be monitored as system operating conditions and parameters change [4,5,6]. So far, a variety of voltage
M. Glavic, M. Lelic, and D. Novosel are with Quanta Technology, LLC, 4020 Westchase Blvd, Suite 300, Raleigh, NC 27607, USA; E. Heredia and D. Kosterev are with Bonneville Power Administration, PO Box 491, Vancouver, WA 98666 (e-mails: [email protected], [email protected],[email protected], [email protected], [email protected] ).
stability indices have been proposed [6]. Majority of these indices were derived based on the concept of maximum deliverable power [4,5,6].
The voltage stability limit is closely related to the notion of maximum deliverable power [4,5]. For each system configuration and operating conditions there is a maximum power that can be drawn by the system loads and still being within the capability of the combined generation-transmission system. Once the combined generation-transmission system is unable to provide the power requested by the loads, due to system outages and/or limitations of reactive power generation, voltage instability occurs. This instability can further evolve in voltage collapse causing system disruption [1,4,5].
Among all voltage stability indices those expressing the stability degree in terms of powers (MVA, MW, Mvar) have gained the most popularity for their physical meaning and simple interpretation by system operators. Power margins, related to the voltage instability problem, proposed so far are loading margins [6]. Computation of these margins is based on the assumption that the load power factor will be the same as the one currently measured [4,5].
Simplicity and easy interpretation of the results are two desirable features always sought in designing advanced real-time voltage stability monitoring and instability detection schemes. The use of simple representation of the system by two-bus equivalent and derivation of power margins from the equivalent appears to be such a scheme [1,7]. Some of previous works consider construction of a P-Q curve based on local measurements and simple calculation of active and reactive power margins [8,9], for this purpose. The method [8] is based on the assumption that this P-Q curve is a circle and it computes loading margins. This assumption is not very accurate and it could lead to over-estimation of the reactive power margin. Reference [9] also proposes computation of power margins in P-Q plane, where margins are computed without explicit assumption about analytic form of P-Q curve and without details how the curve is updated as system conditions and parameters change. The P-Q curve is constructed point-by-point, based on a simple instability condition and permits more flexible computation of power margins).
Recognizing the advantages of simple power margin computations and visualization in P-Q plane, this paper proposes such a method with several additional features allowing their refreshment at high rates and its use in different situations (local substations, critical transmission paths, and load centers). The proposed method is based on the VIP concept [7]. Stability margin is expressed in terms of powers
T
Mevludin Glavic, Senior Member, IEEE, Muhidin Lelic, Senior Member, IEEE, Damir Novosel, Fellow, IEEE, Eric Heredia, Member IEEE, Dmitry Kosterev, Member,IEEE
A Simple Computation and Visualization of
Voltage Stability Power Margins in Real-Time
(MVA, MW, Mvar) and it is easily visualized in P-Q plane of local substation, critical transmission path or load center. The visualization is achieved through a simple identification of a voltage stability boundary curve with a realistic assumption of the explicit parabolic relationship between active and reactive powers. This curve can be refreshed (re-computed) at high rates, i.e. at the same rate current operating state is refreshed, or different rates could be used to this purpose. In principle, only one set of measurements is sufficient to compute the curve, but more than one set of measurements is useful to be processed in least-square sense, adding additional flexibility to the scheme. Although PMU measurements are preferred, the proposed method, in principle, permits the use of SCADA measurements as well as a mix of these two types of measurements. The capabilities of the proposed method are demonstrated using a relatively big test system as well as a portion of an actual system.
The paper is organized as follows. The concept of VIP is shortly reviewed in Section II. Algorithmic details of the proposed method are given in Section III. Section IV presents some results obtained using a test system and a portion of a real-life system while Section V offers some conclusions.
II.VIP REVIEW
VIP method was originally proposed in late 90's [7] and later extended for different situations [10,11]. In principle, it combines fundamental theory of voltage stability and technological advances, primarily better and more accurate measurement devices able to provide measurements at high rates.
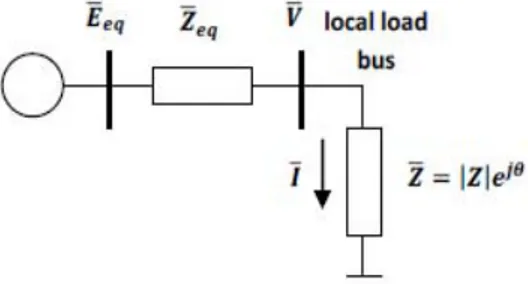
The method is based on representing the system as a two-bus equivalent (impedance of the two-bus and equivalent Thevenin's impedance and source representing the rest of the system), as illustrated in Fig. 1 [4,5,7].
Fig. 1. Two-bus equivalent circuit
The core of the method is accurate identification of the equivalent parameters using measurements collected at the local bus. Emergence of synchronized phasor measurements opened the possibility for computation and refreshment of these parameters at high rates and in the original proposal [7] a recursive least squares algorithm has been proposed to this purpose. Equivalent parameter identification at high rate transforms the linear system of Fig. 1 to a linear parameter varying system, thus better accounting for nonlinearity present in real systems.
Using basic circuit theory equations for the two-bus system of Fig. 1, realistic condition for maximum deliverable
power under given load power factor can be easily derived and is equivalent to [4,5,7],
Z
Z
eq=
(1) Equation (1) can be directly used as the voltage stability index while several other indices can be derived from the condition of equation (1). One such index is the power loading margin.A maximum MVA corresponding to the current values (computed at time t) of the equivalent parameters is computed as,
(
)(
)
(
θ θ)
θ 2 2 2 2 2 max tan 1 tan 2 tan 1 + + ± ⋅ + + = eq eq eq eq eq X R X R E S (2)Knowing maximum MVA power the loading margins can be computed as,
S
S
S
=
−
Δ
max (3)Active and reactive power margins can be easily computed for known load power factor [4,5,7].
III.PROPOSED METHOD
The main idea of the method is to use VIP derived quantities (Thevenin equivalent parameters) and measurements of relevant variables in order to monitor voltage stability conditions and detect instability. Each time new measurements are collected the stability boundary is re-computed and presented in the P-Q plane. In addition, the power margins are computed at each time instant, while keeping the possibility to compute the loading margins as necessary. Different notions of voltage stability power margins in P-Q plane are illustrated in Fig. 2.
Fig. 2. Voltage stability power margins in P-Q plane
The maximum MVA is computed using equation (2) rewritten below for current values of the equivalent
parameters (at time instant t when relevant measurements are collected),
(
)(
)
(
eqt eqt t eqt eqt t)
t t eq X R X R E S θ θ θ 2 2 , 2 , , , 2 2 , max tan 1 tan 2 tan 1 + + ± ⋅ + + = (4)Assuming the voltage stability boundary is defined by a parabolic equation (this is a realistic assumption [4,5]),
c bP aP
Qt= t + t+
2 (5)
the problem becomes determination of the parabola coefficients a, b, and c.
These coefficients are uniquely determined by points A, B, and C shown in Fig. 2. Coordinates of these points in P-Q plane are obtained as,
(
Qt)
A: 0, max (6-a)(
,0)
: Pmax,t B (6-b)(
cosθ, sinθ)
: Smax,t⋅ Smax,t⋅ C (6-c)The values of Pmax,t and Qmax,t are derived as follows: a. Letting tanθt =X/R→0 (only the active load power
increase assumed) results in (from (4)):
(
eqt eqt)
t eq t Z R E P , , 2 , max, 2 + = (7) b. For tanθt =X/R→∞ (only reactive load powerincrease assumed) from (4) one gets:
(
eqt eqt)
t eq t Z X E Q , , 2 , max, 2 + = (8) where 2 , 2 , ,t eqt eqt eq R X Z = + .In principle, only one measurement sample (N=1) is sufficient to uniquely determine the coefficients a, b, and c. However, utilization of multiple data samples is useful in order to minimize impact of fast (and often temporary) system transients.
Once the coefficients a, b and c are determined, the active and reactive load power margins, at current time instant t can be computed as, t t t
P
P
P
=
−
Δ
max, (9-a) t t tQ
Q
Q
=
−
Δ
max, (9-b) t t tS
S
S
=
−
Δ
max, (9-c)where P and t Q are the values of load active and reactive t
powers measured at time instant t.
The proposed method can be implemented in different forms:
1. Monitoring of power margins at individual system load buses (substations). The resulting margins are powers that can be delivered to monitored substation.
2. Transmission corridor margins monitoring. The resulting margins are powers (apparent, active, or reactive) that can be transmitted over the corridor (from sending to receiving end) before voltage stability limit is reached.
3. Load center margins monitoring. This is an application of the transmission corridor case. Resulting margins are powers that can be delivered to the load center over particular in-feeds.
IV.RESULTS USING TEST AND A REAL-LIFE SYSTEM The capabilities of the proposed method are demonstrated on the Nordic test system and a real-life system model (a portion of the North-West USA system. Two embodiments of the method are illustrated:
1. Stability monitoring of a system bus (using Nordic test system) when instability develops in several tens of seconds, after a large disturbance, with high sampling rate of relevant variables (sampled every 0.1 seconds), and
2. Stability monitoring and instability detection for a load center (using the North-West USA system model) when instability develops, after a large disturbance, in several minutes with sampling of relevant variables every 2 seconds.
Computations detailed in the previous section are performed using only one measurement sample in all considered cases.
A. Results using Nordic test system
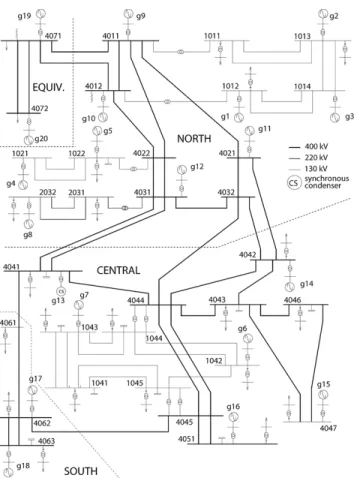
This system is specifically designed to study voltage related problems and includes the models of all equipment having key impacts on system voltage stability conditions. The system was extensively used in illustrating different voltage stability detection and control approaches and the model used in this paper corresponds to the one of [12]. The one-line diagram of this 52-bus, 20-machine system is shown in Fig. 3.
Full dynamics model of the system is used to demonstrate capabilities of the proposed method. The model includes for each generator: a standard synchronous machine model with 3 or 4 rotor windings, a simple governor (for generators in the North and Equiv areas while the other ones do not participate in frequency control), a simple automatic voltage regulator including an over-excitation limiter.
Each load is fed through a transformer with automatic load tap changer. There is a delay of 30 seconds on the first tap change and a shorter delay on the subsequent steps. Each load is represented by an exponential model with exponent 1 (constant current) for the active power and exponent 2 (constant admittance) for the reactive power.
The model has been implemented in the Simulink environment [13]. A variable step size method is used to simulate its dynamics.
System load bus 1041 is chosen for monitoring. The specific case considered involves tripping the line 4032-4044 at t=5 seconds. The system evolves over 85 seconds under the effect of load tap changers and over-excitation limiters acting over several generators. The long-term voltage instability results in a loss of short term stability in the form of a field current limited generator losing synchronism. The evolution of the voltage magnitude at the bus is shown in Fig. 4. All relevant variables (voltage magnitude and angle, current magnitude and angle, active and reactive load powers) of this bus are sampled every 0.1 seconds.
Fig. 3. One-line diagram of 52-bus Nordic test system
The method introduced in [12] is an accurate model-based method with wide-area view of the system (provided by a relatively rich set of synchronized phasor measurements). This method is used as a benchmark in order to asses accuracy of the proposed method. The method of [12] detects developing instability at t=47 seconds.
The voltage stability margins are computed in terms of maximum deliverable power (MW and Mvar) of bus 1041. Parameters of the Thevenin’s equivalent for this bus are computed using the method of [11]. These margins become zero at t=85 seconds (few seconds before the system collapse). This observation raises the need for defining appropriate thresholds for the margins for timely detection of developing instability. In this particular case the appropriate
value of the threshold would be reactive power at time t=47 seconds (instability detection using method of [12]). This value is approximately 52 Mvar (to be compared with 275 Mvar in undisturbed conditions). In general, setting the thresholds is system dependent and is a topic of our ongoing research activities.
Fig. 4. Evolution of voltage magnitude at bus 1041
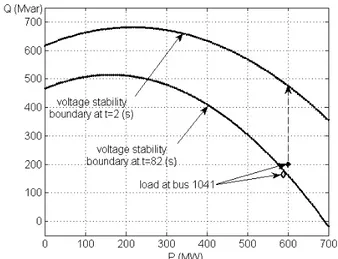
A voltage stability boundary in the P-Q plane is computed for two time instants during the voltage collapse scenario described above (before and after tripping of line 4032-4044). The boundaries, together with corresponding operating points are shown in Fig. 6. The stability boundary curve shrinks over time causing the stability margin to gradually diminish, leading to a voltage collapse.
The system is driven to voltage instability by actions of over-excitation limiters of several generators and load tap changers. All these actions are properly accounted for by the method in the form of detection of the abrupt change (decrease) in power margin (see Fig. 5). The same holds true for the line tripping taking place “upstream”, i.e. in electrically remote area not monitored completely by the measurements.
Our observation, based on many simulations conducted, is that the assumption on P-Q quadratic relation and margin computation are accurate when the system approaches the voltage stability boundary (our interest lies in this problem since future development will include design of appropriate controls when the system approaches the stability boundary). Away from the boundary the results are less accurate.
Fig. 6. Voltage stability boundary and the loads for two time instants
B. Results using a real-life system model
A portion of the North-West USA system is graphically sketched in Fig. 7. The system consists of a generation area and several load dominant areas (load centers). The results included in this paper correspond to Load Center-1. This load center is fed from the generation dominant area through two in-feeds. Fig.7 indicates the in-feed of interest. Load Center-1 is connected to generation dominant area by this in-feed through two long transmission lines. The lines originate from the same bus in the generation dominant area and end in two separate, but electrically close, buses in the load center. Locations of phasor measurement units are shown in Fig. 7. In this particular example, the relevant variables are sampled every 2 seconds from the output of a time sequence power flow software (time step simulation tool available in the PowerWorld software suite [14]).
Fig. 7. A simple load center configuration of a real-life power system
The particular case considered in this example is a load ramping in the load center followed by a line tripping in the generation dominant area. Both generation dominant area and load center are equipped with shunt capacitors that are switched during specific scenario considered.
The event of the voltage collapse is described below: 1. The load ramping or linear load increase (assuming
increase in both active and reactive load powers maintaining the initial load power factors) in the load center causes slow voltage magnitudes decrease in the load center.
2. At time instant of approximately 2200 seconds, a shunt capacitor is switched in the system in order to improve voltage profile.
3. Further load increase results in progressive voltage decrease and another shunt capacitor is switched at time instant of approximately 7000 (s).
4. Few hundred seconds after time instant of 8000 (s) a line was tripped by a protection device in the generation dominant area. After this, the system further evolves with several additional shunt capacitors switching trying to restore system voltages as loads continue to ramp. System collapses at the time instant of 13500 (s).
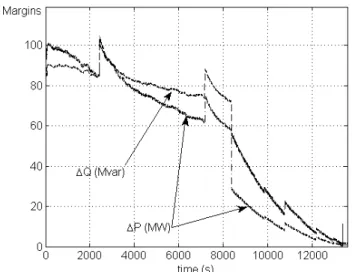
The results are illustrated in terms of time evolutions of voltage magnitude at the one of load center buses (Fig. 8) and power margins (Fig. 9).
The voltage stability power margins, in this case, are powers (MVA, MW and Mvar) that can be transmitted from the generation dominant area to the load center over the two transmission lines considered as a transmission corridor. Parameters of the Thevenin’s equivalent for the load center are computed, as in case with Nordic test system, using the method of [11] combined with the equivalent of transmission corridor computed using method of [10].
Determination of the voltage stability boundary in P-Q plane is performed for five time instants during the voltage collapse scenario described above (before and after line tripping in generation dominant area).
The boundaries, together with corresponding operating points are given in Fig. 10. As in case with Nordic test system, stability boundary curve shrinks causing the stability margin to gradually diminish.
Fig. 9. Evolution of power margins for the load center
The method is able to account for shunt capacitor locations in the system and detect their impact. These important voltage-related events are properly accounted for by the method in the form of the abrupt change (increase) in power margins (see Fig. 9). The same holds true for the line tripping taking place “upstream”, i.e. in the generation dominant area not monitored completely by the measurements.
Fig. 10 . Voltage stability boundary and the loads for five time instants Loading margins (with linear load increase in load dominant area and assuming constant load power factor) still can be easily computed and tracked in real-time (including visualization in P-Q plane). Evolution of loading margins is shown in Fig. 11.
Fig. 11 . Evolution of loading margins for the load center
V.CONCLUSIONS
A simple method to compute voltage stability power margins and their visualization in P-Q plane is presented in this paper. A stability boundary is computed in real-time assuming a parabolic P-Q curve. The margins are re-computed and visualized every time a new measurement set is collected. The results obtained using a test system and real-life system model are included to demonstrate the capabilities of the proposed method. The method offers the following advantages:
1. It is easy to implement in real time and it offers a simple and clear interpretation of its results - significantly better than voltage-only methods, but simpler than any other method.
2. The method takes advantage of fast PMU sampling (10-120 samples per second), enabling timely detection of changes in the system.
3. The method is adaptive as it tracks the changes in the system using recursive procedures for calculating the Thevenin and load equivalents.
4. It is applicable for voltage instability problems at various network locations: local bus, physical transmission corridor, and load center, at both transmission and distribution systems.
5. It can be implemented in both various hardware devices and Control Center software tools.
6. Can be easily combined as complementary to other indices (e.g. reactive reserve monitoring). The method is flexible to accommodate specific needs of system operators, such as updating the P-Q boundary at rate that will minimize impact of temporary transients. 7. The method is applicable for monitor slow changes in
daily system operations as well as to track faster changes during system dynamics.
VI.ACKNOWLEDGMENT
The authors gratefully acknowledge support of Bonneville Power Administration.
REFERENCES
[1] M. Glavic and T. Van Cutsem, “A short Survey of Methods for Voltage Instability Detection,” in Proc. 2011 IEEE Power Eng. Soc. General
Meeting, Detroit, MI, Jul. 2011.
[2] A. G. Phadke and J. S. Thorp, Synchronized Phasor Measurements and
Their Applications, Springer, 2008.
[3] D. Novosel, V. Madani, B. Bhragava, K. Vu, and J. Cole, “Dawn of the Grid Synhronization: Benefits, Practical Applications, and Deployment Strategies for Wide Area Monitoring, Protection, and Control,” IEEE
Power and Energy Magazine, pp. 49-60, Jan./Feb. 2008.
[4] C. W. Taylor, Power System Voltage Stability, EPRI Power System Engineering Series, McGraw Hill, 1994.
[5] T. Van Cutsem and C. Vournas, Voltage Stability of Electric Power
Systems, Boston, Kluwer Academic Publisher, 1998.
[6] C. Canizares (Editor/Coordinator), Voltage Stability Assessment:
Concepts, Practices, and Tools, IEEE PES Publication, Power System
Stability Subcommittee, ISBN 0780378695, 2002.
[7] K. Vu, M. M. Begovic, D. Novosel, and M. M. Saha, “Use of Local Measurements to Estimate Voltage-Stability Margin”, IEEE Trans. on
Power Systems, vol. 14, no. 3, pp. 1029-1035, Aug. 1999.
[8] P. Zhang, L. Min, and J. Chen, “Measurement Based Voltage Stability
Monitoring and Control”, US Patent Application No.: US 2009/0299664
A1, December 2009.
[9] M. H. Haque, “Determination of Steady-State Voltage Stability Limit Using P-Q Curve”, IEEE Power Engineering Review, pp. 71-72, April 2002.
[10] M. Larsson, C. Rehtanz, and J. Bertsch, “Real-Time Voltage Stability Assessment of Transmission Corridors”, in Proc. IFAC Symposium on
Power Plants and Power Systems, Seoul, S. Korea, 2003.
[11] S. Corsi and G. N. Taranto, “A Real-Time Voltage Instability Identification Algorithm Based on Local Phasor Measurements,” IEEE
Trans. Power Syst., vol. 23, no. 3, pp. 1271–1279, Aug. 2008.
[12] M. Glavic and T. Van Cutsem, “Wide-Area Detection of Voltage Instability From Synchronized Phasor Measurements. Part II: Simulation Results”, IEEE Trans. on Power Systems, vol. 24, no. 3, pp. 1417-1425, Aug. 2009.
[13] The MathWorks, Inc., available online at www.mathworks.com [14] PowerWorld corp., “Time Step Simulation (TSS)”, available online at
http://www.powerworld.com/features/TSS.asp BIOGRAPHIES
Mevludin Glavic (M’04–SM’07) is an Associate Consultant with Quanta Technology, Raleigh, NC. He was with the University of Wisconsin-Madison (1999–2000, as a Fulbright postdoctoral scholar) and with the University of Liège, Belgium (2001–2004 as a research fellow, 2006–2010 as a visiting professor). His research interests are in power system dynamics, stability, control, and optimization.
Muhidin Lelic (M’93 – SM’96) is a Director of Program Management at Quanta Technology, Raleigh, NC. Prior to joining Quanta Technology he held various positions in industry and academia, both in R&D and product development. Muhidin holds over 30 US and international patents and has published numerous papers in area of control systems technology. He also coauthored a book Modern Control Systems Engineering. His main technical focus is in system dynamics and controls and smart grids. He holds PhD and MSc degrees in electrical engineering from University of Sarajevo and University of Belgrade, respectively.
Damir Novosel (F '02) is President of Quanta Technology. Prior to joining Quanta Technology, he was President of KEMA T&D Consulting in the US. He has also held various positions in ABB including Vice President of global development and product management for automation products. Damir holds 16 US and international patents and has published over 100 articles in Refereed Journals and Conference Proceedings. His main technical focus has been in developing methods to improve power system monitoring, protection and control, including pioneering work in development of methods and products to identify corrective actions against power system disturbances. He is presently Chair of the IEEE PES Technical Council and IEEE PES VP of Technology. Damir holds PhD and MSc degrees in electrical engineering from Mississippi State University and University of Zagreb, Croatia, respectively.
Eric Heredia received his B.S. in Electrical Engineering from the University of Portland in 2002 and joined the Bonneville Power Administration (BPA) where he works in Transmission Planning. His work at BPA involves steady state power flow and transient stability studies for evaluating and planning the grid.
Dmitry Kosterev received his PhD degree in Electrical Engineering from Oregon State University in 1996. Dr. Kosterev is with Bonneville Power Administration, where his responsibilities include transmission planning, power system controls, power system modeling, power system performance analysis, reliable integration of renewable resources. Dr. Kosterev has chaired WECC Load Modeling Task Force since 2002. Dr. Kosterev is current chair of WECC Modeling and Validation Work Group.