VIRTUAL MACHINE FLOW ANALYSIS USING HOST KERNEL TRACING
HANI NEMATI
DÉPARTEMENT DE GÉNIE INFORMATIQUE ET GÉNIE LOGICIEL ÉCOLE POLYTECHNIQUE DE MONTRÉAL
THÈSE PRÉSENTÉE EN VUE DE L’OBTENTION DU DIPLÔME DE PHILOSOPHIÆ DOCTOR
(GÉNIE INFORMATIQUE) MAI 2019
c
ÉCOLE POLYTECHNIQUE DE MONTRÉAL
Cette thèse intitulée:
VIRTUAL MACHINE FLOW ANALYSIS USING HOST KERNEL TRACING
présentée par: NEMATI Hani
en vue de l’obtention du diplôme de: Philosophiæ Doctor a été dûment acceptée par le jury d’examen constitué de:
M. KHOMH Foutse, Ph. D., président
M. DAGENAIS Michel, Ph. D., membre et directeur de recherche M. ALOISE Daniel, Ph. D., membre
DEDICATION
To My Loving Parents, specially my Mom, Without the inspiration, drive, and support that you have given me, I might not be the person I am today. To My Lovely Mahsa, You changed my world since you entered into my life. The change is not simple and subtle. You added colors, meaning, and happiness in my life. I love you. To Ayden, You are a special gift from the heavens. Your smile warms my heart. I love you, today and forever,. . .
ACKNOWLEDGEMENTS
I would like to thank,
Michel Dagenais, for endless support and enthusiasm, for always being so positive, always believing in me and my capacity. and for creating such a lovely milieu in the lab. I can not imagine a better supervisor than you.
Seyed Vahid Azhari, I admire your philosophy on hard work but at the same time very permissive attitude. I have had much fun finding out new things with you.
Jim MacDonald, Francois Tetreault, and Octavian Stelescu, for giving me an oppor-tunity to test my host-based virtual machine analysis tool.
Bahman Khabiri, for always being a true friend.
The Dorsal lab, for its permissive atmosphere, stimulating lab-meetings with smart, hard-working colleagues and many laughter. Suchakrapani Datt Sharma, you were the perfect lab-partner to work with when I started in this group. Thank you for all your enthusiastic hard work, sanity, wisdom and courage. Francis Giraldeau, for dealing with me. Mo-hamad Gebai, for inspiring this work. Genevieve Bastien and Naser Ezzati Jivan, for being so positive and, for helpful discussions, not to forget, for all your enthusiasm in training. Abderrahmane Benbachir, for all the hard work, for your flexibility, and all the nice times we’ve shared analyzing trace. Houssem Daoud, for his useless but funny discussions and for never feeling things as impossible. Matthew Khouzam, for being so positive, and for being a good human being. Finally, thanks to the rest of the group: Julien Desfossez, Thomas Bertauld, Cédric Biancheri, Didier Nadeau, Paul Margheritta, Iman Kohyarnejad, Ahmad Shahnejat, Majid Rezazadeh, Loïc Prieur-Drevon, Adel Belkhiri, Pierre Zins, Marie Martin, Irving Muller, Quentin Fournier, Pierre-Frederick Denys, Anas Balboul, Loïc Gelle, Guillaume Champagne, and Arnaud Fiorini.
Finally and most importantly, I would like to deeply thank my loving parents, my dear parents-in-law, my beloved wife, Mahsa, my dearest son, Ayden, my dear brothers, Hamed and Hesam, and my dear sisters-in-law, Mojdeh and Shirin, for making me who I am as a human being. There are no words in any language that can express their importance in my life as a constant source of encouragement and inspiration.
RÉSUMÉ
L’infonuagique a beaucoup gagné en popularité car elle permet d’offrir des services à coût réduit, avec le modèle économique Pay-to-Use, un stockage illimité avec les systèmes de stockage distribué, et une grande puissance de calcul grâce à l’accès direct au matériel. La technologie de virtualisation permet de partager un serveur physique entre plusieurs envi-ronnements virtualisés isolés, en déployant une couche logicielle (Hyperviseur) au-dessus du matériel. En conséquence, les environnements isolés peuvent fonctionner avec des systèmes d’exploitation et des applications différentes, sans interférence mutuelle. La croissance du nombre d’utilisateurs des services infonuagiques et la démocratisation de la technologie de virtualisation présentent un nouveau défi pour les fournisseurs de services infonuagiques. Fournir une bonne qualité de service et une haute disponibilité est une exigence principale pour l’infonuagique. La raison de la dégradation des performances d’une machine virtuelle peut être nombreuses. a Activité intense d’une application à l’intérieur de la machine virtuelle. b Conflits avec d’autres applications à l’intérieur de la machine même virtuelle. c Conflits avec d’autres machines virtuelles qui roulent sur la même machine physique. d Échecs de la plateforme infonuagique. Les deux premiers cas peuvent être gérés par le pro-priétaire de la machine virtuelle et les autres cas doivent être résolus par le fournisseur de l’infrastructure infonuagique. Ces infrastructures sont généralement très complexes et peu-vent contenir différentes couches de virtualisation. Il est donc nécessaire d’avoir un outil d’analyse à faible surcoût pour détecter ces types de problèmes.
Dans cette thèse, nous présentons une méthode précise permettant de récupérer le flux d’exécution des environnements virtualisés à partir de la machine hôte, quel que soit le niveau de la virtualisation. Pour éviter des problèmes de sécurité, faciliter le déploiement et minimiser le surcoût, notre méthode limite la collecte de données au niveau de l’hyperviseur. Pour analyser le comportement des machines virtuelles, nous utilisons un outil de traçage léger appelé Linux Trace Toolkit Next Generation (LTTng) [1]. LTTng est capable d’effectuer un traçage à haut débit et à faible surcoût, grâce aux mécanismes de synchronisation sans verrous utilisés pour mettre à jour le contenu des tampons de traçage.
Notre méthode permet de détecter les différents états de vCPU, processus et fils d’exécution, non seulement à l’intérieur des machines virtuelles, mais également à l’intérieur des machines virtuelles imbriquées. Nous proposons également une technique d’analyse de chemin critique pour les machines virtuelles et les machines virtuelles imbriquées, permettant de suivre le chemin d’exécution d’un processus, à travers le réseau et les différentes couches de
virtuali-sation.
De plus, nous utilisons le traçage de l’hyperviseur pour extraire, d’une manière non intrusive, des données utiles permettant de caractériser le comportement des machines virtuelles à partir de l’hôte. En particulier, nous mesurons les périodes de blocage des machines virtuelles et le taux d’injection d’interruptions virtuelles, afin d’évaluer l’intensité d’utilisation des ressources. De plus, nous mesurons le taux de concurrences sur les ressources causées par l’hôte et les autres machines virtuelles, ainsi que les raisons de sorties du mode non privilégié vers le mode privilégié, révélant des informations utiles sur la nature de la charge de travail des machines virtuelles analysées. Ceci peut ensuite être utilisé pour optimiser le placement des machines virtuelles sur les noeuds physiques.
Nous avons implémenté nos méthodes d’analyse de machines virtuelles en tant que mod-ules d’extension dans TraceCompass [2]. TraceCompass est un logiciel libre d’analyse des traces et des fichiers journaux. Il fournit un cadre d’applications permettant d’extraire des métriques et de générer des vues graphiques. Nous avons implémenté plusieurs vues graphiques pour TraceCompass. Une vue des processus affiche les processus des machines virtuelles (à n’importe quel niveau), leurs niveaux d’exécution du code et leurs états (en exécution et bloqués). Une vue de vCPU affiche les états des fils d’exécution vCPU, du point de vue de l’hôte. Elle représente les fils d’exécution vCPU avec les autres fils d’exécution de l’hôte. La vue du chemin critique affiche, de manière transparente, les chaînes de dépen-dances d’attente/réveil des processus des machines virtuelles, quel que soit leur niveau de virtualisation. Nos tests montrent que le surcoût de notre approche est d’environ 0.3%, car nos méthodes limitent la collecte de données au niveau de l’hôte.
ABSTRACT
Cloud computing has gained popularity as it offers services at lower cost, with Pay-per-Use model, unlimited storage, with distributed storage, and flexible computational power, with direct hardware access. Virtualization technology allows to share a physical server, between several isolated virtualized environments, by deploying an hypervisor layer on top of hard-ware. As a result, each isolated environment can run with its OS and application without mutual interference. With the growth of cloud usage, and the use of virtualization, perfor-mance understanding and debugging are becoming a serious challenge for Cloud providers. Offering a better QoS and high availability are expected to be salient features of cloud com-puting. Nonetheless, possible reasons behind performance degradation in VMs are numerous. a) Heavy load of an application inside the VM. b) Contention with other applications inside the VM. c) Contention with other co-located VMs. d) Cloud platform failures. The first two cases can be managed by the VM owner, while the other cases need to be solved by the infrastructure provider. One key requirement for such a complex environment, with different virtualization layers, is a precise low overhead analysis tool.
In this thesis, we present a host-based, precise method to recover the execution flow of virtu-alized environments, regardless of the level of nested virtualization. To avoid security issues, ease deployment and reduce execution overhead, our method limits its data collection to the hypervisor level. In order to analyse the behavior of each VM, we use a lightweight tracing tool called the Linux Trace Toolkit Next Generation (LTTng) [1]. LTTng is optimised for high throughput tracing with low overhead, thanks to its lock-free synchronization mechanisms used to update the trace buffer content.
Our proposed method can detect the different states of vCPUs, processes, and threads, not only inside the VMs but also inside nested VMs. We also propose a VM and Nested VM critical path analysis technique, to follow the execution path of arbitrary processes, over the network as well as through multiple virtualization layers.
Moreover, we propose host level hypervisor tracing as a non-intrusive means to extract useful features that can provide for fine grain characterization of VM behaviour. In particular, we extract VM blocking periods as well as virtual interrupt injection rates to detect multiple levels of resource intensiveness. In addition, we consider the resource contention rate, due to other VMs and the host, along with reasons for exit from non-root to root privileged mode, revealing useful information about the nature of the underlying VM workload. This can then be used for the efficient placement of VMs on hosts
We implemented our methods for analyzing VMs as separate modules in TraceCompass [2]. TraceCompass is an Open-source software for analyzing traces and logs. It provides an extensible framework to extract metrics, and to build views and graphs. We implemented several graphical views for TraceCompass. A VM process view shows the processes of VMs (in any level) with its level of code execution and states (all running and blocking states). A VM vCPU view displays the states for vCPU threads from, the host point of view. It represents vCPU threads along with other threads inside the host. The VM critical path view shows the extracted waiting / wake-up dependencies chains for the running processes, across VMs, for any level of virtualization, in a transparent manner. Our benchmarks show that the overhead for our approach is around 0.3%, because our methods limit their data collection to host level.
TABLE OF CONTENTS DEDICATION . . . iii ACKNOWLEDGEMENTS . . . iv RÉSUMÉ . . . v ABSTRACT . . . vii TABLE OF CONTENTS . . . ix
LIST OF TABLES . . . xiii
LIST OF FIGURES . . . xiv
LIST OF SYMBOLS AND ACRONYMS . . . xvii
CHAPTER 1 INTRODUCTION . . . 1
1.1 Challenges of Virtualized Environment Analysis . . . 1
1.2 Research Objectives . . . 2 1.3 Contributions . . . 3 1.4 Outline . . . 3 1.5 Publications . . . 4 1.5.1 Journal Papers . . . 4 1.5.2 Conference Papers . . . 5
CHAPTER 2 LITERATURE REVIEW . . . 6
2.1 Background Information . . . 7
2.1.1 Cloud Computing . . . 7
2.1.2 Cloud Service Models . . . 7
2.1.3 Essential characteristics of Cloud Computing . . . 8
2.1.4 Virtualization Technology . . . 8
2.1.5 VM and Nested VM instruction set . . . 10
2.2 Cloud Analysis tools: The Need . . . 13
2.3 Cloud Analysis tool: Properties . . . 15
2.4 Monitoring System Architecture . . . 17
2.4.2 The aggegator component: Tracing and Profiling Tools . . . 19
2.5 Study on existing VM analysis and monitoring approaches . . . 24
2.6 Summary of Literature Review . . . 33
CHAPTER 3 RESEARCH METHODOLOGY . . . 34
3.1 VM Process Identifier . . . 34
3.2 Nested VM Analysis . . . 35
3.3 vCPU and Process State Analysis . . . 35
3.4 Execution Flow Analysis . . . 36
3.5 VM Clustering . . . 37
3.6 Experimentation . . . 37
CHAPTER 4 ARTICLE 1: "VIRTFLOW: GUEST INDEPENDENT EXECUTION FLOW ANALYSIS ACROSS VIRTUALIZED ENVIRONMENTS" . . . 40
4.1 Abstract . . . 40
4.2 Introduction . . . 41
4.3 Related Work . . . 43
4.4 VM and Nested-VM Machine States . . . 46
4.5 Nested VM Analysis Algorithms . . . 50
4.5.1 Any-Level VM Detection Algorithm (ADA) . . . 50
4.5.2 Nested VM State Detection Algorithm (NSD) . . . 53
4.5.3 Guest (Any-Level) Thread Analysis (GTA) . . . 53
4.6 Use-Cases . . . 57
4.6.1 Analysis Architecture . . . 57
4.6.2 Thread-level and Process-level Execution Time Profiling . . . 59
4.6.3 CPU Cap and CPU Overcommitment Problem . . . 59
4.6.4 Memory Overcommitment Problem . . . 64
4.6.5 Overhead of Virtualization Layer for Different Types of Workload . . 65
4.6.6 Overhead of Virtualization for Different Operating Systems . . . 66
4.7 Evaluation . . . 68
4.7.1 virtFlow Overhead Analysis . . . 68
4.7.2 Ease of Deployment . . . 69
4.7.3 Limitations . . . 69
4.8 Conclusion . . . 69 CHAPTER 5 ARTICLE 2: "CRITICAL PATH ANALYSIS THROUGH
TRACING" . . . 71
5.1 Abstract . . . 71
5.2 Introduction . . . 72
5.3 Related Work . . . 74
5.4 VM and Nested-VM Machine States . . . 76
5.4.1 Virtual Interrupt . . . 77
5.4.2 Virtual Process States . . . 77
5.5 VM Analysis Algorithms . . . 78
5.5.1 Any-Level vCPU States Detection Algorithm (ASD) . . . 79
5.5.2 Guest (Any Level) Thread-state Analysis (GTA) . . . 85
5.5.3 Host-based Execution-graph Construction (HEC) Algorithm . . . 86
5.6 Use cases . . . 89
5.6.1 Analysis Architecture . . . 90
5.6.2 Use case 1: Wait for Resources . . . 91
5.6.3 Use case 2: High Availability and Performing Rolling Updates . . . . 98
5.6.4 Use case 3: Concurrent Processes . . . 100
5.6.5 Use case 4: Communication Intensive VM . . . 101
5.6.6 Use case 5: APT Analysis . . . 102
5.6.7 Use Case 6: Bootup analysis . . . 102
5.6.8 UseCase 7: Sensitivity Analysis . . . 104
5.7 Evaluation . . . 105
5.7.1 CPA of Trace Compass vs. HEC . . . 105
5.7.2 Overhead Analysis . . . 106
5.7.3 Ease of Deployment . . . 107
5.7.4 Limitations . . . 108
5.8 Conclusion . . . 108
CHAPTER 6 ARTICLE 3: "HOST-BASED VIRTUAL MACHINE WORKLOAD CHAR-ACTERIZATION USING HYPERVISOR TRACE MINING" . . . 109
6.1 Abstract . . . 109
6.2 Introduction . . . 110
6.3 Related Work . . . 112
6.4 VM Metrics and Features Extraction . . . 114
6.4.1 VMX Operation . . . 114
6.4.2 Virtual Interrupt Injection . . . 115
6.4.4 Process Ranking Algorithm . . . 117
6.4.5 Feature extraction and feature selection . . . 121
6.5 VM Workload Clustering Model . . . 123
6.6 Experimental Evaluation . . . 126
6.7 Overhead Analysis . . . 136
6.8 Ease of Deployment . . . 137
6.9 Limitations . . . 137
6.10 Conclusions . . . 137
CHAPTER 7 GENERAL DISCUSSION . . . 139
7.1 Revisiting Milestones . . . 139
7.2 Research Impact . . . 140
7.3 Limitations . . . 141
CHAPTER 8 CONCLUSION . . . 142
LIST OF TABLES
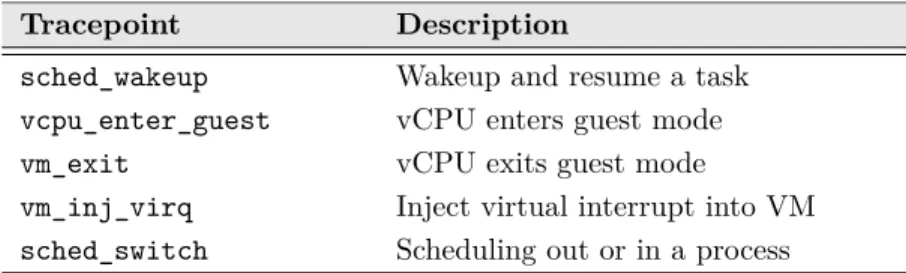
Table 2.1 Available Kernel Tracepoints and their type . . . 20
Table 3.1 Needed Tracepoints for our vCPU state detection and Execution path Analysis . . . 39
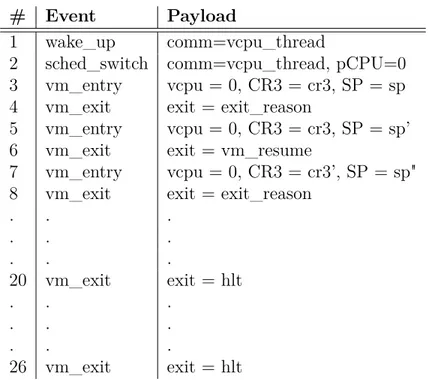
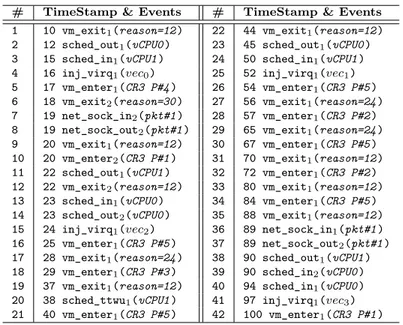
Table 4.1 Sequence of events from the host related to Figure 4.6 . . . 51
Table 4.2 Experimental Environment of Host, Guest, and NestedVM . . . 57
Table 4.3 Events required for analysis . . . 58
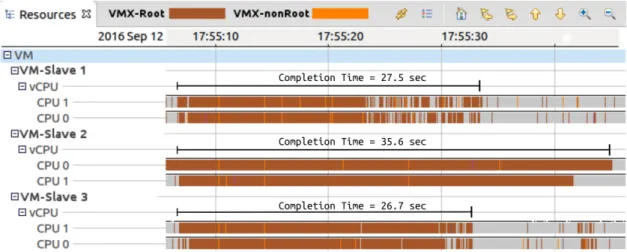
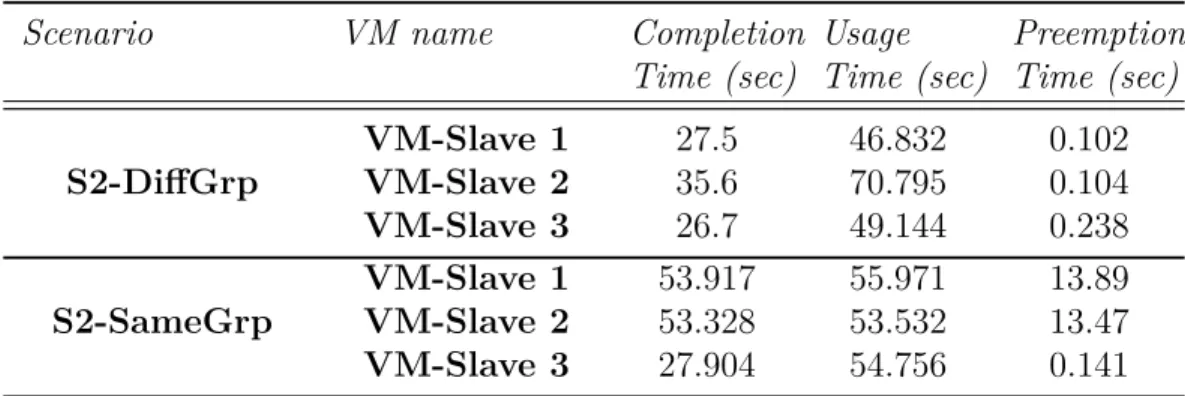
Table 4.4 Completion time for Hadoop VM-Slaves in different scenarios. . . 61
Table 4.5 Execution time for different VMs when the host is suffering from Mem-ory overcommitment. . . 65
Table 4.6 Execution time for Fibo program on different levels of virtualization and different Operating Systems. . . 68
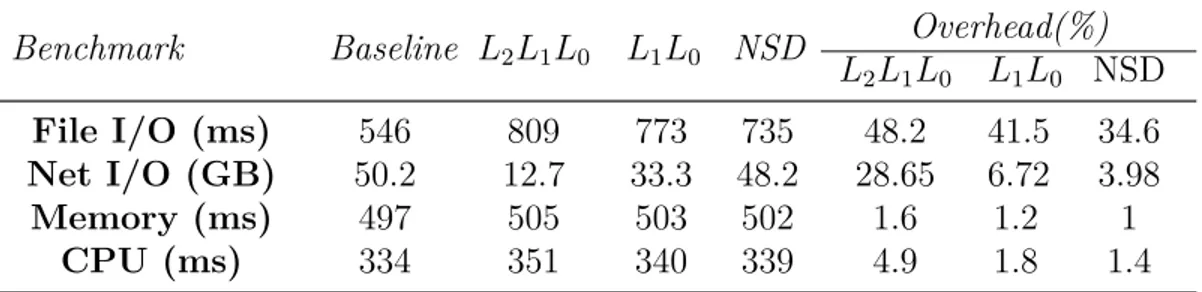
Table 4.7 Comparison of our approach and the other multi-level tracing ap-proaches in term of overhead for synthetic loads . . . 69
Table 5.1 Events and their payload based on Host kernel tracing (vec0 = Disk, vec1 = T ask, vec2 = N et, vec3 = T imer) . . . . 81
Table 5.2 Experimental Environment of Host, Guest, and NestedVM . . . 90
Table 5.3 Events required for analysis . . . 91
Table 5.4 Wait analysis of Hadoop TeraSort . . . 93
Table 5.5 Execution time for different VMs when the host is suffering from Mem-ory overcommitment. . . 98
Table 5.6 Wait analysis of different applications, to find out the sensitivity of a VM to a specific resource . . . 105
Table 5.7 Frequency of wait for different applications, to find out the sensitivity of a VM to a specific resource . . . 106
Table 5.8 Overhead Analysis of HEC as compared to CPA . . . 107
Table 6.1 caption . . . 119
Table 6.2 The complete list of metrics extracted from streaming of trace data . 124 Table 6.3 List of applications for workload generation . . . 127
Table 6.4 Overhead analysis of WRA algorithm comparing with agent-based fea-ture extraction method . . . 136
LIST OF FIGURES
Figure 2.1 Architecture of a native hypervisor . . . 9
Figure 2.2 Architecture of Qemu/KVM . . . 10
Figure 2.3 One-Level Nested VM Architecture for VMX . . . 11
Figure 2.4 A monitoring system and its components . . . 17
Figure 2.5 LTTng components and their tracing path [3] . . . 21
Figure 2.6 eBPF architecture for tc interface [4] . . . 23
Figure 3.1 Research milestones and progression . . . 34
Figure 3.2 Virtual Machine Process State Transition . . . 36
Figure 3.3 Architecture of our implementation . . . 38
Figure 4.1 Execution latency (ms) for the same workload . . . 42
Figure 4.2 Two-Level VMs (Nested VM) Architecture for VMX . . . 47
Figure 4.3 Virtual Machine Process State Transition . . . 47
Figure 4.4 Two-Level VMs Process State Transition . . . 48
Figure 4.5 n-Levels Nested Virtual Machine Process State Transition . . . 49
Figure 4.6 vCPU states using different algorithms . . . 50
Figure 4.7 Architecture of our implementation . . . 58
Figure 4.8 Control flow view of threads inside the virtual machine . . . 59
Figure 4.9 Three slaves running one submitted task- VM-Slave 2 responses late to each task . . . 60
Figure 4.10 Execution time of the prime thread (CPU view) . . . 61
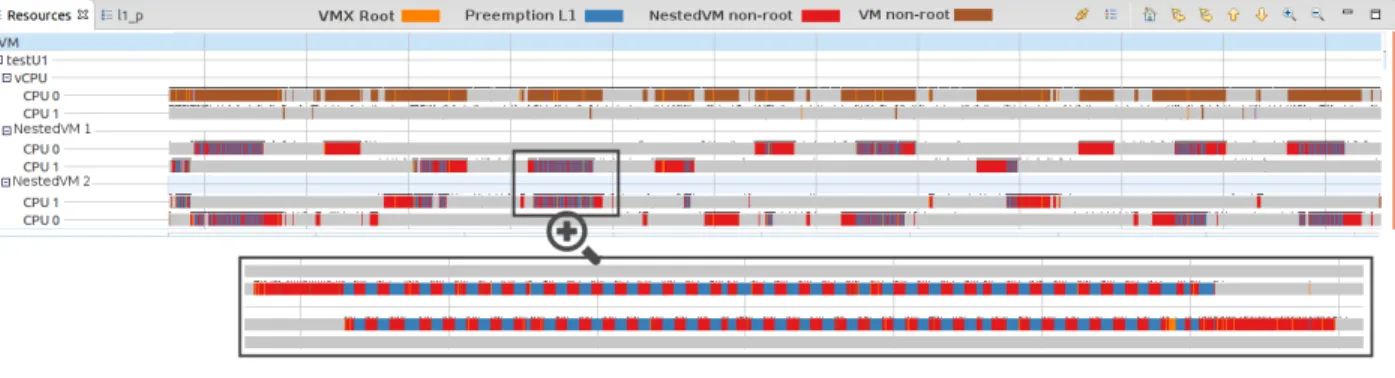
Figure 4.11 Resource view of CPU for two nested VMs inside VM testU1 by host tracing - L1 Level Preemption . . . 62
Figure 4.12 Resource view of CPU for one nested VM inside VM testU1 preempted by testU2 by host tracing - L0 Level Preemption . . . 62
Figure 4.13 Resource view of CPU for two different nested VMs inside VM testU1 preempted by VM testU2 and each other by host tracing - L0 and L1 Levels Preemption . . . 63
Figure 4.14 Overhead of Virtualization for different types of workload . . . 66
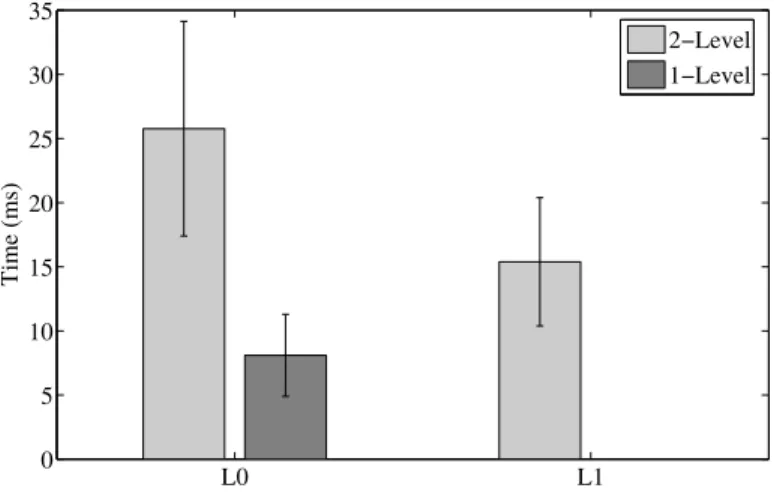
Figure 4.15 Average wake up latency for Nested VMs and VMs . . . 66
Figure 5.1 Two-Level VMs (Nested VM) Architecture for VMX . . . 76
Figure 5.2 One-Level Virtual Machine Process State Transition . . . 77
Figure 5.3 n-Levels Nested Virtual Machine Process State Transition . . . 79
Figure 5.5 Example of Execution Graph based on events from Table 5.1 . . . 89
Figure 5.6 The Hadoop TeraSort algorithm is used to sort 50GB of Data, VM-Slave 1 is late because of waiting for Disk . . . 93
Figure 5.7 Frequency of wait for disk for Slave 1 and Slave 2 - P1-1: 2039963648, P1-2: 869769216, P1-3: 2046287872, P2-1: 2029756416, P2-2: 877412352, P2-3: 886243328 . . . 94
Figure 5.8 VM Disk . . . 95
Figure 5.9 Nested VM Disk . . . 95
Figure 5.10 Wait analysis of vProcess when there is resource contention between two VMs . . . 95
Figure 5.11 Wait analysis of RPC client and server with network issue using GTA algorithm . . . 96
Figure 5.12 Wait analysis of RPC client and server without network issue using GTA algorithm . . . 96
Figure 5.13 Critical Path of request, showing the interaction between VMs . . . . 96
Figure 5.14 CPU preemption for different levels of virtualization . . . 97
Figure 5.15 big downtime - Upgrade System downtime is 7.56 sec . . . 99
Figure 5.16 Small downtime - Upgrade System downtime is 98.6ms . . . 100
Figure 5.17 Analyzing a VM that has process . . . 101
Figure 5.18 Latency analysis of handling Invite message using HEC algorithm . . 102
Figure 5.19 Reverse engineering of APT using HEC . . . 103
Figure 5.20 Bootup for Linux and Windows 10 Pro . . . 104
Figure 5.21 Analyzing CPU-burn using CPA algorithm . . . 106
Figure 5.22 Analyzing CPU-burn using HEC algorithm . . . 106
Figure 6.1 Virtual machine’s virtual CPU state transition . . . 115
Figure 6.2 Connectivity graphs for different groups of processes. Here, three groups of g#1, g#2, and g#3 are shown. . . 120
Figure 6.3 Example . . . 121
Figure 6.4 Architecture of our implementation . . . 122
Figure 6.5 State History Tree used to store different information of VM . . . 123
Figure 6.6 Characteristic of workloads discovered in first stage of clustering . . . 128
Figure 6.7 Similarity plot for the five workload clusters discovered in the first group, i.e., (C0, Cj), j ∈ [0, 4] (Silhouette = 0.59). . . . 129
Figure 6.8 Silhouette score of VM clusters discovered in second stage of clustering. Cj represents the second stage cluster index. . . 131
Figure 6.9 Characteristic of workloads discovered in the second stage of clustering. Cj represents the second stage cluster index. . . 131 Figure 6.10 vCPU view for the build-mplayer VM that has a high task dependency
and high CPU utilization . . . 132 Figure 6.11 One of the instances from cluster (C0, C0) . . . 132 Figure 6.12 Similarity plot for the three workload clusters discovered in the second
group, i.e., (C1, Cj), j ∈ [0, 2] (Silhouette = 0.40). . . . 133 Figure 6.13 Similarity plot for the two workload clusters discovered in the third
group, i.e., (C2, Cj), j ∈ [0, 1] (Silhouette = 0.46). . . . 133 Figure 6.14 Similarity plot for the five workload clusters discovered in the first
group using PRA algorithm, i.e., (C0, Cj), j ∈ [0, 4] (Silhouette = 0.64) 135 Figure 6.15 Workload characteristic of C0 cluster discovered in the second stage of
clustering based on the PRA algorithm. . . 136 Figure 6.16 Silhouette score of the C0 cluster discovered in the second stage of
LIST OF SYMBOLS AND ACRONYMS
NIST National Institute of Standards and Technology VM Virtual Machine
IaaS Infrastructure as a Service PaaS Platform as a Service SaaS Software as a Service AaaS Application as a Service vCPU Virtual CPU
pCPU Physical CPU OS operating system
VMX Virtual Machine eXtensions SVM Secure Virtual Machine VMM Virtual Machine Monitor KVM Kernel based Virtual Machine Qemu Quick emulator
VMCS Virtual Machine Control Structure NPT Nested Page Tables
EPT Extended Page Table CI Continuous Integration SLA Service Level Agreement
PaU Pay as Use
KPI Key Performance Indicator
LTTng Linux Trace Toolkit next generation PMU Performance Monitoring Unit
eBPF Extended Berkeley Packet Filter AMP Application Performance Management AI Artificial Intelligence
PCMONS Private Cloud Monitoring System XDR eXternal Data Representation SVM Support Vector Machine TSRSVM Training Set Refreshed SVM
CHAPTER 1 INTRODUCTION
The Cloud architecture relies on multiple layers of vitualization, which leads to sharing resources, and maintaining good security, isolation between tenants, elasticity and scalability. In this way, infrastructure providers can maximize their profit by leveraging their resources for delivering services to thousands of cloud users.
The classical approaches for monitoring and debugging VMs is to use existing toolkits for debugging and troubleshooting software systems, or adding printout functions to the source code. These approaches are not tailored for virtual machine, and may add a large overhead to the system. On the other hand, tracing can be an important resource for analysing virtual machines, providing very insightful approaches to be further developed. Tracing is used for analysis, validation, optimization, and understanding the behaviour of complex multi-layered software systems [5].
The main focus of this thesis is to facilitate the analysis of VMs, and to enhance the com-prehension of application executions inside VMs. This includes the development of several agent-less algorithms, using existing tracepoints in the Linux Kernel-based Virtual Machine (KVM) module, along with new added tracepoints, in order to analyse VM processes in different virtualization layers, along with their communication with other processes, in a distributed manner.
1.1 Challenges of Virtualized Environment Analysis
While the cloud architecture offers many benefits, monitoring and analysing such a large-scale distributed system, in terms of debugging and troubleshooting, is a big challenge for infrastructure providers. The challenge becomes even more complicated when VMs can execute nested hypervisors (Nested VMs). The Infrastructure as a Service (IaaS) provider scheme gives the cloud user the ability to manage and use their own hypervisor as a VM. However, such cloud applications become even more complex.
The other challenge in analysing VMs is to trace each and every layer, and to correlate the information from the different layers. Moreover, it generates a lot of redundant data, incurring a large overhead, and in most cases the IaaS administrator cannot install a tracing agent in the client VM. Situations where a tracing agent cannot be installed include: 1) Because of security concerns, the cloud provider does not have access to the VMs. 2) The VM kernel is too old to install a tracing tool. 3) The VM kernel is closed-source and there is
no tracer available. 4) The VMs is limited in terms of resources. Nonetheless, reducing the complexity of analyzing and monitoring VMs remains an important issue. The administrator may have to deal with thousands of VMs, and it is difficult to understand the root cause of issues.
As mentioned earlier, in the cloud environment, each VM and its applications have the illusion of having the whole system resources available to themselves, while in reality the ressources are aggressively shared in order to maximize efficiency and profit. Correspondingly, an application could be tested and validated in a non-virtualized environment but fail to run in a virtualized environment. Thus, it is important to quantify the resource usage of an application while its behaviour may change over time. Tracking these changes helps IaaS providers in tuning the configuration for each VM and host. Of the many different VM analysis techniques proposed in the literature, only a few support agent-less operation (e.g, Virtual Machine Introspection (VMI) techniques [6]).
In summary, for such complex virtualised distributed environments, there is a need to elab-orate more sophisticated algorithms and techniques for performance analysis.
Research Questions: The state-of-the art VM analysis techniques have not addressed the challenges of efficiently analysing VMs in different layers. In view of the issues discussed earlier, we define four important research questions that have not been addressed in-depth in this domain:
− How to detect deviations in virtual machine performance, when a multi-layer tracer may add a significant load?
− What are the most relevant features for detecting over-utilized and under-utilized phys-ical hosts?
− How to track the application changes and quantify its resources needs?
− How to cluster VMs based on workload characteristics? What are the most relevant features to classify a VM?
1.2 Research Objectives
To obtain a highly detailed view of a VM, while keeping the tracing overhead almost neg-ligible, an agent-less technique is proposed, to avoid the cost of tracing for each and every VM and layer. In addition, there is a need to elaborate more automated techniques for VM performance analysis.
For this research, the general objective is to solve the problem of analysing multi-layered and distributed virtualized environments.
Furthermore, we identified specific objectives of our research as follows :
− To develop a vCPU and process state detection algorithm that can automatically in-vestigate the root cause of latencies in VMs.
− To study the behaviour of VMs in any level of virtualization.
− To develop a new algorithm for dependency analysis of VM processes.
− To propose an algorithm to reduce the complexity of analysing and monitoring VMs by leveraging the VM clustering technique.
1.3 Contributions
In line with the research objectives stated above, this thesis presents the following original contributions in the field of virtual machine analysis:
− A fine-grained VM vCPU and nested VM vCPU state analysis (including reasons for blocking).
− An approach to follow execution paths of arbitrary processes, over the network as well as through multiple virtualization layers.
− A clustering method to characterize the workload of VMs.
− Several graphical views to present a time-line for each process and vCPU, with different states.
1.4 Outline
The chapters are organized as follows. Section 2 presents some background information and a summary of other existing approaches for VM analysis, nested VMs, feature extraction, and VM clustering. Chapter 3 outlines our research methodology and explains the process of generating research leads, identifying problems, actionable items, specific milestones and eventual outcomes, in terms of research papers. It presents an overall view of the body of this research. This is followed by three journal publications (research papers), presented in Chapters 4, 5, and 6.
In Chapter 4, we first present a new host hypervisor based analysis method which can inves-tigate the performance of VMs in any nesting level. We also propose a vCPU state builder algorithm, and Nested VM state detection algorithm, to detect the state of vCPUs and nested VMs along with the reason for being in that state. Then, we propose a new approach for profiling threads inside the VMs by host tracing. This article is titled “virtFlow: Guest Independent Execution Flow Analysis Across Virtualized Environments” and appeared in the IEEE Transactions on Cloud Computing (TCC).
The second article, in Chapter 5, discusses a new execution-graph construction algorithm to extract the waiting / wake-up dependency chains from the running processes across VMs, for any level of virtualization, in a transparent manner. This article is titled “Critical Path Anal-ysis through Hierarchical Distributed Virtualized Environments using Host Kernel Tracing” and was submitted to the IEEE Transactions on Cloud Computing (TCC).
The third article, in Chapter 6, presents a novel host level hypervisor tracing technique as a non-intrusive way to extract useful features, enabling a fine grained characterization of VM behaviour. In particular, we extracted VM blocking periods as well as virtual interrupt injection rates to detect multiple levels of resource usage intensity. This article is titled “ Host-based Virtual Machine Workload Characterization using Hypervisor Trace Mining” and was submitted to Journal of ACM Transactions on Modeling and Performance Evaluation of Computing Systems.
Finally, in Chapters 7 and 8, we present a summary and discussion of our research contribu-tions and their impact on the tracing ecosystem, and we provide recommendacontribu-tions for future work in this field.
1.5 Publications
The chapters outlined above are based on the published/submitted papers mentioned in this section. The publications are divided into two sections: journal papers included in this thesis, and conference papers.
1.5.1 Journal Papers
1. H. Nemati and M. R. Dagenais, "virtFlow: Guest Independent Execution Flow Analysis Across Virtualized Environments," in IEEE Transactions on Cloud Computing. doi: 10.1109/TCC.2018.2828846
Analysis through Hierarchical Distributed Virtualized Environments using Host Kernel Tracing," submitted to IEEE Transactions on Cloud Computing.
3. Hani Nemati, Seyed Vahid Azhari, Mahsa Shakeri, and Michel R. Dagenais, "Host-based Virtual Machine Workload Characterization using Hypervisor Trace Mining," submitted to ACM Transactions on Modeling and Performance Evaluation of Computing Systems.
1.5.2 Conference Papers
1. H. Nemati and M. R. Dagenais, "VM processes state detection by hypervisor tracing," 2018 Annual IEEE International Systems Conference (SysCon), Vancouver, BC, 2018, pp. 1-8. doi: 10.1109/SYSCON.2018.8369612
2. H. Nemati, G. Bastien and M. R. Dagenais, "Wait analysis of virtual machines using host kernel tracing," 2018 IEEE International Conference on Consumer Electronics (ICCE), Las Vegas, NV, 2018, pp. 1-6. doi: 10.1109/ICCE.2018.8510984
3. Hani Nemati, Suchakrapani Datt Sharma, and Michel R. Dagenais. 2017. Fine-grained Nested Virtual Machine Performance Analysis Through First Level Hypervisor Tracing. In Proceedings of the 17th IEEE/ACM International Symposium on Cluster, Cloud and Grid Computing (CCGrid ’17). IEEE Press, Piscataway, NJ, USA, 84-89. DOI: https://doi.org/10.1109/CCGRID.2017.20
4. S. D. Sharma, H. Nemati, G. Bastien and M. Dagenais, "Low Overhead Hardware-Assisted Virtual Machine Analysis and Profiling," 2016 IEEE Globecom Workshops (GC Wkshps), Washington, DC, 2016, pp. 1-6. doi: 10.1109/GLOCOMW.2016.7848953 5. H. Nemati and M. R. Dagenais, "Virtual CPU State Detection and Execution Flow
Analysis by Host Tracing," 2016 IEEE International Conferences on Big Data and Cloud Computing (BDCloud), Social Computing and Networking (SocialCom), Sustainable Computing and Communications (SustainCom) (BDCloud-SocialCom-SustainCom), Atlanta, GA, 2016, pp. 7-14. doi: 10.1109/BDCloud-SocialCom-SustainCom.2016.13 6. Hani Nemati, Seyed Vahid Azhari, and M. R. Dagenais "Host Hypervisor Trace Mining
for Virtual Machine Workload Characterization," IEEE International Conference on Cloud Engineering (IC2E), Prague, 2019.
CHAPTER 2 LITERATURE REVIEW
Cloud computing became a recent revolutionary technology because it reduces the compa-nies IT costs by cutting down both capital and operating costs using resource sharing. It also offers scalability to the businesses by scaling up or scaling down its existing resources to accommodate business changes and requirements. Unfortunately, identifying and trou-bleshooting VM performance degradations, capacity requirements, and configuration issues can be challenging and time-consuming, as performance issues can originate from any num-ber of root causes. This survey explores interesting techniques for analyzing, monitoring, debugging, and troubleshooting virtual environments.
This chapter delves into available strategies, tools and methods for analysis, troubleshooting and debugging virtual machines. First, we categorize the existing techniques into two major classes: 1) agent-based techniques, and 2) agent-less techniques. In agent-based techniques, an agent (small executable) will be installed on VMs to monitor the service. On the other hand, agent-less techniques limit their data collection to the physical host level, without internal access to the VMs. Both agent-based and agent-less monitoring techniques have advantages and disadvantages which will be covered in different subsections. We further cat-egorize the existing techniques based on the technology behind data collection (e,g,. Logging, tracing, etc.).
The rest of this chapter is organized as follows: the first section presents some common definitions and terminology, in the world of virtual machines, along with background infor-mation about virtualization technology, cloud architectures, nested VMs, and monitoring system components. Follows an overview of interesting tracers and tools. Finally, subsection 2.5 presents the state of the art for commercial and academic analyzers for VMs.
2.1 Background Information
Our aim in this section is to describe some common definitions and terminology in the world of virtual machine analysis. This section is essential for understanding the rest of the survey.
2.1.1 Cloud Computing
Cloud Computing refers to a service model in which the services can be delivered to users, ir-respective of how or where. It is a parallel and distributed system that uses virtual computing resources to provide services for users based on a service level agreement. We will elaborate more on virtualization technology in subsection 2.1.4. The virtual computing resource pool can be reconfigured according to the traffic load and even the users location. Cloud Com-puting is a combination of several concepts like Internet delivery, Pay-per-Use-On-Demand utility computing, virtualization, grid computing, distributed computing, storage elasticity, content outsourcing, and Web 2.0. Based on the definition of Cloud Computing by the U.S. National Institute of Standards and Technology (NIST), a cloud model is composed of five essential characteristics, three service models, and four deployment models [7].
2.1.2 Cloud Service Models
Cloud computing can be divided into three layers, based on the definition of cloud computing by NIST [7]. These service models will be examined in the subsequent subsections.
Infrastructure as a Service (IaaS): The Cloud Provider offers fundamental com-puting resources (e.g., processor, storage and networks) where the customer has the ability to create and run arbitrary operating systems and applications. The customer is not a manager of physical resources but has control over operating systems, storage, and deployed applications. IaaS can attract enterprise and individual users by offering different billing methods and services to meet the needs of customers. Some powerful IaaS companies are Amazon Web Services, Bluelock, SCS and IBM [8].
Platform as a Service (PaaS): PaaS is a complete virtual platform, onto which developers can login from different terminals. The developers use pre-installed pro-gramming languages, libraries, and tools to develop their applications (e.g. custom cloud hosting apps). The PaaS users do not have access to physical resources, and the underlying infrastructure. Examples of PaaS providers are OpenShift, Microsoft Azure, Google App engine and IBM Smart Cloud [9].
Software as a Service (SaaS): SaaS is an application driven model that enables on-demand availability of software over the internet. It can provide many different applications in the cloud; the underlying cloud infrastructure is transparent to the customers. SaaS is also called Application as a Service (AaaS). Examples of SaaS providers include CVM solutions, Gageln, Knowledge tree and LiveOps [10].
2.1.3 Essential characteristics of Cloud Computing
Five essential characteristics of cloud computing are described below [11] [12] [13]:
On-demand self-service: The customer can select and change the computing capa-bilities without requiring human intervention.
Broad network access: Users can access a cloud system over the network, through standard mechanisms from any physical platform.
Resource pooling: The computing resources are assigned to customers using a multi-tenant model. The users are not aware of the resource location but may have the ability to specify the location at a higher level of abstraction (e.g., state or country).
Rapid elasticity: Capabilities should be able to scale outward and inward, based on traffic load, needed QoS and SLA.
Measured Service: The cloud system should be equipped with an analysis tool to automatically control and optimize resource usage. Furthermore, the analysis tool should send reports to both the provider and consumer of the service.
2.1.4 Virtualization Technology
The concept of virtualization was introduced by IBM in early 1970s, when they were working on developing time-sharing solutions for the mainframes [14]. The basic idea of time-sharing is sharing computing resources among many users by applying multitasking. Multiple tasks, also known as processes, share common processing resources such as a CPU, aiming to in-crease the utilization of computers. By introducing this technology, the illusion of parallelism is achieved and the cost (time and money) of using a computer is reduced significantly. The advantages behind the time-sharing technology were sufficient for driving the development of virtualization in industry. Nowadays, servers are equipped with powerful processors, high capacity hard drives, a large amount of memory and I/Os, that may often remain idle. The best way to increase resource utilization is using virtualization. Virtualization enables the
physical machine to run one or more virtual machines at same time. A virtual machine (VM) is a software implementation of a machine (e.g., a computer) that executes programs, just like a physical machine [15].
Modern Intel x86 (Intel-VT) and AMD CPU cores support a specific VM instruction set in order to allow multiple operating systems (OSs) to share the physical CPU in a safe and efficient manner. Intel named its VM instruction set as Virtual Machine eXtensions (VMX) while AMD called it the Secure Virtual Machine (SVM). There are two VMX operating modes: VMX root and VMX non-root. In VMX root operation, the Virtual Machine Monitor (VMM) or Hypervisor is executed. In the VMX non-root mode, the guest software is run. An Hypervisor is an essential component of the virtualization stack, that creates a platform to run a pool of VMs on top of a physical machine. Hypervisors are classified as native and hosted [16]. The native hypervisor is an operating system that runs directly on a physical machine to control and monitor the VMs. The hosted hypervisor is designed to run on top of another operating system. It is developed to add a distinct software layer on top of the operating system. For example, Xen and VMWare ESX are native hypervisors, and Virtu-alBox and VMWare workstation are hosted hypervisors. Figure 2.1 depicts the architecture of native VMs on top of a native hypervisor.
Figure 2.1 Architecture of a native hypervisor
A hypervisor is a VM manager which creates and manages the VMs. VMs that run on top of native hypervisors may perform better, since the VM code executes directly on a physical CPU (pCPU). On the other hand, an ideal hypervisor is just an accelerator focusing on the CPU. Therefore, another component is needed to manage other hardware such as I/O
peripherals, which is achieved with an userspace application. For example, in Linux, the Kernel based Virtual Machine (KVM) acts as a native hypervisor to run VMs, and Qemu acts as an userspace application to emulate other hardware. Figure 2.2 shows the architecture of a Qemu/KVM VM.
Figure 2.2 Architecture of Qemu/KVM
2.1.5 VM and Nested VM instruction set
As mentioned in subsection 2.1.4, Intel and AMD support special instruction sets for their vir-tualization technology. In this subsection, we elaborate more on VMX, the Virtual-Machine Control Structure (VMCS) and interrupt handling for VMs and Nested VMs.
VMX operations are divided into two main categories. In the VMX root mode, the hypervisor is executed and in the VMX non-root more, the guest software is run. Correspondingly, there are two kinds of transitions. VM Entry is the transition from VMX root mode to VMX non-root mode (from hypervisor mode to guest mode). In the guest mode, non-privileged instructions of VMs are executed as non-root mode. Executing privileged instructions in guest mode causes an exit to the hypervisor mode. VMX Exit is the transition from VMX non-root mode to VMX root mode. The hypervisor handles the privileged instruction and the enters to guest mode. In each transition, the environment specifications of the VMs and hypervisor are stored in a structure in memory named Virtual Machine Control Structure (VMCS) [17]. The hypervisor stores and retrieves the VM information using the VMREAD, VMWRITE, and VMCLEAR instructions [17].
The challenge of monitoring VMs increases significantly when VMs may run a nested hyper-visor (Nested VM). A nested VM is a guest that runs inside another VM, on top of two or more hypevisors [18]. The IaaS provider scheme enables the cloud user to manage and use
his own hypervisor as VM. However, the diagnosis of any latency or response time problem in Nested VMs is quite complex, due to the different levels of code execution.
Hardware
Host Hypervisor
Virtual
Machine
App
App
App
App
Virtual Machine
VM Hypervisor
Nested
VM
Nested
VM
L2 L2 L1 L0V
M
C
S
1→ 2V
M
C
S
01→VM
C
S
0→2V
M
C
S
01→Figure 2.3 One-Level Nested VM Architecture for VMX
Nested VMs add new challenges for CPU, I/O and memory virtualization. New processors from Intel and AMD support Nested VMs. Figure 4.2 shows a single-level architecture for nested VMs. In a single-level architecture, executing any privileged instruction, from any level of nested VMs, returns to the host hypervisor (L0). In this case, the VM hypervisor
(L1) has the illusion of running the code of the nested VM (L2) directly on the physical CPU.
However, privileged instructions of nested VMs should be handled by the highest privileged level. Since L1 is not the highest privileged level, L0 handles it. As a result, whenever any
hypervisor level or VM executes privileged instructions, the L0trap handler is executed. This
VMX emulation can go to any level of nesting.
Usually, there is one VMCS for each vCPU (V M CS01). However, for one level of nested
VMs, there are three VMCSes per vCPU. The VM hypervisor uses V M CS12 to contain the
environment specifications of nested VMs. As we mentioned before, the code of nested VMs can be executed directly on the host hypervisor. In this case, the host hypervisor prepares
V M CS02 to save and to store the state of nested VMs at each VM exit and VM entry.
Moreover, the host hypervisor creates V M CS01 to execute the code of the VM hypervisor.
From the host perspective, V M CS12 is not valid, but the host hypervisor benefits from that
to update some fields in V M CS02 for each VMX transition.
AMD and Intel implement additional hardware support for virtualized MMUs in normal VMs called Nested Page Tables (NPT) and Extended Page Table (EPT), respectively. For memory
virtualization, nested VMs add another level of address translation that is not implemented in hardware. KVM and other existing hypervisors handle Nested VM memory management in software.
For I/O virtualization, Nested VMs can access I/O directly or by emulation. In the case direct access, it has near-native performance. With emulation, the performance is not as good as direct access, but any I/O device can be emulated in nested VMs [19].
Contemporary use of nested VMs is more for the purpose of software scaling, compatibility, and security. In addition, many network services can be virtualized (a main goal of NFV) and hosted on nested VMs. Software as a Service (SaaS) providers are the best clients of nested virtualization. SaaS providers can encapsulate their software in a nested VM on an existing cloud infrastructure (e.g, Google Cloud and Amazon AWS). Ravello [20] [21] has implemented a high performance nested virtualization called as HVX. It allows the user to run unmodified nested VMs on Google cloud and Amazon AWS, without any change. Nested virtualization is also used for Continuous Integration (CI). CI integrates code, builds modules and runs tests when they are added to the larger code base. Because of security and compatibility issues, the building and testing phases should be run in an isolated environment. CI service providers can execute each change immediately in a nested VM.
McAfee Deep Defender [22] is another example of nested VM use. For security reasons, it has its own VMM. CloudVisor [?] also propose a method to protect VMs using nested virtualization. This tiny nested VM provides security monitoring and protection to the hosted VMs. Furthermore, one of the features in Windows 7, in the professional and ultimate editions, is the XP mode [23]. In this mode, a VM runs Windows XP for compatibility reasons. Thus, Windows 7 users can execute Windows XP applications without any change. Correspondingly, the XP mode will be run in a nested VM if Windows 7 is running in a VM.
2.2 Cloud Analysis tools: The Need
A mentioned in subsection 2.1.3, cloud computing has several essential characteristics. In order insure that these characteristics are being satisfied, an analysis tool is necessary. Here are some of the important requirements to analyze VMs:
Failure Detection: Fault in cloud computing may happen in many ways, such as a natural disaster, a hardware problem, or a software bug. One of the main goals in cloud computing is to enable reliable and resilient services. Migration of VM instances is the key to have a well balanced and failure free environment. In this case an analysis tool should predict the failure of a VM instance and prepare a migration destination. As a result, by continuously analyzing and detecting failure causes, a cloud provider could offer a failure-free environment. Another approach is to have a self-healing mechanism to detect the root cause of a problem in the system and fix it. All of these approaches need a proper analysis tool.
Resource Management: In a single domain and single user system, a designer could evaluate workload bottlenecks and identify overload situations. Since the Cloud envi-ronment consists of thousands of VM instances, sharing resources, resource manage-ment is more sophisticated. By contrast, the workload of VM instances can vary in many situations. Therefore, cloud providers need to use a resource management sys-tem that continuously keeps track of resource status, in different virtualization layers. The resource management system should monitor, analyze, and predict future resource demands for each VM instance.
Application Design: Writing cloud-friendly applications is an important aspect that should be considered when the application runs in a virtualized environment. Applica-tions that execute many privileged instrucApplica-tions can reduce the performance and cause a high overhead. Programmers can examine their application, using different tracing techniques, to analyze the performance application executions.
Cost reduction: Sharing resources plays an important role in efficient resource usage and reducing operational costs. Moreover, the most important motivation of infrastruc-ture providers is maximizing profit by leveraging their resources for delivering service to thousands of cloud users. In order to maximizing profit, cloud providers uses an analysis tool to measure and forecast the sufficient level of resources required for each VM instance.
Accounting and Billing: Cloud providers charge customers following a model called Pay as Use (PaU). In this case, it is important to monitor the resource usage of each instance for accounting and billing. A monitoring tool is important for both the cus-tomer and cloud provider, since in case of SLA violations, the cloud provider should pay back money as a penalty.
SLA Management: Since cloud computing offers a Pay as Use model, the customers may define some expectations for the services delivered by cloud providers. A Service Level Agreement (SLA) is a well-defined agreement between the user and provider. If the SLA with a customer is violated, there is the possibility of a penalty and customer dissatisfaction. There are different strategies being used to reduce SLA violations, like SLA-based scheduling policies, and SLA-based resource allocators. In all these strategies, the cloud provider needs to implement a cloud analysis tool to measure different Key Performance Indicators (KPI). This analysis tool needs to keep track of each defined SLA clause precisely.
2.3 Cloud Analysis tool: Properties
Many tracing and analysis tools have been used for monitoring the performance of processes, the OS, and whole systems. Most of these tools deal with a single system in a single domain. By introducing multi-domain and multi-layer distributed systems, these tools need to evolve to capture the new systems characteristics. In order to satisfy all the requirements of a system, it is necessary to analyze the system from different angles. In this subsection, some important capabilities and features of a suitable analysis tool are described as follows:
Available: It is important to insure that the analysis system itself is fully functional. This may be achieved by checking the result of system analysis. Log aggregation tools may also be used to trace across multiple systems [24].
Open-source: the cloud infrastructure and cloud software management are contin-uously changing and expanding. Therefore, the analysis tool needs to be adaptable. There are presently numerous cloud analysis tools which are closed-source, and infor-mation about how they monitor virtual hardware is a secret. The analysis tools in this category cannot adapt themselves at the rapid pace of technological changes, and cover a smaller scope of features and abilities [25]. In contrast, opensource analysis tools are extensible. Anyone can inspect, modify, and enhance them [26].
Resolution: Sometimes, to find some serious faults in a cloud setup, the analysis tool may need to provide high resolution results. For instance, in such a high resolution analysis tool, each event should have nanosecond precision timestamps.
Multi-Layer: The cloud is a multi-layered distributed system that can be modelled in 6 different layers: Guest Application, Guest Operating System, user-space VMM, kernel-space VMM, Host Operating System, Host Hardware. Analyzing each layer individually may not reveal important information about problems of cloud tenants. The cloud analysis tool should be able to trace and analyze most layers at the same time.
Scalable: Nodes in a cloud environment are distributed within a wide area. The analysis tool should be scalable and distributed to gather data from each node and each host.
Dynamic: An analysis tool should be dynamic in the sense that it deals with a chang-ing virtual environment. Static analysis tools cope with a specific system, where all the
statically inserted probes gather information from the system. Dynamic analysis tools may add probes and can filter events at run-time.
Accurate: Accuracy is important for the cloud environment, since cloud computing offers to the end user the ability of accessing a pool of resources with the PaU model. To provide better QoS, an SLA is agreed upon by both the cloud provider and the customer, and the cloud provider has to pay penalties, in case of SLA violations. Therefore, it is vital for the analysis tool to provide accurate information. The Analysis tool could gather sampled data. To collect relevant data, there is trade-off between accuracy and sampling frequency. The sampling frequency could be as small as each event, in which case it becomes event-based data. We elaborate more on sampling-based and event-based data gathering in subsection 2.4.1
Adaptive: Cloud computing offers a variety of services to the end-user. Given the large number of customers with different levels of satisfaction, the analysis tool should adapt itself to each service configuration and provide suitable reports .
Portable: An analysis tool should perform in any environment regardless of its plat-form. It is necessary since the analysis tool copes with wide penetration across federated cloud.
Robust: It is important for an analysis tool to cope with errors and new situations while continuing its operation. This is more critical since it should monitor a multi-tenant environment where a fault in one virtual environment could have a devastating effect on the whole system.
Overhead: The analysis tool should add a low overhead. For instance, if there are one thousand nodes and if the analysis tool adds just 1% overhead, the cloud provider needs 10 extra CPUs to handle the data gathering load for the analysis tool.
2.4 Monitoring System Architecture
A monitor is a system that observes the behaviour of a target system to reach a decision about correctness. Figure 2.4 represents different components of a monitoring system. It has five different components: Aggregator, Analysis component, Visualization component, Alert and Tuning system. The data provider represents the technical means to explore the system state and its changes. The aggragator component gathers data and sends it to the analysis component. The analysis component processes the data and extracts meaningful information to represent the performance of a target system. The analyzed data is sent to the visualization component. Then, the visualization component generates several views for system administrators and clients. It also could trigger an alert and send it to the tuning component to enforce an action. In the following subsection, we elaborate more on the technology behind the data provider.
Figure 2.4 A monitoring system and its components
2.4.1 Technology behind data providers
As Figure 2.4 shows, the first step to monitor a system is the data provider. Time-based and Event-based measurements are two techniques for collecting data. In Time-base measure-ments, all the metrics are captured at a constant interval. Granularity and quality of metrics collection are dependent on time intervals. Longer time intervals might not be acceptable to reveal errors and problems, but add less overhead. In contrast, using short time inter-vals adds more overhead. The advantage of Time-based measurements is that the sample rate can be controlled to adjust the overhead. In Event-based measurements, an event with time-stamp is generated when the tracer encounters an enabled event. This method gives the highest granularity and quality for collecting metrics. Furthermore, modern tracers require little overhead and thus can be used in production environments. In this subsection, different
technologies behind data providers are studied.
2.4.1.1 Logging
In computing, instrumentation is a code section that is added to any part of a target system to gather information about the execution. A log entry is a message from the Operating System or application code to indicate the occurrence of an event. A log entry has a body, content and time, and is written to a logfile. It is used for statistical analysis and reporting. Logging systems are not efficient for high frequency events, and it is better to use other kinds of data providers (e,g,. tracing). For example, Amazon Web Service (AWS) uses coarse-grained log monitoring techniques [27] for the horizontal scaling of its instances.
2.4.1.2 Debugging
Debugging is mainly used in software development for locating and correcting code errors. It is also part of the software testing process. One of the most common program debugging technique is printf to display the value of variables. GDB is a common debugger in Linux [28], which uses the ptrace system call to interact with the process being debugged.
2.4.1.3 Tracing
Tracing is a very fast system-wide logging mechanism. Tracing usually involves inserting a special instruction or sequence of instructions (instrumenting), named a tracepoint, in the code. Instrumentation can happen either at run time or compile time. Instrumentation at run time is called dynamic binary instrumentation, and instrumentation at compile time is called static instrumentation. In the case of static instrumentation, there is an extra recompilation time and the need for restarting the application [29]. It also needs the source code of the application. In contrast, for dynamic instrumentation, code is injected without the knowledge of the application source code at run-time [30]. The tracepoint may simply call a user-defined hook, or call a function that is part of the kernel tracing infrastructure. Tracing can be divided into hardware and software traces, based on the origin of the event. In modern CPUs, there is the capability of recording a complete trace of the instructions executed. For example, Intel Processor Trace (Intel-PT) traces every branch, in order to record enough information to reconstruct the whole sequence of instructions executed. After recording the trace, it merges the recorded trace with the program binary to generate the execution flow of the program execution. As a result, it does not need to record each and every instruction execution [31]. In software tracing, all the tracepoints are in the program
code, and no special hardware is used to generate trace. Tracepoints are divided into static and dynamic instrumentation, based on how they are added to the code. In order to add a static tracepoint, the source code of program is needed and a recompilation is required. With dynamic instrumentation, the tracepoint is added directly into a running process, possibly using the debugging information generated at compilation time.
Tracing can also be divided into user-space and kernel tracing. In user-space tracing, the events are collected from user-space (the application code). In kernel tracing, events are generated by the operating system executable, the user application does not need to be in-strumented. For example, Linux uses the TRACE_EVENT macro to provide static tracepoints. The tracer can hook a function to these tracepoints and collect events. It provides infor-mation about the operating system internals (e.g. thread scheduling, interrupts) and all the interactions between processes and the operating system (e.g. system calls) but little information about the internal logic of applications.
2.4.1.4 Sampling
Sampling consists in interrupting an unmodified application to sample some value (e.g. cur-rent executing address, curcur-rent stack, number of allocated bytes). The sample rate should be controlled since it determines the overhead and accuracy trade-off. Most modern CPUs provide embedded performance counters like the number of cache faults at each cache level, the number of branch stalls and a large number of other metrics. OProfile [32] and Perf [33] are some performance analysis tools which use performance counter sampling.
While sampling-based tools are very useful to measure the average performance with a low overhead, event-based tools like tracers are more interesting for debugging specific problems. Indeed, you can follow the detailed trace of events leading to the problem. Therefore, being interested in debugging problems in layered cloud architectures, we focus here on tracing tools which are studied in the next subsection.
2.4.2 The aggegator component: Tracing and Profiling Tools
In this subsection, we study different available tracing tools. Tracing tools provide different techniques to aggregate data from the target system. Moreover, some tracing tools implement basic analyses to send to the visualization component.
Table 2.1 Available Kernel Tracepoints and their type
Types Family Events
Virtual Machine
Processor
kvm_set_irq, kvm_ioapic_set_irq,kvm_msi_set_irq, kvm_ack_irq, kvm_mmio,kvm_fpu, kvm_entry, kvm_exit,kvm_hypercall, kvm_hv_hypercall, kvm_pi, kvm_cpuid , kvm_apic,kvm_inj_*,
kvm_apic_accept_irq, kvm_msr,kvm_pic_set_irq, kvm_apic_ipi„, kvm_eoi, kvm_pv_eoi,kvm_nested_*, kvm_emulate_insn„kvm_write_tsc_offset,
kvm_update_master_clock,kvm_track_ts , kvm_apic_accept_irq
Memory kvm_age_page, kvm_try_async_get_page, kvm_async_*, kvm_page_fault, kvm_mmu_*
Host
OS module_*, printk_console, random_*, rcu_utilization, regulator_*, gpio_*, sched_*, signal_*, workqueue_* Processor power_*, irq_*, timer_*
Memory kmem_*, mm_*
Disk block_*, jbd2_*, scsi_*
Network napi_poll, net_*, skb_*, sock_*, rpc_*, udp_fail_queue_rcv_skb Graphics asoc_snd_*, v4l2
2.4.2.1 LTTng
The Linux Trace Toolkit next generation (LTTng) is designed to offer very low overhead kernel and user-space tracing [34]. It implements a very fast lock-free, wait-free read-copy-update (RCU) buffer to store data and eventually copy it on disk. A very low overhead, which remains almost constant when the number of parallel cores increases, because of per-core buffers, makes LTTng the default tool for tracing real-time application in Linux. LTTng supports both static and dynamic tracing. It can add dynamic tracepoints with Kprobe. In addition, static tracepoints can be added in the source code of the kernel, as well as in user-space programs with UST. LTTng also provides hooks to the TRACE_EVENT macro for kernel events. LTTng exports the events in the Common Trace Format (CTF) to be written on disk [35].
Figure 2.5 shows the different components in LTTng and how they interact with application and the Linux kernel. The most important component is the session daemon. It is responsible for managing and controlling the other components. The LTTng kernel modules include: a set of probes to be attached to Linux kernel tracepoints and to the entry and exit of system calls. The Ring buffer module is an implementation of a ring buffer where the consumer daemon reads events. The LTTng Consumer daemon shares the ring buffer between user-space and
kernel-space to collect kernel trace data and copy it to disk. In [36], the authors provide a map between kernel tracepoints and their system activity on the host. The extended version of mapping between kernel tracepoints and their types, for both host and kernel, is depicted in Table 2.1
Figure 2.5 LTTng components and their tracing path [3]
LTTng is currently the fastest kernel/user-space tracing toolkit for Linux [37]. The major factor for such improvement is its lock-free implementation of the LTTng ring buffer.
2.4.2.2 Perf
Perf is a monitoring tool inside the Linux kernel mostly used for sampling and profiling. Perf can access and gather data from the hardware Performance Monitoring Unit (PMU), like cache misses in different levels, miss branch predictions, TLB hits, and so on. Perf can hook to TRACE_EVENT macros in the kernel and save events at run-time in the perf ring-buffer.
2.4.2.3 Ftrace
Ftrace is an older tracer included in the Linux kernel that allows function tracing, system calls tracing, dynamic instrumentation and so on. It provide function graphs that show the entry and exit of all functions at the kernel level. It supports Kprobe for dynamic instrumentation and provides hooks to the TRACE_EVENT infrastructure. It keeps the events in memory and does not write them to disk automatically. In Ftrace, the size of a payload is limited to the size of a page. The ring buffer is implemented as a linked list and a buffer page can be read once it is full.
2.4.2.4 SystemTap
SystemTap is a tracing tool which allows inserting tracepoints dynamically, as well as col-lecting events from tracepoints defined using the TRACE_EVENT macro [38]. It is similar to Ktap, the tracing code is written as a script. The scripts are written in the SystemTap language, highly similar to the C language. These scripts are converted into C code, and then are inserted into the Linux kernel as a module. Kprobe is used to insert dynamically tracepoints into the Linux kernel. This approach, similar to Dtrace on Solaris [39], is very flexible. However, SystemTap has serious performance issues especially for collecting trace events [37]. Furthermore, its dynamic instrumentation is trap based, which adds numerous context switches.
2.4.2.5 eBPF
The newest entrant in the long list of available tracers is the Extended Berkeley Packet Filter (eBPF). BPF, which was in older Linux kernels, has been enhanced and became eBPF in the Linux 4.x series kernels. eBPF allows to do much more than just packet filtering in BPF. It enables the user to write any program and to insert it into any location in the kernel using Kprobe. It can also attach probes to available static tracepoints in the Linux kernel. eBPF scripts are compiled at runtime and executed on the small BPF VM. eBPF can now be used as a tracer, much like SystemTap or Dtrace, since it can aggregate events, analyze them, and store them in a trace. It uses the perf buffer to save events in memory and can store them as CTF events on disk. eBPF is a great tool for aggregation and live monitoring. Although an elaborate, feature-rich and easy to use tool, eBPF is still under development and does not offer the same performance, maturity and features as LTTng. Figure 2.6 depicts eBPF tc hooks, that first compile the program with LLVM and then inject it into the kernel using the bpf syscall. After the injection into the kernel, the kernel verifier checks the script for
tc LLVM/clang cls_bpf Userspace Kernel C source code bpf_prog.c ELF-compiled BPF bpf_prog.o Network stack tc ingress tc egress
Net device Net device
bpf() syscall
JIT
Packets
User program
Maps
Figure 2.6 eBPF architecture for tc interface [4]
safety, attaches it to the traffic controller interface and runs it in a small VM.
2.4.2.6 Performance and Evaluation
In this project, we used LTTng since it is a system-wide and very fast tracer [37] [40]. It also provides unified kernel and user-space tracing, which is very useful in our project. LTTng can gather KVM tracepoints (Kernel tracepoints) as well as Qemu tracepoints (User-space tracepoints).