HAL Id: hal-00327952
https://hal.archives-ouvertes.fr/hal-00327952
Submitted on 29 Jul 2005HAL is a multi-disciplinary open access
archive for the deposit and dissemination of sci-entific research documents, whether they are pub-lished or not. The documents may come from teaching and research institutions in France or abroad, or from public or private research centers.
L’archive ouverte pluridisciplinaire HAL, est destinée au dépôt et à la diffusion de documents scientifiques de niveau recherche, publiés ou non, émanant des établissements d’enseignement et de recherche français ou étrangers, des laboratoires publics ou privés.
Mid-latitude Tropospheric Ozone Columns from the
MOZAIC program: climatology and interannual
variability
R. M. Zbinden, Jean-Pierre Cammas, V. Thouret, P. Nedelec, F. Karcher, P.
Simon
To cite this version:
R. M. Zbinden, Jean-Pierre Cammas, V. Thouret, P. Nedelec, F. Karcher, et al.. Mid-latitude Tropo-spheric Ozone Columns from the MOZAIC program: climatology and interannual variability. Atmo-spheric Chemistry and Physics Discussions, European Geosciences Union, 2005, 5 (4), pp.5489-5540. �hal-00327952�
ACPD
5, 5489–5540, 2005 Tropospheric Ozone Columns from MOZAIC R. M. Zbinden et al. Title Page Abstract Introduction Conclusions References Tables Figures J I J I Back CloseFull Screen / Esc
Print Version Interactive Discussion
EGU Atmos. Chem. Phys. Discuss., 5, 5489–5540, 2005
www.atmos-chem-phys.org/acpd/5/5489/ SRef-ID: 1680-7375/acpd/2005-5-5489 European Geosciences Union
Atmospheric Chemistry and Physics Discussions
Mid-latitude Tropospheric Ozone
Columns from the MOZAIC program:
climatology and interannual variability
R. M. Zbinden1, J.-P. Cammas1, V. Thouret1, P. Nedelec1, F. Karcher2, and P. Simon21
Laboratoire d’Aerologie, UMR5560, Toulouse, France 2
CNRM, Meteo-France, Toulouse, France
Received: 21 February 2005 – Accepted: 4 April 2005 – Published: 29 July 2005 Correspondence to: R. M. Zbinden ([email protected])
ACPD
5, 5489–5540, 2005 Tropospheric Ozone Columns from MOZAIC R. M. Zbinden et al. Title Page Abstract Introduction Conclusions References Tables Figures J I J I Back CloseFull Screen / Esc
Print Version Interactive Discussion
EGU
Abstract
Several thousands ozone vertical profiles collected in the course of the MOZAIC pro-gram (Measurements of Ozone, Water Vapour, Carbon Monoxide and Nitrogen Oxides by In-Service Airbus Aircraft) from August 1994 to February 2002 are investigated to bring out climatological and interannual variability aspects. The study is centred on
5
the most frequently visited MOZAIC airports, i.e. Frankfurt (Germany), Paris (France), New York (USA) and the cluster of Tokyo, Nagoya and Osaka (Japan). The analysis fo-cuses on the vertical integration of ozone from the ground to the dynamical tropopause and the vertical integration of stratospheric-origin ozone throughout the troposphere. The characteristics of the MOZAIC profiles, frequency of flights, accuracy, precision,
10
and depth of the troposphere observed, are presented. The climatological analysis shows that the Tropospheric Ozone Column (T OC) seasonal cycle ranges from a min-imum wintertime at all four stations to a spring-summer maxmin-imum in Frankfurt, Paris, and New York. Over Japan, the maximum occurs in spring because of the earlier springtime sun. The invasion of monsoon air masses in the boundary layer and in
15
the mid-troposphere then steeply diminishes the summertime value. Boundary layer contributions to the T OC are 10% higher in New York compare to Frankfurt and Paris during spring and summer, and are 10% higher in Japan compare to New York, Frank-furt and Paris during autumn and early spring. Local and remote anthropogenic emis-sions as well as biomass burning over upstream regions of Asia may be responsible
20
of larger low- and mid-tropospheric contributions to the tropospheric ozone column over Japan throughout the year except during the summer-monsoon season. A sim-ple Lagrangian analysis has shown that a minimum range of 10% of the T OC is of stratospheric-origin throughout the year. The investigation on the short-term trends of the T OC over the period 1995–2001 shows a linear increase of 0.7%/year in Frankfurt,
25
0.8%/year in Japan, 0.9%/year in Paris, and 1.1%/year in New York. Essential ingre-dients to these positive short-term trends are the continuous increase of wintertime tropospheric ozone columns from 1996 to 1999 and the positive contributions of the
ACPD
5, 5489–5540, 2005 Tropospheric Ozone Columns from MOZAIC R. M. Zbinden et al. Title Page Abstract Introduction Conclusions References Tables Figures J I J I Back CloseFull Screen / Esc
Print Version Interactive Discussion
EGU mid-troposphere whatever the season.
1. Introduction
Tropospheric ozone is a trace gas with a large natural variability in space and time and a mixing ratio in the range of about 10–100 ppbv. The origin of tropospheric ozone is either in-situ photochemical production or ozone flux transported from the
5
stratosphere. Listed as a pollutant with regard to human health and plants, tropo-spheric ozone is a by-product of the photo-oxidation of hydrocarbons. For many years, photochemical air pollution was considered as a problem of mainly local or regional significance, somewhat affecting clean air sites by the advection of polluted urban plumes that spread over the countryside. It was discovered later on that smog-like
10
reactions associated with the oxidation of methane and other hydrocarbons induce the photochemical production of ozone also in the unpolluted troposphere (Crutzen, 1973, 1974). The role of photochemistry in controlling the tropospheric ozone was therefore questioned (Chameides and Walker, 1973, 1976). The controversy that arose from proponents of a tropospheric ozone budget dominated by stratospheric-origin
down-15
ward transport (Fabian, 1974; Chatfield and Harrison, 1976) was anchored in the in-capability to clarify which of the stratospheric flux or the photochemical production may be responsible of the spring-summer lower tropospheric ozone maximum. The quantitative assessment of the cross-tropopause exchanges fluxes of mass, ozone and other chemical constituents is of major importance for atmospheric chemistry and
20
climate. Regener (1957) and Junge (1962) considered the stratosphere to be the main source from which ozone enters the troposphere via tropopause exchange processes. Ozone is transported from the lower stratosphere into the upper troposphere through tropopause folding (Danielsen et al., 1968, 1987) and exchanged with the troposphere via diabatic processes and turbulent diffusion (Lamarque and Hess, 1994), mixing
pro-25
cesses and convective erosion during the breakup of stratospheric filaments (Appen-zeller et al., 1996; Gouget et al., 2000). Climatological global-scale studies based
ACPD
5, 5489–5540, 2005 Tropospheric Ozone Columns from MOZAIC R. M. Zbinden et al. Title Page Abstract Introduction Conclusions References Tables Figures J I J I Back CloseFull Screen / Esc
Print Version Interactive Discussion
EGU on trajectory calculations and operational analysis data have been developed in the
last years. The principle is to identify exchange events with the time traces of poten-tial vorticity along a large set of trajectories. Wernli and Bourqui (2002) introduce a residence time criterion that serves to distinguish transient and irreversible exchange events, the former only influencing the layers near the tropopause, the latter having
5
the potential to contribute to the tropospheric ozone budget. Applied on one year of operational analyses, the methodology shows that the seasonal cycle of the hemi-spherically integrated net exchange mass flux is downwards in the extratropics with a maximum (minimum) in winter-spring (autumn). In contrast to the net exchange, previous authors identify a symmetric two-way exchange that has almost no seasonal
10
variation and a larger amplitude than the net exchange, and is strongly sensitive to the residence time. In conclusion of recent Lagrangian studies, Stohl et al. (2003) insist on the importance of separating deep stratosphere-troposphere transport from shallow stratosphere-troposphere transport, the former stream contributing to 5% of the tropospheric mass when the residence time criterion is 4 days. Deep
stratosphere-15
troposphere transport has a winter maximum mainly near the Atlantic and Pacific storm track entrance and exit regions, which is, according to the previous authors, an indica-tion that they are not the cause of the late springtime maximum of ozone in the lower troposphere. Shallow stratosphere-troposphere transport has a weak amplitude sea-sonal cycle. With regard to long-lasting ozone measurements in Europe, it was found
20
that the concentration of ozone has been increased not only in the air near the Earth’s surface (Feister and Warmbt, 1987; Volz and Klein, 1998), but also in the free tropo-sphere (Staehelin and Schmid, 1991; Staehelin et al., 1994; Marenco et al., 1994). These results have been taken as an evidence for an increase in the photochemical production of ozone in the atmosphere due to the growing emissions of ozone
pre-25
cursors. In the troposphere over Europe, longest data time series with ozonesondes began in the 1960s at Hohenpeissenberg (Germany) and Payerne (Switzerland). Sta-tistical studies for tropospheric long-term trends applied on this dataset have shown a large increase of tropospheric ozone (in the range of 0.7–1.4%/year) since the
be-ACPD
5, 5489–5540, 2005 Tropospheric Ozone Columns from MOZAIC R. M. Zbinden et al. Title Page Abstract Introduction Conclusions References Tables Figures J I J I Back CloseFull Screen / Esc
Print Version Interactive Discussion
EGU ginning of the 1970s (Logan, 1985; Tia et al., 1986; Staehelin and Schmid, 1991;
Harris et al., 1997; Oltmans et al., 1998; Logan, 1994; Weiss et al., 2001). With re-gard to the UTLS region, Tarasick et al. (2005) compare overall linear trends for the 1980–2001 and 1991–2001 periods with Canadian ozonesondes data and show that negative trends for the former period have rebounded to positive trends in the latter
5
period at all levels below 63 hPa without changes in tropopause height.
Therefore, the global distribution and trends of ozone in the troposphere remains a major focus of interest. Comprehensive and continuous observations are needed to contribute to the assessment of its role in the climate change. A major impediment to make progress on the previous issues is related to the deficiencies in the network of
10
tropospheric ozone observations. Balloon-sounding stations are sparse and operate weekly. Research aircraft provide limited datasets in process-oriented experiments. The first faltering steps of satellite retrieval techniques in the upper troposphere and lower stratosphere (UTLS) domain are still not quantitative enough. One of the largest ozone databases existing today comes from the MOZAIC program (Measurements
15
of Ozone, Water Vapor, Carbon Monoxide and Nitrogen Oxides by In-service Airbus Aircraft, Marenco et al., 1998, http://www.aero.obs-mip.fr/mozaic/). Using automatic equipment installed on board five long-range Airbus A340 aircraft flying regularly all over the world, about 46 000 vertical profiles of ozone between 0 and 9–12 km altitude and about 23 000 time series along inter-continental flight routes have been acquired
20
since 1994. The initial ozone climatology produced in the UTLS domain with the first two years of MOZAIC measurements (Thouret et al., 1998a) compared well to data from the ozone sounding network (Thouret et al., 1998b). A new UTLS ozone climatol-ogy, based on the 1994–2003 MOZAIC measurements and referenced to the altitude of the dynamical tropopause, is being described in a companion study (Thouret et al.,
25
2005).
The general aim of this work is to better document the spatial and temporal dis-tribution of tropospheric ozone and its variability in the mid-northern latitudes from a MOZAIC sub-dataset of vertical profiles at the few most frequently visited airports. The
ACPD
5, 5489–5540, 2005 Tropospheric Ozone Columns from MOZAIC R. M. Zbinden et al. Title Page Abstract Introduction Conclusions References Tables Figures J I J I Back CloseFull Screen / Esc
Print Version Interactive Discussion
EGU study is orientated towards the seasonal and inter-annual analysis of two vertically
integrated quantities, the tropospheric ozone column which is the integrated ozone profile through the depth of the troposphere, and the stratospheric intrusion ozone column which is the integrated stratospheric-origin ozone profile through the depth of the troposphere. A Lagrangian methodology is used to discriminate
stratospheric-5
and tropospheric-origin ozone below the tropopause. Motivations to study vertically integrated quantities are: i) to deliver an integrated view of the ozone column in the troposphere, ii) to make meaningful comparisons of ozone columns in the boundary layer, in the mid-troposphere, and in the upper-troposphere, iii) to compare the impact of stratosphere-troposphere exchange versus photochemical sources, iv) to provide
10
meaningful comparisons with present and future satellite retrieval techniques that pro-vide the tropospheric ozone column, v) to propro-vide models with seasonal-mean and regional-mean data for initialisation. The present MOZAIC dataset allows a limited in-vestigation of the interannual variability of the tropospheric ozone column as well as an assessment of its trends in the short-term (the 7-years period from January 1995
15
to December 2001 investigated here). From now on, in order to shorten, trends in the short-term will be noted trends as far as MOZAIC dataset is concerned. The aim is to quantify the Tropospheric Ozone Column (T OC) at mid-northern latitudes, to give an assessment of the contribution of stratospheric-origin air to T OC, and to investi-gate the interannual variability and the trends of T OC. Section2presents the MOZAIC
20
data, Sect. 3 is devoted to definitions and methodology, Sect. 4 is a climatology of T OC, Sect.5investigates the trends and the interannual variability of T OC. Finally, we summarize our main results in section 6.
2. MOZAIC data
Measurements of ozone in the MOZAIC program are taken every four seconds from
25
take-off to landing. Based on the dual-beam UV absorption principle (Model 49–103 from Thermo Environment Instruments, USA), the ozone measurement accuracy is
es-ACPD
5, 5489–5540, 2005 Tropospheric Ozone Columns from MOZAIC R. M. Zbinden et al. Title Page Abstract Introduction Conclusions References Tables Figures J I J I Back CloseFull Screen / Esc
Print Version Interactive Discussion
EGU timated at ± [2 ppbv+2%] (Thouret et al., 1998a). From the beginning of the program
in 1994, the measurement quality control procedures have remained unchanged to en-sure that long-term series are free of instrumental artefact. Instruments are laboratory calibrated before and after the flight periods, the duration of which is generally 12 to 18 months. The laboratory calibration is performed with a reference analyser which
5
is periodically cross-checked with a National Institute of Standards and Technology in France. Additionally and during the flight operation period, each instrument is regularly checked for the zero and for the calibration factor, using a built-in ozone generator. Fur-thermore, intercomparisons are made between aircraft when they fly close in location and time, which happens several times a month. In this study, measurements used
10
are ascent and descent profiles from August 1994 to February 2002. Raw data (4 s time resolution) are averaged over 150 m height intervals. To help the interpretations of MOZAIC data, meteorological parameters derived from operational European Cen-tre for Medium-Range Weather Forecast (ECMWF) analyses and interpolated along aircraft trajectories have been added by M ´et ´eo-France in the MOZAIC database, like
15
pressure levels of four Potential Vorticity (P V ) values (1, 2, 3 and 4 pvu), the P V itself and a reconstructed potential vorticity RP V with a Lagrangian method. Details are given in the following section. Table1list all abbreviations used in the paper.
A subset of mid-latitude MOZAIC sites, having high frequencies of observations and spread over the northern hemisphere, has been selected. It is made up of Frankfurt
20
(Germany) with 6338 vertical profiles (operation of two aircraft from this airport), Paris (France) with 3308 vertical profiles, New York (USA) with 2631 vertical profiles, and of the cluster of Tokyo, Nagoya and Osaka (Japan) with 1899 vertical profiles. Frankfurt and Paris, 650 km apart, will be used as a subset to assess the mesoscale variability of the results. The closeness of the three Japanese cities visited by MOZAIC is turned
25
to good account to constitute one MOZAIC site with a suitable regional sampling fre-quency for Japan. Profiles are defined as the part of the flight between ground level and the first pressure stabilized cruising level, usually up to about 300 hPa (200 hPa) with regard to the ascent (descent) profile. Tracks of aircraft profiles at the ground display
ACPD
5, 5489–5540, 2005 Tropospheric Ozone Columns from MOZAIC R. M. Zbinden et al. Title Page Abstract Introduction Conclusions References Tables Figures J I J I Back CloseFull Screen / Esc
Print Version Interactive Discussion
EGU a disk of about 400 km radius in Frankfurt and Paris, a quarter of disk facing northeast
in New York, and half of a disk facing northwest over Japan. We consider aircraft pro-files as valuable as balloon soundings to compute tropospheric ozone columns in spite of the atmospheric volumes delimited by the ground tracks of aircraft vertical profiles, somewhat larger than the ones of balloon soundings, and the larger ascent rates of
5
balloon soundings. These discrepancies were evaluated by Thouret et al. (1998b). Monthly time series of flight numbers over the 4 MOZAIC sites are displayed on Fig. 1. Frankfurt has the best sampling frequency with an average of 70 profiles per month and minimum monthly numbers exceeding 30 except in August 1994 and March 2001. Paris has a good sampling frequency with an average of 36 profiles per month
10
with nevertheless 2 profiles per month in September 1995, and some periods with none in March 1998, December–January 2000 and May 2001–January 2002. An average of 30 profiles per month is reached in New York with less than 10 profiles per month in December 1998–March 1999 and in January–February 2002. Japan has an average of 20 profiles per month with less than 5 profiles per month during August 1994–March
15
1995 and February 2002. Note that the measurement frequency for most of the ozone sonde stations of the northern hemisphere is weekly (WOUDC web site: http://www. woudc.org/data f.html).
3. Definitions and methodology
3.1. Tropospheric ozone column
20
Several tropopause definitions exist. The thermal tropopause is defined by WMO (1957) as the lowest level where the temperature lapse rate falls below ∆T /∆Z=2 K/km and its average between this level and all higher levels within ∆Z=2 km remains below this value. The dynamical tropopause is defined with a threshold on the potential vorticity (Ertel, 1942). The P V threshold for the dynamical tropopause ranges
25
ACPD
5, 5489–5540, 2005 Tropospheric Ozone Columns from MOZAIC R. M. Zbinden et al. Title Page Abstract Introduction Conclusions References Tables Figures J I J I Back CloseFull Screen / Esc
Print Version Interactive Discussion
EGU Hoinka, 1998). A chemical tropopause has been defined by Bethan et al. (1996) with
criteria on vertical gradients of ozone mixing ratio. In the present study, we use the dynamical tropopause (DT ) defined with a 2.0 pvu P V threshold (Thouret et al., 2005). Coming down from the top of the aircraft profile, DT is defined at the first intersec-tion with the 2 pvu P V threshold. We further arbitrarily consider three vertical layers
5
in the depth of the troposphere. The layer from the dynamical tropopause to 8 km altitude refers to the upper-troposphere (U T ). The 8–2 km altitude layer refers to the mid-troposphere (MT ). The 2–0 km altitude layer refers to the boundary layer (BL).
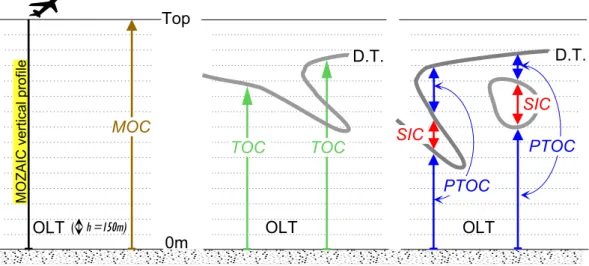
Tropospheric Ozone Columns (T OC) are calculated from the ground to the dynamical tropopause (Fig.2). T OC, expressed in Dobson Units (DU ), is the equivalent thickness
10
of ozone contained in the tropospheric vertical column of one cm−2section compressed down to standard temperature and pressure such that 10−5m corresponds to 1 DU which is 2,6861020·1016· mol·cm−2 (Andrews et al., 1987). The contribution to T OC of a basic atmospheric layer of 150-m vertical depth is called Ozone Layer Thickness (OLT ), so that T OC is the integration of OLT from ground to DT , while the integration of
15
OLT from ground to the top of the MOZAIC vertical profile is called MOC for MOZAIC Ozone Column. The detailed computation of OLT is given in the Appendix.
Stratospheric intrusions into the troposphere occur during tropopause folding in nar-row regions near upper-tropospheric fronts (Danielsen, 1968) and can be traced by characteristic features like high static stability, high ozone content, low water vapor
20
content, and high potential vorticity. In presence of a tropopause fold, e.g. when the 2 pvu contour folds below the tropopause (see Fig. 2), stratospheric-origin ozone is included in the T OC like we have defined it. T OC may be dramatically increased with stratospheric-origin intrusions because ozone observations across tropopause folds often show high ozone concentrations. For instance, Danielsen et al. (1987) and
Brow-25
ell et al. (1987) reported mixing ratio of ozone in excess of 200 ppbv in a 2.0-km-deep tropopause fold observed with airborne lidar and in situ measurements in the upper troposphere. The contribution of stratospheric-origin ozone to T OC assessed using Eq. (6) (see Appendix) for a hypothetical tropopause fold of 1.5-km depth with a
ACPD
5, 5489–5540, 2005 Tropospheric Ozone Columns from MOZAIC R. M. Zbinden et al. Title Page Abstract Introduction Conclusions References Tables Figures J I J I Back CloseFull Screen / Esc
Print Version Interactive Discussion
EGU 150-ppbv homogeneous ozone mixing ratio at 400 hPa and −20◦C is about 10 DU (or
equivalently 1 DU/150 m on the vertical), which may represent up to 50% (25%) of the monthly-mean T OC observed at mid-latitudes during winter (summer) as described in following sections. Stratosphere-troposphere exchanges may therefore be a more or less important contributor to the tropospheric ozone budget according to whether
in-5
trusions are deep, transient or shallow when penetrating into the troposphere (Wernli and Bourqui, 2002; Stohl et al., 2003). The identification of the stratospheric origin of air parcels with thermodynamical parameters may be achieved through Lagrangian approaches (Wernli and Davies, 1997; Stohl, 2001). Here, the Lagrangian parame-ter used, the Reconstructed Potential Vorticity (RP V ), is the P V value at the end of
10
a 24-h backward air parcel trajectory initialised at the location of the observation and computed with 6-hourly winds from ECMWF analyses. A recent stratospheric-origin (≤24 h) is allocated to an air parcel if a triple criteria is met: RP V ≥1.5 pvu, altitude >2000 m and observed relative humidity (RH) <50%. The criterion on RP V is a com-promise. It has to be less than the one for the dynamical tropopause in order to take
15
into account non-conservation effects in trajectories and the numerical diffusion by the parent model. It has to be large enough to avoid capturing tropospheric-origin air parcels with P V diabatically enhanced in a region of strong latent heat release. The second criterion on the altitude prevents to capture air parcels with a relatively large P V enhanced by a thermal inversion at the top of the Boundary Layer. At last, the dryness
20
criterion on the relative humidity is to strengthen the characteristics of stratospheric-origin air. No criterion is imposed on the ozone observation as it will be used to test the confidence in the method. With this method and as illustrated on Fig.2, we define two new quantities. The Stratospheric Intrusion Column SIC is the integrated ozone profile through layers that fulfil stratospheric-origin ozone criteria (RP V >1.5 pvu, z>2000 m,
25
RH≤50%) below the dynamical tropopause. The Pure Tropospheric Ozone Column P T OC is the difference between T OC and SIC.
In order to illustrate the computation of T OC, SIC and P T OC quantities, four indi-vidual MOZAIC profiles over Frankfurt are illustrated on Fig.3. The first vertical profile
ACPD
5, 5489–5540, 2005 Tropospheric Ozone Columns from MOZAIC R. M. Zbinden et al. Title Page Abstract Introduction Conclusions References Tables Figures J I J I Back CloseFull Screen / Esc
Print Version Interactive Discussion
EGU (Fig.3a) presents typical signatures of the tropopause, like the change in the
tempera-ture lapse rate, the dryness, and the well defined vertical gradient of ozone mixing ratio. The dynamical tropopause DT is given at 7850 m altitude with the P V threshold which is correct with regard to the temperature lapse rate but may be a little bit too high with regard to the ozone mixing ratio. As a consequence, the rapid increase of the OLT
pro-5
file from 0.6 to 0.8 DU/150 m just below the tropopause is counted as a contribution to T OC which is uncertain but has nevertheless a minor impact. T OC is about 21 DU and there is no stratospheric-origin contribution in it as the RP V profile never exceeds the 1.5 pvu threshold. The second vertical profile (Fig.3b) also presents clear tropopause signatures in the observations in coherence with the dynamical tropopause given at
10
10 028 m. The RP V threshold method detects a typical stratospheric-origin layer in the mid-troposphere between 5812 m and 6679 m where ozone is anti-correlated with the relative humidity, and the lapse rate temperature is decreasing. In this layer the ozone mixing ratio is larger than 100 ppbv, or equivalently OLT is larger than 0.8 DU/150 m. The contribution of SIC to T OC is 5.93 DU, about 18% of T OC. On the third vertical
15
profile (Fig.3c) the dynamical tropopause is defined and crossed at 9828 m. Data show a characteristic tropopause fold around 4700 m, with a 90 ppbv ozone peak, 10% mini-mum relative humidity and OLT maximini-mum close to 0.8 DU/150 m. The case study was used by N ´ed ´elec et al. (2003) in a validation paper for ozone and carbon monoxide measurements from the MOZAIC program. However, this tropopause fold is not
de-20
tected by the RP V threshold method, and so does not contribute to SIC though it does for T OC. It shows that improvements of the Lagrangian approach would certainly be needed to capture all stratospheric intrusions. Below the tropopause there are some layers where RP V exceeds its 1.5-pvu threshold, however these layers are considered of tropospheric-origin because humidity is very high. In the last example (Fig.3d) the
25
dynamical tropopause is defined at 11 000 m and is not crossed by the aircraft that stops climbing at about 9 km altitude. The vertical profile of OLT (in DU/150 m) has been filled up from 9128 m till the level of the dynamical tropopause with a method de-scribed in the next section. In the planetary boundary layer, ozone pollution is visible
ACPD
5, 5489–5540, 2005 Tropospheric Ozone Columns from MOZAIC R. M. Zbinden et al. Title Page Abstract Introduction Conclusions References Tables Figures J I J I Back CloseFull Screen / Esc
Print Version Interactive Discussion
EGU with a 80 ppbv maximum at 1000 m, OLT values exceed 1.2 DU/150 m and strongly
contribute to T OC which is close to 40 DU. To summarise, T OC values of the previ-ous MOZAIC profiles are between 23 and 40 DU. The maximum OLT contribution to T OC can be either located in the boundary layer, the mid-troposphere or the upper-troposphere. A given ozone mixing ratio will obviously contribute more to T OC in the
5
lower-troposphere than at any other higher level in the troposphere, because of greater air density at lower heights (Eq.6in the Appendix).
3.2. Missing data in vertical profiles
Missing data in tropospheric profiles occur for two reasons. First, there are data gaps that are due to the operation of the MOZAIC ozone analyser (internal calibration
pe-10
riods, resets, powercuts,. . . ). With regard to this, data gaps take up one or several 150-m deep layers with a frequency that does not exceed 5% of the data set used in this study. If data is missing for just one OLT (i.e., a 150-m deep layer; see Fig. 2) in a profile, then the missing value is computed using a linear interpolation between data of the two nearest layers in the same profile. If data for more than one OLT are
15
missing (i.e. a gap exceeding 150-m depth), each missing OLT value is replaced by its seasonal climatological value computed using the MOZAIC dataset (see Sect.4.1). Second, there are the MOZAIC profiles that do not reach the dynamical tropopause. Here, our strategy is to fill up the unexplored atmospheric layers as high as possible by replacing missing OLT values with their corresponding seasonal climatological values.
20
If the dynamical tropopause for a given flight is situated above the top of the seasonal climatological profile (about 12 km altitude in practice for MOZAIC aircraft), the profile is filled up to the latter level and we decide not to fill up the unexplored remainder. The contribution to T OC of the unexplored remainder of the profile is all the more important since the tropopause is high, with nevertheless a balancing effect due to the
depen-25
dency of OLT to pressure. Impacts of the filling-up process and unexplored remainders of profiles are evaluated and discussed below.
ACPD
5, 5489–5540, 2005 Tropospheric Ozone Columns from MOZAIC R. M. Zbinden et al. Title Page Abstract Introduction Conclusions References Tables Figures J I J I Back CloseFull Screen / Esc
Print Version Interactive Discussion
EGU MOZAIC vertical profiles in Frankfurt, 39.5% in Paris, 33.5% in New York and 19.0%
over Japan (see column P1 in Table 2). Filling-up vertical profiles with seasonal cli-matological OLT values when the tropopause of the day is higher than the top of the aircraft profile occurs for 47.6% of the profiles in Frankfurt, for 50.2% in Paris, for 38.2% in New York, and for 25.3% over Japan (column P2). Some vertical profiles are still
un-5
completed after this step because the P V profiles are not available on the data base, which occurs for less than 2% of the profiles whatever the site (column P3). Finally, there are other uncompleted profiles because the tropopause of the day is higher than the maximum altitude of the seasonal climatological profile, which ranges from 6.5% over Frankfurt to 54.5% over Japan (column P4). We choose to only discard P3
pro-10
files from this study. Discarding all incomplete profiles (P2 and P4 columns) would bias the study towards systematic lower tropopause situations and eliminate about 80% of the Japanese profiles for the study of the mid-troposphere and the boundary layer. Keeping these profiles avoid the aforementioned bias. However their filling-up process weights the assessment of the short-term tendency of T OC with the contribution of a
15
fixed seasonal value, and there is an underestimation of T OC for P4 profiles. These effects, that may become important in New York and Japan during summertime when the tropopause is the highest, are now assessed.
Monthly mean pressure of the dynamical tropopause for the 4 MOZAIC sites is shown on Fig.4. Blue lines are when applying the tropopause detection method with
20
the P V threshold on ECMWF analyses at the sampling frequency of MOZAIC flights (Column P in Table2). A marked low (high) tropopause is visible in winter (summer) over New York and over Japan, whereas the seasonal variations of tropopause pres-sure over Frankfurt and Paris have a somewhat flat seasonal cycle. Differences are mainly due to the position of the sites with regard to main storm-tracks, in the entrance
25
region of Atlantic (Pacific) storm-tracks for New York (Japan), and in the exit region of the Atlantic storm-tracks for Frankfurt and Paris. Black lines show monthly mean pressure of the dynamical tropopause when it is crossed by MOZAIC aircraft (Column P1 in Table2), and red lines show monthly mean pressure after the filling-up process
ACPD
5, 5489–5540, 2005 Tropospheric Ozone Columns from MOZAIC R. M. Zbinden et al. Title Page Abstract Introduction Conclusions References Tables Figures J I J I Back CloseFull Screen / Esc
Print Version Interactive Discussion
EGU on vertical profiles (Columns P1 plus P3 in Table2). For a given station, the difference
between black and red lines is therefore a measure of the efficiency of the method used to fill up the vertical profiles (the more distant the lines, the more effective the method), and the difference between red and blue lines is a measure of the depth of unexplored remainders below the tropopause (the more distant the lines, the thicker
5
the layer). Over Frankfurt, and Paris, the mean depth of unexplored remainders is very thin ('10 hPa) and constant throughout the year. Over New York, it is quite thin in winter and spring but it increases to about 20–30 hPa from June to September. Over Japan the maximum depth of unexplored remainders is about 60 hPa during summer. Summertime T OC over New York and over Japan analysed in Sect. 4 are therefore
10
underestimated because of the non-negligible depth of unexplored remainders below the tropopause. Based on a mean value for OLT of 0.3 DU/150 m (see Sect.4, the maximum summertime losses in unexplored remainders are estimated to be about 0.3 DU over Frankfurt, 3 DU over New York and 5 DU over Japan. The monthly-mean contribution to T OC by the filling-up process is shown on Fig. 5. This contribution
15
corresponds to the integrated ozone profile through the part of the upper troposphere which is bordered by the red and blue lines of Fig.4and that has been filled up with the corresponding part of the seasonal climatological profile. During summer it ranges from 2.8 DU at Frankfurt to 4.7 DU over Japan, while this contribution is about to 2 DU for all sites during winter. It is assessed to be about 10% of T OC whatever the season
20
and the site. It is clear that the filling-up process improves the quantitative assessment of T OC. However, it has also an impact on the investigation of short-term trends by introducing a constant in the dataset.
ACPD
5, 5489–5540, 2005 Tropospheric Ozone Columns from MOZAIC R. M. Zbinden et al. Title Page Abstract Introduction Conclusions References Tables Figures J I J I Back CloseFull Screen / Esc
Print Version Interactive Discussion
EGU
4. Climatological analysis
4.1. Vertical profiles
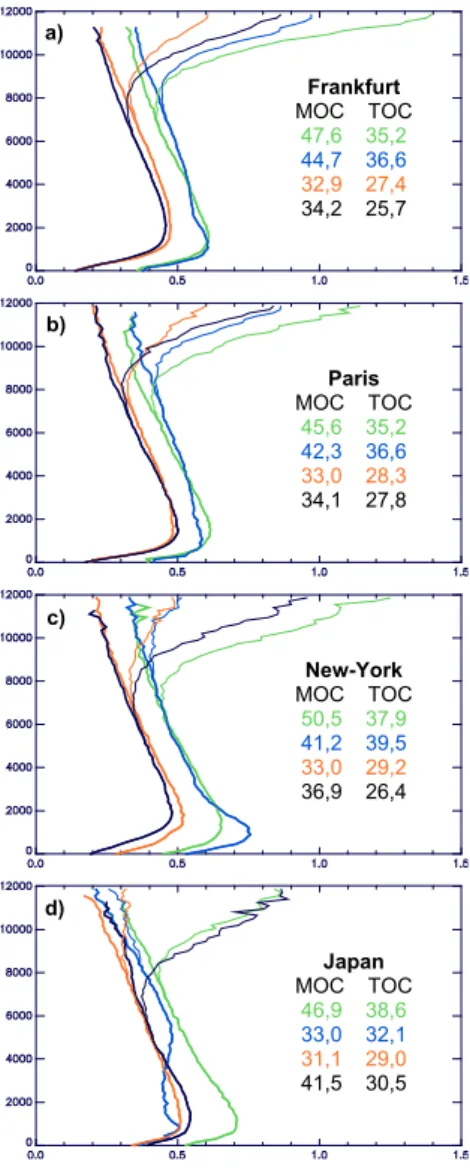
Seasonal climatological vertical profiles of OLT are plotted on Fig.6. The vertical gra-dient of OLT is positive in the boundary layer whatever the season and the site, and becomes negative in the free troposphere. Then, a distinction is made whether the
5
seasonal-mean is computed with all profiles (thin lines) or with sections of the profiles below the dynamical tropopause (thick lines). With all profiles, the large stratospheric ozone concentrations make the vertical gradient of OLT to return to positive values in the upper part of the profile (Fig.6, thin lines). The range of altitude where the ver-tical gradient of OLT changes its sign is nearby the seasonal-mean tropopause, i.e.
10
between 8 and 10 km on every station and for every season, except for New York in winter and in spring and over Japan in winter where the changes occurs slightly be-low 8 km, and except over New York in summer and over Japan in summer and in fall where the change occurs above 10 km. A noticeable feature is that OLT in this region of 8–10 km altitude range get values smaller than in the planetary boundary layer. In
15
the context of the links between the ozone trends in the UTLS region and the radia-tive forcing, the latter feature is important because the contribution of a perturbation on the ozone vertical profile on to the change in surface temperature is maximum in the UTLS region (Forster and Shine, 1997). Because of ceiling altitudes of MOZAIC aircraft nearly always below the tropopause over Japan in summer and fall, the positive
20
vertical gradient of OLT in the lower stratosphere is not defined on the seasonal time scale. In the lower stratosphere, maximum OLT values are observed during spring and range from 0.9 DU/150 m over Japan to 1.4 DU/150 m in Frankfurt, minimum OLT val-ues of about 0.5 DU/150 m are observed during fall. Seasonal-mean valval-ues of MOC, i.e. vertical integrations of thin lines, range from 34 to 50 DU and go through a
max-25
imum in spring at each MOZAIC station. With all sections of the profiles below the dynamical tropopause (Fig. 6, thick lines), seasonal climatological profiles are such that the negative vertical gradient of OLT extends up to the MOZAIC aircraft ceiling
ACPD
5, 5489–5540, 2005 Tropospheric Ozone Columns from MOZAIC R. M. Zbinden et al. Title Page Abstract Introduction Conclusions References Tables Figures J I J I Back CloseFull Screen / Esc
Print Version Interactive Discussion
EGU in the uppermost troposphere. Seasonal-mean values of T OC, i.e. vertical
integra-tions of thick lines, range from 26 to 39 DU and go through a maximum in summer at each MOZAIC station. Very well defined maxima of OLT are observed in the planetary boundary layer. New York gets the highest ozone-polluted boundary layer with a maxi-mum of 0.75 DU/150 m. An exception is for Japan where maritime-origin poor ozone air
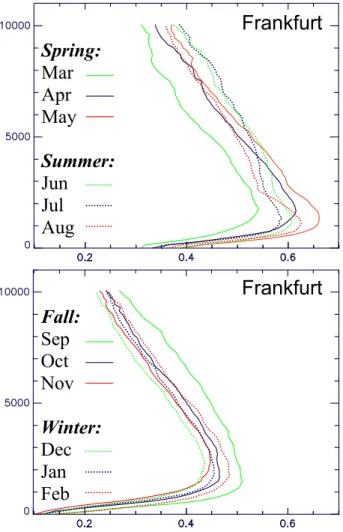
5
masses during the summer-monsoon season are associated with low OLT values up to 5 km altitude. Finally, an interesting feature of OLT tropospheric seasonal-mean pro-files (thick lines) is their separation into two classes, i.e. spring-summer and fall-winter profiles. This classifying also shows up on the monthly basis, as seen for instance for Frankfurt (see Fig.7). March and September appear to be transitional months between
10
the two classes. Synthetic ozone profiles may be easily built from these averaged data for initialization purposes in chemistry-transport models and retrieval techniques for satellite products.
4.2. Seasonal cycle
The seasonal cycle of monthly-mean T OC over MOZAIC sites is presented on Fig.8a.
15
Paris and Frankfurt show a very similar seasonal cycle with a broad maximum of about 34 DU from April to August and a minimum of about 22 DU in December. The sea-sonal cycle over New York is similar to European cycles except for a larger range with a broad spring-summer maximum that peaks to 39 DU in June. It is interesting to note the rapid springtime increase at the three stations and then a dropping off during
20
the late summer. The rapid springtime increase is consistent with a photochemical ozone production after ozone precursors have been accumulated in the troposphere in winter and when insolation increases. The contribution of stratosphere-troposphere exchanges to this cycle is discussed in the following section. Over Japan the seasonal cycle is quite different. The earlier springtime increase is consistent with a latitudinal
25
effect (earlier springtime sun) as Japanese stations are the southernmost stations con-sidered here. Winter and spring values are 2–3 DU larger than those at other sites. The cycle goes across a 38-DU maximum in June, it then abruptly falls to 28 DU during the
ACPD
5, 5489–5540, 2005 Tropospheric Ozone Columns from MOZAIC R. M. Zbinden et al. Title Page Abstract Introduction Conclusions References Tables Figures J I J I Back CloseFull Screen / Esc
Print Version Interactive Discussion
EGU summer-monsoon season (June–July) and slowly decreases to 25 DU in December.
The four U T seasonal cycles (Fig.8b) are all in phase, they display a first maximum in late spring and a second one in late summer. The amplitude is larger for New York and for Japan, in agreement with the summertime elevated tropopause there. The phasing of all four U T cycles suggests that the summer-monsoon over Japan does not
5
influence the upper-tropospheric ozone budget. Mid-tropospheric contributions to T OC (Fig.8c) are predominant (≈60% of T OC). Interestingly, the two European seasonal cycles are almost identical to the one in New York. The peak is in May-June and the minimum in December. The similarity of these three mid-tropospheric cycles has likely something to do with the homogenisation by the large-scale circulation for trace gas
10
distributions that have a sufficient lifetime (a few weeks) like ozone. The latitudinal and the summer-monsoon effects that influence the Japanese seasonal cycle are clearly visible in the mid-troposphere. Boundary layer contributions (Fig.8d) roughly represent a 25% contribution to T OC. These contributions are 10% higher in New York compare to Frankfurt and Paris during spring and summer, and are 10% higher in Japan
com-15
pare to New York, Frankfurt and Paris during autumn and early spring. Local and remote anthropogenic emissions as well as biomass burning over upstream regions of Asia may be responsible of larger low- and mid-tropospheric contributions to T OC over Japan throughout the year except during the summer-monsoon season.
A direct comparison of our results is possible with those of Creilson et al. (2003) who
20
use a technique based on coincident observations of the Total Ozone Mapping Spec-trometer (TOMS) and stratospheric ozone profiles from the Solar Backscattered Ultra-violet (SBUV) instruments to retrieve tropospheric ozone residuals (TOR). Their Fig. 5 shows the monthly climatological tropospheric ozone residuals for two regions centered over Washington D.C. (USA) and over Bordeaux (France) together with a comparison
25
for validation purposes with tropospheric ozone columns integrated with ozonesonde data at Wallops Island (USA) and at Hohenpeissenberg (Germany). Comparisons with our seasonal cycles for T OC in Frankfurt and in New York (Fig. 8a) are quite per-fect with the only restriction of the underestimation in T OC during summertime which
ACPD
5, 5489–5540, 2005 Tropospheric Ozone Columns from MOZAIC R. M. Zbinden et al. Title Page Abstract Introduction Conclusions References Tables Figures J I J I Back CloseFull Screen / Esc
Print Version Interactive Discussion
EGU is due to a missing contribution in the upper-troposphere when tropopause-crossings
by MOZAIC aircraft diminish. Summertime maximum differences can be evaluated to 1 DU in Frankfurt and 5 DU in New York.
4.3. Stratospheric Intrusion Column
The purpose here is to test the validity of the Lagrangian approach used to detect
5
stratospheric-origin air parcels (see Sect.3.1), and to evaluate the contribution of the stratospheric-origin ozone, i.e. the Stratospheric Intrusion Column SIC, to the Tro-pospheric Ozone Column T OC. Over Japan there is a large seasonal range of the frequency of flights affected by STE (i.e., SIC>0), from 69% in January down to 15% in August (not shown). Such a large range may be explained by favourable
winter-10
time dynamics involving STE in the region of the subtropical jet (Sprenger et al., 2003) and by unfavourable summertime monsoon dynamics. Over Paris, Frankfurt and New York and whatever the season, about one third of the vertical profiles contains sig-natures of stratosphere-troposphere exchanges (not shown). The quasi-absence of seasonal variation of STE frequency over mid-latitude western stations is an indication
15
that the criterion used here to compute SIC accumulates transient and deep events. According to Lagrangian studies exploring the sensitivity of the residence time crite-rion of air parcels (e.g. Wernli and Bourqui, 2002; James et al., 2003) transient and deep events lead to flat and pronounced seasonal cycles, respectively. Tropospheric depths of tropopause folds are quite variable. For instance, Danielsen et al. (1987)
20
observed a depth that decreases from 2 to 0.6 km as the folds descends from 6 to 2 km altitude. In accordance with the latter study, the average depth of stratospheric-origin layers assessed here is 750±150 m. Monthly-mean concentrations of ozone observed in stratospheric intrusions are shown of Fig.9a for the upper troposphere and for the mid-troposphere. Mean concentrations in the upper troposphere are always a bit higher
25
than in the mid-troposphere for every month and every station. An upper tropospheric maximum forms in May-June, with about 150 ppbv over New York and Japan, and 110 ppbv over Paris and Frankfurt. An upper tropospheric minimum ranges from 70
ACPD
5, 5489–5540, 2005 Tropospheric Ozone Columns from MOZAIC R. M. Zbinden et al. Title Page Abstract Introduction Conclusions References Tables Figures J I J I Back CloseFull Screen / Esc
Print Version Interactive Discussion
EGU to 90 ppbv during winter over the four stations. Some observed values exceed 250–
300 ppbv which is indubitably of stratospheric-origin. The mid-tropospheric contribution to SIC falls to zero in the summer-monsoon season over Japan. With regard to ozone layer thicknesses associated with stratospheric-origin air, Fig.9b shows the same gen-eral behaviour as for concentrations, except that this time mid-tropospheric values are
5
always a bit larger than upper-tropospheric ones in agreement with the difference of air density. Note that springtime OLT affected by stratospheric intrusions are about 0.6 DU/150 m which is close to the maximum of mean OLT values observed in the pol-luted planetary boundary layer (see Fig.6. If considering maximum isolated values, both in mid- and in upper-troposphere, it exceeds 1.0 DU/150 m which is comparable
10
to lower-stratospheric values.
Finally, Fig. 10 shows the monthly-mean SIC over the four stations. The seasonal cycle exhibits a springtime maximum of about 3 DU and a minimum in autumn of about 2 DU which roughly corresponds to 10% of T OC throughout the year. Taking into ac-count that several factors minimize the catching of stratospheric intrusions in our
La-15
grangian method (see Sect. 3.1 and 3.2), this is a strong result that confirms that the important role of stratosphere-troposphere exchanges in the tropospheric ozone bud-get may be further investigated with the MOZAIC dataset. Roelofs and Lelieveld (1997) considered in a numerical study that as much as 40% of tropospheric ozone may have a stratospheric origin. James et al. (2003) considered in a Lagrangian study that as much
20
as 95% of the mass of the troposphere at any one time has been in the stratosphere within the preceding year. Our results lay the foundations of further observation-based studies where improvements for the retrieval of SIC from the combination of MOZAIC data and a Lagrangian approach may include i) the computation of longer backward trajectories (>5 days) to exploit the sensitivity to the residence time criterion to split
25
transient and deep exchanges, ii) the advection with 3-hourly wind fields (analysis and 3-h forecasts slipped in between) to reduce interpolation errors due to the linear as-sumption on temporal changes, iii) the use of ERA40 re-analyses at ECMWF that pro-vide better quality fields compared to operational analyses in the 1990s at the
begin-ACPD
5, 5489–5540, 2005 Tropospheric Ozone Columns from MOZAIC R. M. Zbinden et al. Title Page Abstract Introduction Conclusions References Tables Figures J I J I Back CloseFull Screen / Esc
Print Version Interactive Discussion
EGU ning of MOZAIC and allow to infer inter-annual variability in stratosphere-troposphere
exchanges, iv) the comparison with a particle dispersion model (Stohl et al., 2000) where effects of turbulent mixing and deep convection are parameterized, v) the use of MOZAIC raw data (better vertical resolution with 4 s time resolution measurements, '20–30 m vertical resolution), vi) other MOZAIC stations to complete the mid-northern
5
study (Washington D.C., Chicago, Vienna,. . . ), vii) further verification with the MOZAIC CO measurements. However, beyond the rough assessment of SIC, we do not think that the precision of the present results allow to separately investigate inter-annual vari-ability and short-term trends of T OC and P T OC. In consequence, the following section narrows on the short-term trends and inter-annual variability of T OC.
10
5. Short-term trends and interannual variability
The present MOZAIC 7-years dataset allows a limited investigation of the interannual variability of the tropospheric ozone column as well as an assessment of the short-term trends. First, time series of monthly-mean T OC are considered in Sect.5.1. Then, in Sect. 5.2, the interannual variability of T OC in association with positive and negative
15
phases of the North Atlantic Oscillation is discussed. 5.1. Short-term trends
The time series of the monthly mean T OC from August 1994 to February 2002 at the four MOZAIC sites are shown on Fig. 11. Seasonal cycles go through a minimum in winter and a maximum in summer, except for Japan where the maximum occurs
20
during spring due to the arrival of the monsoon in summer. Stations of New York and Japan have the largest amplitude, roughly from 20 DU to 44 DU. Stations of Paris and Frankfurt have a lower amplitude, roughly from 20 DU to 36 DU, and quite similar time series (except for differences due to a better sampling over Frankfurt). Some noticeable and common features are i) high T OC values in summer 1998 over New York, Paris and
ACPD
5, 5489–5540, 2005 Tropospheric Ozone Columns from MOZAIC R. M. Zbinden et al. Title Page Abstract Introduction Conclusions References Tables Figures J I J I Back CloseFull Screen / Esc
Print Version Interactive Discussion
EGU Frankfurt, ii) high T OC values in summer 1999 over New York and Japan, iii) highest
wintertime T OC in 1999 over all four stations, ranging from 24 to 26 DU, iv) continuous increase of wintertime T OC from 1996 to 1999 at New York, Paris and Frankfurt. Visual inspection of seasonal cycles in Fig.11gives the impression of a positive trend. This is confirmed by a statistical linear trend analysis over the 1995–2001 period (incomplete
5
seasonal cycles like in 1994 and in 2002 are discarded). The linear increase ranges from 0.7%/year in Frankfurt to 1.1%/year in New York.
Yearly seasonal mean T OC from 1994 to 2001 at the four MOZAIC sites are shown on Fig. 12. The separation in two classes, i.e. spring-summer and autumn-winter, already discussed on seasonal-mean vertical profiles (see Fig.6), is reproduced here
10
with the same exception of the summer-monsoon season over Japan. New York (Paris) exhibits the largest (lowest) seasonal amplitude, about 13.8 DU (9.0 DU) from the sum-mertime mean of 37.8 DU (34.3 DU) to the wintertime mean of 24.0 DU (25.3 DU). Frankfurt and New York get the lowest wintertime mean of about 24.0 DU. Wintertime trends are positive and the strongest among the seasons, about 2%/year over New
15
York, Paris and Frankfurt, and 1%/year over Japan. Then, in descending order, come positive trends in spring and in autumn and nearly non-existent summertime trends at the four stations. In relation to the linear increase, a wintertime bump or anomaly clearly appears in 1997 and in 1998 at all four stations. Such an anomaly is more or less well defined from autumn 1997 to summer 1999 at all stations.
20
Table3sums up the annual-mean and seasonal-mean of T OC (DU) and the related trends (%/year). Values are furthermore detailed for the contribution of the bound-ary layer, the mid-troposphere and the upper-troposphere. Wintertime noticeable fea-tures in New York, Paris and Frankfurt are the strong trends exceeding 3%/year in the boundary layer and 1.7%/year in the mid-troposphere. There are strong
upper-25
tropospheric wintertime trends (exceeding 1.7%/year) at all stations except New York where the trend is negative (−0.7%/year). Summertime trends are generally close to zero whatever the part of the troposphere and the station, except over New York where the negative trend in the boundary layer is compensated by a positive one in
ACPD
5, 5489–5540, 2005 Tropospheric Ozone Columns from MOZAIC R. M. Zbinden et al. Title Page Abstract Introduction Conclusions References Tables Figures J I J I Back CloseFull Screen / Esc
Print Version Interactive Discussion
EGU the mid-troposphere. Finally, one can notice that whatever the station and the season,
mid-tropospheric trends are always positive.
Results presented above agree well within other results found in analyses of long-term series of ozone and cited in the introduction. In particular, trends in the short-long-term ranging from 0.7 to 1.1%/year for T OC at the four MOZAIC sites are in good agreement
5
with the longer-term positive trend of 0.7 to 1.4%/year over Central Europe reported by Weiss et al. (2001) with ozonesonde data. Further comparisons of our results with those by Naja et al. (2003) are of interest. Using residence time of air masses over Cen-tral Europe (computed from 10-days backward trajectories), Naja et al. (2003) analyse the Hohenpeissenberg and Payerne ozonesonde dataset and classify ozone
observa-10
tions associated with central European residence times of 4–6 days as “photochemi-cally aged” ozone. It is shown that in the slot of 1–6 days of residence time, on average and in summer, the mixing ratio of the latter class of ozone increases at a rate of 2 ppbv per day of residence time. Then, by extrapolation to zero day of residence time (using a statistical regression model), the previous authors build a “background” ozone which
15
is supposed to represent Atlantic air masses not influenced by European emissions. Although there is no consideration of residence time of air masses over continents in our study, three stumbling blocks with the findings by Naja et al. (2003) may be found. First, previous authors show that the “photochemically aged” ozone is maximum in summer, minimum in winter, and experiences in summertime a substantial decrease in
20
the planetary boundary layer since the 1990s in agreement with temporal variations of Central European NOxemissions. It is in good agreement with negative trends of T OC in the boundary layer found in summertime for New York and Frankfurt (see Table3). Note that important considerations neglected in this study should be in prospect on this issue (e.g. a better definition of the top of the boundary layer, the importance of the
25
diurnal cycle of the boundary layer, the importance of the airport position relative to its associated urban area,. . . ). Second, Naja et al. (2003) show positive trends of ozone in “background’ and in “photochemically aged” air in winter. It is in good agreement with the consistent positive trends found in wintertime and for the full tropospheric column at
ACPD
5, 5489–5540, 2005 Tropospheric Ozone Columns from MOZAIC R. M. Zbinden et al. Title Page Abstract Introduction Conclusions References Tables Figures J I J I Back CloseFull Screen / Esc
Print Version Interactive Discussion
EGU the four MOZAIC stations (except for New York in the upper troposphere, see Table3).
Third, Naja et al. (2003) show that “background” ozone in the planetary boundary layer and in the free troposphere has a broad maximum extending from late spring to sum-mer, has a minimum in winter and experiences increasing influences of emissions from North America and Eastern Asia. The importance of background pollution and
inter-5
continental transport was previously suggested by many other authors (e.g. Berntsen et al., 1996; Jacob et al., 1999; Wild and Wakimoto, 2001). The common behaviour of yearly seasonal mean T OC at the four MOZAIC stations (see Fig. 12) is strongly suggestive of a consistent influence of background pollution transported by the general circulation. Therefore, station-to-station comparisons and links with the variations of
10
the general circulations patterns are now discussed. 5.2. General circulations patterns
The North Atlantic Oscillation (NAO) is one of the most dominant and regular pat-terns of atmospheric circulation variability from the United States to Siberia and from the Artic to subtropical Atlantic (Wallace and Gutzler, 1981; Barnston and Livezey,
15
1987). It takes the form of a dipole anomaly in the surface pressure field between Iceland and the Azores. Here we use the NAO index defined as the difference of nor-malized sea level pressure between Lisbon, Portugal and Reykjavik, Island (Hurrell, 1995). At the hemispheric scale, geopotential anomalies ranging from the surface to the stratosphere are dominated by a mode of variability known as the Northern
Annu-20
lar Mode (NAM) also called Artic Oscillation (Baldwin and Dunkerton, 1999). In order to incorporate the Japanese MOZAIC stations in our investigation we also consider NAM, which has a broader centre of action than NAO in the northern hemisphere. We use monthly-mean mid-tropospheric 1000 hpa NAM indices provided by M. Baldwin (http://www.nwra.com/resumes/baldwin/nam.php). Positive trends of NAO and AO in
25
the last decades suggest that circulation changes may contribute to the observed win-ter trends of the total (stratospheric and tropospheric) ozone (Appenzeller et al., 2000; Thomson et al., 2000; Bronniman et al., 2000).
ACPD
5, 5489–5540, 2005 Tropospheric Ozone Columns from MOZAIC R. M. Zbinden et al. Title Page Abstract Introduction Conclusions References Tables Figures J I J I Back CloseFull Screen / Esc
Print Version Interactive Discussion
EGU The issue of the influence of general circulation patterns is now discussed with the
aid of T OC anomalies and indices of the general circulation. With regard to relation-ships between NAO/NAM and T OC anomalies, two distinct effects are to be consid-ered. Indeed, NAO/NAM variability is associated with geographical tropopause pres-sure patterns and with typical tropospheric transport pathways. With regard to the first
5
effect, Appenzeller et al. (2000) have shown that the tropopause pressures are strongly correlated with a distinct geographical pattern of NAO over a large Atlantic-sector, e.g. lower tropopause over Iceland for positive NAO phases opposed to higher tropopause over Europe in positive NAO phases, and vice versa. This finding has been confirmed in a companion study (Thouret et al., 2005). With regard to the second effect, the
10
tropospheric ozone distribution is influenced by remote sources via long-range trans-port, which is itself influenced by NAO/NAM inter-annual variations. Over the Atlantic the Azores high is eastward shifted of about 30◦ of longitude for the positive phase of NAO compared to the negative phase and the westerlies are reinforced (Cassou et al., 2004). Then, a faster and more zonal flow across the Atlantic during positive NAO
15
phases favours the transport of anthropogenic pollution from North America to Europe (Creilson et al., 2003). As a consequence, and for the example of the Frankfurt sta-tion, NAO positive phases would be associated to positive anomalies of T OC built by a larger contribution of the upper part of the tropospheric vertical column or/and by an increase of the background tropospheric ozone.
20
NAO and NAM display considerable monthly and interannual variability (Hurrell, 1995), their effects reach the highest point during wintertime but have been observed at all seasons. In the construction of time series of monthly T OC anomalies (Fig.13a), each monthly T OC is deseasonalized by subtraction of its annual-mean value (Fig.8). To lessen the monthly variability and to capture the extra-seasonal signal shown on
25
Fig. 12, we smooth the time series with a running window of ±6 months. The quite good overall coherence of all parameters over four major periods is striking. The pe-riod 1995–1996 shows negative T OC anomalies and negative NAO/NAM indices. It is followed by a transition year in 1997. Then comes the 1998–1999 period with positive
ACPD
5, 5489–5540, 2005 Tropospheric Ozone Columns from MOZAIC R. M. Zbinden et al. Title Page Abstract Introduction Conclusions References Tables Figures J I J I Back CloseFull Screen / Esc
Print Version Interactive Discussion
EGU T OC anomalies and positive NAO/NAM indices. Finally, there is the last period 2000–
2001 during which parameters show less mutual coherence and a gradual transition to negative values. Note that the most important information of Fig.13a, i.e. the transition from a period of negative T OC anomalies to a period of positive anomalies, is only brought by the contribution of the mid-troposphere (not shown). Monthly time series
5
of the contributions of the boundary layer and the upper-troposphere do not show up this transition, which suggests that the mid-tropospheric long-range transport of ozone may be a dominant process. Figure13b shows the plot of monthly T OC anomalies in Frankfurt versus in New York, symbols are colour-coded with NAO indices. There exists a strong relationship between T OC anomalies of the two stations which is
con-10
firmed by a very high correlation factor (r=0.97, see Table4). This correlation factor is even higher than the positive correlation factor between T OC anomalies at each sta-tion and NAO indices (r=0.66 for the two stations). The very high positive correlation factor between T OC anomalies at the two stations reinforces the latter suggestion that the long-range mid-tropospheric transport is a dominant process that establishes links
15
between T OC anomalies whether the NAO phases are positive or negative. A scenario that can be proposed from our results is the following. Positive T OC anomalies in New York and Frankfurt during positive NAO phases are correlated by the establishment of a direct mid-tropospheric transport pathway across the Atlantic that is favoured by a zonalisation of the flow during positive NAO phases. During negative NAO phases, this
20
direct transport pathway is somewhat disrupted by meridional perturbations of the mid-tropospheric flow as shown by Creilson et al. (2003) and the correlation between T OC anomalies could be lessened by this effect. However, climatological conditions prevail-ing durprevail-ing negative NAO phases may lead to independent negative T OC anomalies on both sides of the Atlantic, which finally would reinforce indirectly the correlation
be-25
tween T OC anomalies, i.e. without the establishment of a direct link with regard to the transport. From Figs.13c and d and Table4, it can be seen that the extension of the previous scenario to the hemispheric scale by introducing the Japanese station is un-likely because of the lessening of the correlation between T OC anomalies and NAM
ACPD
5, 5489–5540, 2005 Tropospheric Ozone Columns from MOZAIC R. M. Zbinden et al. Title Page Abstract Introduction Conclusions References Tables Figures J I J I Back CloseFull Screen / Esc
Print Version Interactive Discussion
EGU indices. Now, considering the positive anomaly that has been defined from autumn
1997 to summer 1999 at all stations (Fig. 12) in the present 7-years dataset, such anomaly has a strong contribution to the common behaviour of T OC related param-eters, i.e. multi-stations positive short-term trends, multi-stations positive correlations with NAO/NAM variations, and inter-stations correlated anomalies. The winter of 1997–
5
1998, marked by a record breaking El Nino event, was the second warmest winter since 1895. Global temperatures in 1998 were the warmest in the past 119 years and the previous record was set in 1997 (see the Annual Review on climate of 1998 on the NOOA web site athttp://lwf.ncdc.noaa.gov/oa/climate/research/1998/ann/ann98.html). These warmer conditions may have globally favoured the photochemical production of
10
ozone in the troposphere, what coupled to the transition towards positive NAO/NAM indices, may have also favoured the long-range transport of higher background con-centrations of ozone. Whether or not the transition of negative to positive NAO phases in this period could be a response to anthropogenic forcings, as suggested by some scenario model experiments in which enhanced greenhouse gas concentrations are
15
prescribed (Ulbrich and Christoph, 1999), or may be better understood in terms of an intrinsic dynamical property of the North Atlantic atmosphere (Cassou et al., 2004) is out of the scope of the present study.
6. Conclusions
We have investigated climatological and interannual variability aspects of ozone
verti-20
cal profiles performed at four stations, Frankfurt (Germany), Paris (France), New York (USA) and the cluster of Tokyo, Nagoya and Osaka (Japan), by commercial aircraft par-ticipating to the MOZAIC program from August 1994 to February 2002. This database of several thousands of vertical profiles constitutes nowadays one of the most inter-esting datasets with regard to research issues on the tropospheric ozone budget and
25
recent short-term trends. The study focuses on the analysis of two vertical integrated quantities in the troposphere, i.e. the Tropospheric Ozone Column (T OC), which is the
ACPD
5, 5489–5540, 2005 Tropospheric Ozone Columns from MOZAIC R. M. Zbinden et al. Title Page Abstract Introduction Conclusions References Tables Figures J I J I Back CloseFull Screen / Esc
Print Version Interactive Discussion
EGU vertical integration of ozone from the ground to the dynamical tropopause, and the
Stratospheric Intrusion Column (SIC), which is the vertical integration of stratospheric-origin ozone throughout the troposphere. Commercial aircraft generally fly in the range 9–12 km altitude, so that ascent and descent profiles at airport do not systematically in-clude the tropopause region. Taking into account the interest of working on a maximum
5
of vertical profiles and the necessity to have profiles in the full depth of the troposphere (to compute the integrated quantities), our strategy has been to fill up unexplored parts of the vertical profiles as much as possible with seasonal climatological profiles. This avoids to bias the results towards meteorological situations for which the tropopause is systematically low. The impact that the filling-up process may have on the
inves-10
tigation of short-term trends by introducing a constant in the dataset is limited to the summertime uppermost troposphere in New York and Japan.
The climatological analysis shows that the T OC seasonal cycle ranges from a mini-mum wintertime of about 22–25 DU at all four stations to a spring-summer maximini-mum of about 35 DU in Frankfurt and Paris, and 38 DU in New York. Over Japan, the maximum
15
occurs in spring because of the earlier springtime sun, then the invasion of monsoon air masses in the boundary layer and in the mid-troposphere steeply diminishes the summertime T OC. Boundary layer contributions to T OC are 10% higher in New York compare to Frankfurt and Paris during spring and summer, and are 10% higher in Japan compare to New York, Frankfurt and Paris during autumn and early spring.
Lo-20
cal and remote anthropogenic emissions as well as biomass burning over upstream regions of Asia may be responsible of larger low- and mid-tropospheric contributions to T OC over Japan throughout the year except during the summer-monsoon season.
A simple Lagrangian analysis based on 24-h backward trajectories of air masses has shown that the contribution of SIC to T OC exhibits a springtime maximum of
25
about 3 DU and a minimum in autumn of about 2 DU, which roughly corresponds to 10% of stratospheric-origin ozone into the troposphere throughout the year. As this simple analysis minimizes the stratospheric source, it confirms the important role of stratosphere-troposphere exchanges in the tropospheric ozone budget and prompts to
ACPD
5, 5489–5540, 2005 Tropospheric Ozone Columns from MOZAIC R. M. Zbinden et al. Title Page Abstract Introduction Conclusions References Tables Figures J I J I Back CloseFull Screen / Esc
Print Version Interactive Discussion
EGU improve the Lagrangian approach proposed here to more deeply investigate the issue
with the MOZAIC dataset.
The investigation on the short-term trends of the tropospheric ozone column over the period 1995–2001 has shown a linear increase of 0.7%/year in Frankfurt, 0.8%/year in Japan, 0.9%/year in Paris, and 1.1%/year in New York. This is in agreement with
5
longer-term positive trend of 0.7 to 1.4%/year over Central Europe reported by Weiss et al. (2001) with ozonesonde data. Results show that essential ingredients to the positive short-term trends are the continuous increase of wintertime T OC from 1996 to 1999 and the contributions of the mid-troposphere whatever the season. Slightly negative short-term trends of the contributions of the boundary layer to T OC in New
10
York and Frankfurt may be an indication of decreasing NOx emissions. Summertime ozone does not seem to contribute to the positive short-term trends, though relatively higher summertime T OC have been recorded in 1998 for New York, Paris and Frankfurt and in 1999 for New York and Japan. Some considerations involving possible effects of large-scale circulations patterns variability like the North Atlantic Oscillation and the
15
Northern Annular mode have been discussed. The transition from a period of nega-tive T OC anomalies before 1997 to a period of posinega-tive T OC anomalies in 1998–1999 comes with a shift from negative to positive phases of the North Atlantic Oscillation that seems to be a determining factor in the positive short-term trends observed in New York, Frankfurt and Paris.
20
Appendix: Computation of the Tropospheric Ozone Column (T OC)
For a volume of gas V measured at pressure P and temperature T , it is possible to define its volume Vsaltered to standard pressure Ps=101 325 Pa and standard temper-ature Ts=273, 15 K, referring to the Ideal Gas Law:
P · V
T =
Ps· Vs Ts


![Fig. 3. Individual MOZAIC vertical profiles (in km) over Frankfurt. Horizontal bottom scale is available for ozone mixing ratio [in ppmv – red dotted line], OLT [in DU – red solid line or red dashed line if the profile has been filled up to the altitude of the dynamical tropopause using the monthly-average OLT profile], relative humidity [×100% – blue line] and reconstructed](https://thumb-eu.123doks.com/thumbv2/123doknet/2337831.33211/43.918.99.614.37.442/individual-vertical-frankfurt-horizontal-available-dynamical-tropopause-reconstructed.webp)