To cite this version : Jarray, Ahmed and Gerbaud, Vincent and
Hemati, Mehrdji
Prediction of solid–binder affinity in dry and aqueous
systems: Work of adhesion approach vs. ideal tensile strength
approach
. (2015) Powder Technology, vol. 271. pp. 61-75. ISSN
0032-5910
To link to this article : doi:
10.1016/j.powtec.2014.11.004
URL :
http://dx.doi.org/10.1016/j.powtec.2014.11.004
O
pen
A
rchive
T
OULOUSE
A
rchive
O
uverte (
OATAO
)
OATAO is an open access repository that collects the work of Toulouse researchers and
makes it freely available over the web where possible.
This is an author-deposited version published in :
http://oatao.univ-toulouse.fr/
Eprints ID : 14277
Any correspondance concerning this service should be sent to the repository
administrator:
[email protected]
Prediction of solid–binder affinity in dry and aqueous systems: Work of
adhesion approach vs. ideal tensile strength approach
Ahmed Jarray
⁎
, Vincent Gerbaud, Mehrdji Hémati
Université de Toulouse, INP, UPS, LGC (Laboratoire de Génie Chimique), 4 allée Emile Monso, F-31432 Toulouse Cedex 04, France LGC, INP, ENSIACET, 4 Allée Emile Monso, 31432 Toulouse, France
a b s t r a c t
Keywords: Agglomeration Pharmaceutical products Solubility parameter Work of adhesion Tensile strength CoatingWet granulation process requires the addition of a coating agent or binder, typically composed of surfactants such as hydroxypropyl-methylcellulose (HPMC), water and a small amount of filler such as stearic acid (SA). In dry granulation however, the coating agent is added to the system in the form of fine solid particles. In both cases, a successful granulation requires good affinity between host and guest particles. In this study, we compare two approaches to predict the binder–substrate affinity in dry and in aqueous media, one based on the work of adhesion and the other based on the ideal tensile strength (Rowe, 1988). The novelties of this paper are four folds. First, the equations used in both approaches are generalized and rewritten as a function of the Hildebrand solubility parameter δ. δ is obtained from molecular simulations or predicted from HSPiP group contribution method. Secondly, a correlation between δ and the experimental surface tension γ is established for cellulose de-rivative (such as HPMC and ethyl cellulose). Thirdly, the concept of ideal tensile strength, originally formalized by Gardon (1967) for binary systems, is extended to ternary systems and applied for granulation in aqueous media. Fourthly, the approaches are tested for various systems and compared to experimental observations. For dry bi-nary systems, predicted adhesive and cohesive properties agree with literature experimental observations, but the work of adhesion approach performs better than the ideal tensile strength approach. Both approaches predict that HPMC is a good binder for microcrystalline cellulose (MCC). The results also indicate that polyethylene glycol 400 (PEG400) has a good affinity with HPMC and stearic acid. For ternary aqueous systems, the results fully agree with the observations of Laboulfie et al. (2013).
1. Introduction
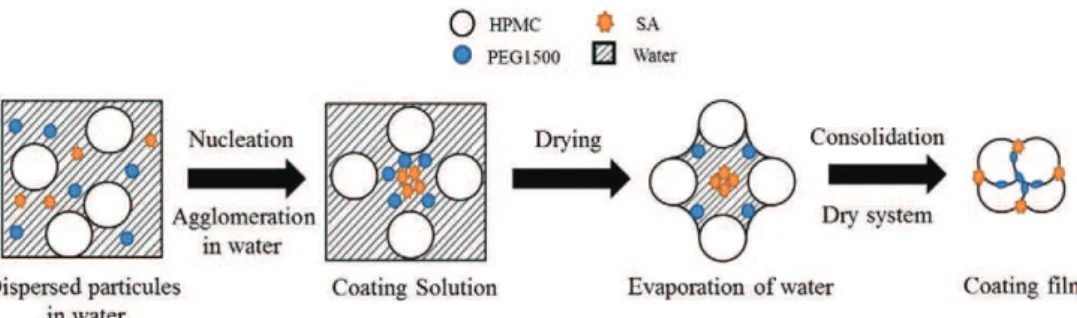
Granulation is a size-enlargement process during which small parti-cles are formed into larger and physically strong agglomerates[1]. In wet granulation processes (Fig. 1), this is performed by spraying a liquid binder onto the particles as they are agitated in tumbling drum, fluid-ized bed, high shear mixer or similar device[2,3].
Coating is a process which allows to deposit on the surface of parti-cles a thin film layer which can be of different nature: polymers, salts, sugars, etc. (Fig. 1).
These two operations confer on powder's new properties for cus-tomers, such as hydrophobicity, masking bitterness, reducing the risks of explosion, avoiding the segregation of the constituents, improving the flow properties and the compression characteristics of the mix.
Processes of size enlargement involve the coupling of two classes of parameters. The first class corresponds to the local physico-chemical
parameters dependent on the nature of the solutions and powders. The second class corresponds to the parameters of the processes which are the constraints exercised by the process equipment on the bed of powder, such as the temperature and the flow rates. The quality of the end product depends on the control of the coupling between these two families of parameters which exist in different scales. At present, the optimization of these parameters, notably the choice of solvent and binders is based on an empirical, by nature long and expensive approach.
The three principal mechanisms of wet granulation are as follows: wetting and nucleation; consolidation and growth; and attrition and breakage[4]. Inspired by Ennis' work[5,6], Benali et al.[7]proposed the modified capillary number Ca′ to evaluate the importance of the vis-cous force with respect to the adhesion work. When the Ca′ N 1, the co-hesion of dynamic liquid bridges during nucleation and growth becomes greater than that of the static liquid bridges. This is attributed to the effect of viscous energy dissipation. When the Ca′ b 1, the effect of the adhesion force is dominant.
Mastering granule processing under the Ca′ N 1 regime is routine for laboratory and industrial practitioners. Mastering the Ca′ b 1 regime
⁎ Corresponding author. Tel.: +33 06 48 45 57 31.
E-mail addresses:[email protected](A. Jarray),[email protected]
(V. Gerbaud),[email protected](M. Hémati).
requires to select binders adequately. Formulating the optimum binder or coating is essential even if suitable operating conditions may bring enough mechanical energy to obtain rigid granules.
This work has for objective to develop predictive methodologies and theoretical tools of investigation allowing to choose the adequate binder or to formulate the right coating solution to assure the customer's re-quested properties of the end product. As such, we explore two theoret-ical approaches for predicting substrate–binder interactions, one based on the work of adhesion, and the other based on the ideal tensile strength. We extend the approaches to ternary systems so as to study the interactions between compounds mixed in a solvent such as hydroxypropyl-methylcellulose (HPMC) and stearic acid (SA) mixed in water. The background section gives an overview of binders and coat-ings commonly used in granulation processes. It also reviews some the-oretical models for binary mixtures. Then, we derive the tensile strength model for ternary mixtures. The last section concerns the model testing. First, we discuss the selection of the model core data, either coming from group contribution method or from molecular simulations, and we compare them with experimental data. Second, a relationship be-tween the surface free energy and solubility parameter is proposed for cellulose derivatives. Third, it is used next for the prediction of the inter-actions in binary and ternary mixtures. The predictions obtained through the tensile strength approach and the work of adhesion ap-proach are compared and discussed.
2. Background
2.1. Binder and coating compounds
Cellulose derivatives such as hydroxypropyl methylcellulose (HPMC) and microcrystalline cellulose (MCC) are often used in granula-tion processes. Generally, HPMC is used as a protective colloid by coat-ing hydrophobic particles with multimolecular layer and promote wetting[8]. MCC is frequently used in pharmaceuticals as a binder/ diluent in oral tablet and capsule formulations[9]. Fatty acids such as stearic acid (SA) are often added to the cellulose derivatives to enhance specific properties. For example, adding SA to HPMC leads to a decrease in the water affinity due to SA hydrophobic properties caused by its con-tent of long-chains[10]. Stearic acid is also widely used in oral formula-tions as a tablet and capsule lubricant[11]. Another additive is the polyethylene glycol (PEG), which can be used in various polymerization grades. Their main advantage over fatty acids is their physical and ther-mal stability on storage. However, they are chemically more reactive than fats[12]and have only limited binding action when used alone. PEG are often used as plasticizers[13]or added to pharmaceutical mix-tures to improve their mechanical properties[14].
2.2. Theoretical models and equations
In order to predict the affinity between the different compounds, we need to calculate the work of adhesion and the ideal tensile strength. These quantities can be obtained using the Hildebrand[15]solubility
parameter δ which can be estimated by experimental methods or by using molecular simulation.
2.2.1. Hildebrand solubility parameter δ
As Barton[16]asserted in his handbook of solubility parameters, many properties of polymers can be related to the Hildebrand solubility parameter δ which is proportional to the square root of the cohesive en-ergy density ecoh. This parameter describes the intra- and intermolecular
forces of a substance. It can also be expressed in terms of the individual Hildebrand parameters describing two contributions to the cohesive energy, namely, the non-polar Van der Waals dispersion forces δd, and
the polar interactions (electrostatic) δp. Hydrogen bonding interactions
δhare included here in the polar contribution:
δ¼ ffiffiffiffiffiffiffiffiffiffiffiffiffiffiffiδdþ δp
q
: ð1Þ
Experimentally, there are numerous methods for Hildebrand solu-bility parameter determination such as the homomorph method[16], the maximum-in-swelling method often used for the determination of solubility parameters of crosslinked polymers[17], and inverse gas chromatography[18]. Many scientists including Hansen[19], Van Krevelen[20], Hoy[21]and Small[22]and recently Yamamoto (HSPiP
[23]) have proposed correlations and lists of contributions for various chemical groups.
In molecular simulation, the Hildebrand solubility parameter can be calculated from the pair potential by summing the pairwise interactions
[24]. The cohesive energy density is equal to minus the intermolecular energy, i.e. the intramolecular energy minus the total energy:
δ2k¼ bX n i¼1 Eki−EkcN NavbVcellN : ð2Þ
With n the number of molecules in the simulation cell, Navthe
Avogadro number, and k = 1, 2, are the van der Waals energy (disper-sion) and the coulombian energy (polar) respectively. “b N” denotes a time average over the duration of the dynamics in the canonical ensemble NVT, Vcellthe cell volume, the index “i” refers to the intramolecular energy
of the molecule i, and the index “c” represents the total energy of the cell. Calculation of the Hildebrand solubility parameter will permit us to esti-mate the work of adhesion and the ideal tensile strength.
2.2.2. The work of adhesion and cohesion
The energy required to separate unit areas of two surfaces A and B from contact is referred to as the work of adhesion (WAB), and for
surfaces of the same material, this is called the work of cohesion (WAA).
Girifalco and Good[25]have expressed the work of adhesion in terms of the surface free energy of the pure phases by:
WAB¼ 2ϕIϕVðγAγBÞ 1=2
: ð3Þ
Here, ϕIis a parameter that depends on the repulsive potential
constants, γAand γBare the surface free energy of material A and
ma-terial B respectively, ϕVis a parameter that depends on the molar
volume of the compounds. The full expression of this equation is given inAppendix A.
As stated by Wu[26], the utility of this equation is limited, because ϕI
is an empirical parameter and its calculation remains questionable es-pecially for polymers.
A similar expression of the work of adhesion was also proposed by Wu[26]:
WAB¼ 2φABðγAγBÞ 1=2
ð4Þ
where φABis a parameter that depends on the surface free energy and
the molar volume of each compound. The full expression of Wu's equa-tion is given inAppendix A.
However, this equation depends on the surface free energy which is obtained by time consuming experimental methods.
In this context, a relationship between solubility parameter and sur-face free energy was presented by Hildebrand in 1950[15]:
δ2v1=3
γ ¼ k: ð5Þ
In 1967, Gardon[27]asserted in his treatise that this equation rea-sonably holds for a variety of materials for which he assumed that k = 16. This constant k varies only between certain limits according to the type of molecules[16]and should be constant for a variety of mate-rials[28].
We will use this relationship inSection 4to develop equations of the work of adhesion as a function of the Hildebrand solubility parameter which we can estimate using molecular simulation.
2.2.3. The ideal tensile strength
The work of adhesion and the ideal tensile strength involve the same force by which two materials attract each other when an attempt is made to separate them. Whereas, the tensile strength divides this force by the cross section of the materials, the work of adhesion inte-grates this force through the distance between the materials. Gardon
[27]defined the tensile strength σABmaxas the maximum stress that can
support the interface between two materials A and B. He related it to the work of adhesion between two materials (A and B) separated by a potential equilibrium distance dAB0 :
σmaxAB ¼
1:03WAB
d0AB : ð6Þ
Gardon used Eq.(3)proposed by Girifalco and Good[25]into Eq.(5)
and, by expressing the equilibrium distance dAB0 as the distance between
the neighboring spherical sites of material A and material B, he ended up with the ideal tensile strength equation in terms of the solubility pa-rameter:
σmaxAB ¼ 0:2452ϕIϕV3=2δAδB: ð7Þ
Here, σABmaxis in J·cm−3and δ in (J·cm−3)1/2. These equations take
into consideration the parameter ϕVwhich takes into account the
differ-ent sizes of the interacting spherical sites.
Rowe[29]aimed at finding an expression for the ideal tensile strength in terms of the solubility parameter. He started with Gardon's expression (Eq.(6)) to obtain the ideal tensile strength using the work of adhesion. Then, he used Hildebrand's Eq.(5)
with a k value k = 16 to substitute the surface free energy by the
Hildebrand solubility parameter in Wu's Eq.(4). He ended up with the following expression:
σmaxAA ¼ 0:25δ 2 A; σ max BB ¼ 0:25δ 2 B and σ max AB ¼ 0:25φABδAδB J $ cm−3 # $ ð8Þ
where σAAmaxand σBBmaxare the ideal tensile strength for compound A
and compound B respectively, σABmaxis the maximum adhesive tensile
strength between A and B.
The application of Rowe's model to real systems was partially con-clusive at first because of the inaccuracy of the solubility parameter cal-culation approach that mixed Hoy and Van Krevelen group contribution methods[30]. Benali[31]adopted the same model but, instead of the group contribution methods, he used molecular simulation to calculate the solubility parameter. This approach provided better prediction of binary system affinity in accordance with experiments.
Furthermore, a closer examination of Rowe and Gardon's derivation shows two differences: the constant multiplier was approximated by Rowe from 0.2452 to 0.25. Furthermore, if we follow Rowe's derivation method from Gardon's[27]expression, we should obtain the following formula for the ideal tensile strength which differs from Rowe's Eq.(8)
by the factor ϕV: σmaxAB ¼ 0:2452φABδAδBϕ 1=2 V J $ cm −3 # $ : ð9Þ
The two equations (Eqs.(7) and (9)) are still based on the use of the constant k = 16 proposed by Gardon[27]. We will propose a more gen-eral expression inSubsection 4.1.
3. Materials and methods
3.1. Materials and their properties
The compounds chosen in this study are as follows: polyvinylpyrrol-idone (PVP), microcrystalline cellulose (MCC) (Avicel PH102), hydroxypropyl-methylcellulose (HPMC), ethyl cellulose (EC), niflumic acid (NA), purified stearic acid (SA), polyethylene glycol (PEG), cellu-lose acetate (CA), nitrocellucellu-lose (NC) and water. The molar parachor of polymer was calculated using correlation (B.2) inAppendix B. For acids and water we used the structural contribution method of Sugden
[32].
The properties of the different compounds are displayed inTable 1. FromTable 1, we can see that the agreement is reasonable between the values of the total surface free energy obtained by the parachor (see
Appendix B) method and those estimated experimentally from the con-tact angle method.
The aqueous solution used in coating and agglomeration processes is a multicomposite polymer dispersion. This includes the film forming polymer, insoluble or unstable film additives or surfactants to promote spreading, and plasticizers to impart flexibility, improve flow and re-duce brittleness. Thus, one of the major issues in the particle size en-largement process is the selection of suitable compounds and the elaboration of a stabilized dispersion (colloidal solution). The stability of these solutions strongly depends on the interactions between the constituents of the mixture in the presence of a solvent which is often water.
Once the coating or binder solution is sprayed onto the powders through the various unit processes, it will result in the formation of a continuous film on the surface of particles during the coating, or in the formation of solid bridges between the grains during agglomeration (seeFig. 1). The particles get closer during the drying process and the in-terparticle forces makes the particles eventually coalesce with each other, and cause the spheres to fuse, resulting in a coated film or solid bridges between the primary particles (seeFig. 2).
The properties of the final product depend on the affinity between the surface of the powder and the pulverized solution. It depends also on the interactions between the different components (polymers, fatty acids, solvent…) involved in the formulation of the composite coating agent.
In this article, we used the experimental finding of Laboulfie[14] re-garding the coating of solid particles by an aqueous solution containing HPMC as a matrix for film formation (67% of dried material), micronized SA as a hydrophobic filler (20% of dried material) and polyethylene gly-col as a plasticizer (13% of dried material).
During polymeric solution preparation (seeFig. 3), the hot aqueous solution of HPMC is mixed with the PEG plasticizer and the SA hydro-phobic filler. Then nucleation occurs as the particles gather together by affinity. Typically, hydrophobic SA particles gather away from water, whereas HPMC and PEG can dissolve in water. After cooling, the fine particles of SA will be stabilized by HPMC. HPMC polymer is able to form a gel network. This gel will entrap SA particles and prevent them from getting close in the range of attractive forces.
During film formation by drying, the evaporation of the interstitial water leads to the formation of liquid bridges between the HPMC poly-mer chains. The final composite film of HPMC and PEG incorporates crystal inclusions of PEG and SA[33](seeFig. 3). The presence of crystals of SA in the interstitial space between the molecules of HPMC reduces the interactions between the polymer chains and, therefore, prevents their coalescence. An increase in the drying temperature leads to the formation of smaller crystals of PEG in the liquid bridges. Thus, the lack of contact between the polymer chains due to the presence of SA crystals is replaced by the contact between HPMC and PEG molecules. This will improve the plastic properties of the dry coating film.
3.2. Molecular simulation
For the computation of the solubility parameters, we run molecular simulations in the canonical ensemble NVT with the Forcite® module of
the Material Studio Suite release 7[34]. Simulations are run over 500 ps with a time step of 1 fs. The temperature is set at T = 298 K and con-trolled by using a Nose Hoover thermostat. The experimental densities listed inTable 1are used to set the simulation box volume. Energy and pressure stability were checked. The last 50 ps is used for averaging potential energy components. The average cohesive energy is computed to derive the solubility parameter by using Eq.(2). The standard devia-tion method can be evaluated from the block averages' method[35].
Depending on the components, COMPASSII and PCFF forcefields were used with their predefined atom type parameters and the results were compared. Both molecular dynamic forcefields describe the ener-gy of interaction by adding an intramolecular contribution accounting for bond stretching, bending and torsion, and an intermolecular contri-bution term accounting for Van der Walls and coulombian interactions. Van der Waals interaction was truncated by a spline function after 15.5 Å. For the coulombian interaction, partial charges were assigned by the predefined forcefield equilibration method, while the Ewald summation was used to account for the long range interactions.
4. Affinity prediction model for binary and ternary mixtures The previous equations of the work of adhesion and the ideal tensile strength are only relevant to binary systems. In, this section, we will generalize these equations to our selected materials, and we will extend the ideal tensile strength to ternary systems. The resulting equations are then used to predict the affinity between granulation materials in bina-ry and ternabina-ry systems.
4.1. Generalization of the work of adhesion and tensile strength formula Rowe recognized that his model (Eq.(8)) was oversimplified and did not have a general validity[29]. We have already mentioned that Rowe's derivation should lead to Eq.(9)where a factor ϕV1/2was omitted
by Rowe. We can further generalize Rowe's equation by removing the
Table 1
Solubility parameter, surface free energy and density found in the literature. Compounds Density (g·cm−3) Surface free energy
(mJ·m−2). experiments
Surface free energy (mJ·m−2). parachor Solubility parameter (J·cm−3)1/2 Molar volume va (cm3·mol−1) γ γd γ δ PVP 1.25[44] 53.6[47] 28.4[47] 47.65 – 90.56 MCC 1.59[12] 53.1[31] 42.4[31] 50.48 29.3[49] 204.02 HPMC 1.26[31] 34[30] 17[30] 36.05 22.8[47] 338.49 EC 1.27[45] 35.8[30] 25[30] 31.75 19–21[16] 387.87 NA 1.56[45] 45.9[30] 26.2[30] 52.83 23.8[50] 180.90 SA 0.847[12] – – 26.94 17.6[47] 335.87 PEG200 1.127[46] 46.7[48] 43.5[48] 44.95 24[16] 172.32 PEG400 1.127[46] – – – – 353.59 CA 1.31[12] 45.9[44] – 42.64 24[16] 375.87 NC 1.6[44] 38[44] – 48.13 21.7[16] 371.41 Water 0.997[12] 72[31] 21.8[31] 81.29 47.9[16] 18.05
PVP: polyvinylpyrrolidone, MCC: microcrystalline cellulose, HPMC: hydroxypropyl-methylcellulose, EC: ethyl cellulose, NA: niflumic acid, SA: stearic acid, PEG: polyethylene glycol, CA: cellulose acetate, NC: nitrocellulose.
a The molar volume of each monomer is calculated from the ratio of the molecular weight to the density.
assumption that k = 16: The appropriate choice of the factor k should depend on the compound of interest. Hence, if we consider the general form of Hildebrand relationship:
δ¼ k0 γ v1=3 % &m or δ2¼ k γ v1=3 % &2m ð10Þ
where k′ = k1/2and m are constants that depend on the type of material,
γ in dynes·cm− 1, δ in (cal·cm− 3)0.5, v in cm3·mol− 1. We obtain the
general expressions of the ideal tensile strength:
σmaxAA ¼ 16:42 δA k0 A % &1=mA ð11Þ σmaxBB ¼ 16:42 δB k0 B % &1=mB ð12Þ σmaxAB ¼ 16:42φABϕ 1=2 V δB k0 B % &1=2mB δA k0 A % &1=2mA ð13Þ φAB¼ 2 xdAxdB gAxdAþ gBxdB þ x p Ax p B gAxpAþ gBxpB ! : ð14Þ With xd i ¼ δd δ % &1=m ; xpi ¼ 1−xdi ð15Þ gA¼ δ1=mA A k 01=mB B v 1=3 A δ1=mB B k01=mA Av 1=3 B and gB¼ 1 gA ð16Þ
where σABmaxis in J·cm−3and δ in cal1/2·cm−3/2, xipand xidare the polar
and the nonpolar fraction of material i (i = A or B). We use Eq.(13)to
calculate the adhesive tensile strength for binary mixtures. For the same material, we use Eq.(11)describing mutual cohesion. Here k′ and m have to be determined for each type of material.
Following the same route of computation, the work of adhesion de-scribed by Eq.(4)becomes:
WAB¼ 2φAB δA k0 A % &1=2mA δB k0 B % &1=2mB vAvB ð Þ1=6 ð17Þ
where WABis in mJ·m−2, δ in cal1/2·cm−3/2and v in cm−3·mol−1.
4.2. Extension of the ideal tensile strength model to ternary systems In this section, we extend relationship(9)proposed by Gardon for the ideal tensile strength for a binary mixture in vacuum to ternary mix-tures where the substrates are dispersed in a third medium.
According to Israelachvili[36], the work of adhesion between two products A and B in a medium C is related to the process of building A–B agglomerates (adhesion of A and B alone) in a medium C (cohesion of C alone) against the solubilization of A and B in C (work of adhesion of A and C, and B and C respectively). It has the following form:
WACB¼ WABþ WCC−WAC−WBC: ð18Þ
Similarly, the work of cohesion of A in a medium C is given by: WACA¼ WAAþ WCC−2WAC: ð19Þ
By implementing the equation of work of adhesion in a third medium given by Israelachvili[36]in the process of resolution followed by Gardon[27], we derive the relationship between the total work of adhesion WACBand the ideal tensile strength σACBmaxin third medium,
along with an expression of the equilibrium distance at zero potential energy dACB0 : σmaxACB¼ 1:0263WACB d0ACB J $ cm −3 # $ ð20Þ
Fig. 3. Coating preparation steps of HPMC–SA–PEG1500 mixture placed in water, HPMC: hydroxypropyl-methylcellulose, SA: stearic acid, PEG1500: polyethylene glycol 1500.
d0ACB¼ 0:629 & 10−8 σ max AB v1=3A þ v 1=3 B # $9 þ σmaxCC 2v1=3C # $9 −σmaxAC v1=3A þ v 1=3 C # $9 −σmaxBC v1=3A þ v 1=3 C # $9 σmaxAB v 1=3 A þ v 1=3 B # $3 þ σmaxCC 2v 1=3 C # $3 −σmaxAC v 1=3 A þ v 1=3 C # $3 −σmaxBC v 1=3 B þ v 1=3 C # $3 0 B @ 1 C A 1=6 ð Þ : ð21Þ
The detailed demonstration is given inAppendix B. Using Eq.(18), Eq.(20)can be rewritten as:
σmaxACB ¼
1:0263 Wð ABþ WCC−WAC−WBCÞ
d0ACB ¼
d0ABσmaxAB þ d0CCσmaxCC −d0ACσmaxAC −d0BCσmaxBC
# $
d0ACB : ð22Þ
Combining Eqs.(21) and (22), we obtain:
σmaxACB¼ σmaxAB v1=3A þ v 1=3 B # $ þ 2σmaxCC v1=3C # $ −σmaxAC v1=3A þ v 1=3 C # $ −σmaxBC v1=3B þ v 1=3 C # $ # $ σmax AB v 1=3 A þv 1=3 B ð Þ9 þσmax CC 2v 1=3 C ð Þ9 −σmaxAC v 1=3 A þv 1=3 C ð Þ9 −σmaxBC v 1=3 A þv 1=3 C ð Þ9 σmax AB v 1=3 A þv 1=3 B ð Þ3 þσmax CC 2v 1=3 C ð Þ3 −σmaxAC v 1=3 A þv 1=3 C ð Þ3 −σmaxBC v 1=3 B þv 1=3 C ð Þ3 % &ð1=6Þ : ð23Þ
According to Eq.(20), the ideal tensile strength σACBmaxis proportional
to the work of adhesion WACB, thus, by analogy with the conclusions of
Barra[30]and Benali[31], we can state that in a ternary system (see alsoFig. 4):
• If σACBmaxN 0: one of the compounds is partially spread over the other, and C (water for example) does not spread between A and B; • If σACBmaxb 0: medium C will displace compound B and “spread on” or
“totally wet” the surface of A
• If σACBmaxb σACAmaxb σBCBmax: both compounds tend to mix, no interaction
between them
• If σACAmaxb σACBmaxb σBCBmax: compound A will surround compound B in
solvent C
• If σBCBmaxb σACBmaxb σACAmax: compound B will surround compound A in
solvent C.
The same predictions were stated by Israelachvili[36]but in terms of the work of adhesion of two compounds placed in a third medium.
5. Model application and discussion
Before applying the above equations to predict the affinity in binary and ternary systems, we discuss the values of the solubility parameters.
5.1. Solubility parameter calculated by different methods
Table 2compares experimental solubility parameters with those predicted by the Yamamoto method[23]and by molecular simulation.
Table 2
Solubility parameters calculated by different methods.
Solubility parameter (J·cm−3)1/2 Group contribution Molecular simulation forcefields Exp.
HSPiP COMPASSII PCFF Compounds δ δd δ δd δ δd δ PVP 21.2 18.5 21.12 ± 0.16 19.45 ± 0.18 19.77 ± 0.11 17.60 ± 0.10 – MCC 29.2 18.8 29.98 ± 0.24 17.04 ± 0.32 28.12 ± 0.13 20.71 ± 0.16 29.3[49] HPMC 20.2 17.1 20.68 ± 0.13 17.03 ± 0.14 20.98 ± 0.10 18.39 ± 0.09 22.8[47] EC 18.8 16.7 19.61 ± 0.15 18.73 ± 0.15 16.08 ± 0.08 15.46 ± 0.07 19–21[16] NA 21.9 19.3 25.40 ± 0.19 21.97 ± 0.23 23.73 ± 0.56 20.23 ± 0.43 23.8[50] SA 17.5 16.3 18.61 ± 0.22 16.75 ± 0.26 19.89 ± 0.26 17.72 ± 0.28 17.6[47] PEG200 24.4 16.4 26.54 ± 0.22 19.27 ± 0.24 26.18 ± 0.39 20.91 ± 0.32 24[16] PEG400 19.0 14.6 22.88 ± 0.24 20.17 ± 0.24 24.07 ± 0.16 22.51 ± 0.17 – CA 24.4 18.0 20.98 ± 0.22 17.74 ± 0.21 23.17 ± 0.19 21.54 ± 0.18 24[16] NC 25.0 17.9 22.34 ± 0.41 17.00 ± 0.28 110.13 ± 0.13 26.88 ± 0.17 21.7[16] Water 47.8 15.5 47.78 ± 0.59 – 47.33 ± 0.20 5.89 ± 1.98 47.9[16]
PVP: polyvinylpyrrolidone, MCC: microcrystalline cellulose, HPMC: hydroxypropyl-methylcellulose, EC: ethyl cellulose, NA: niflumic acid, SA: stearic acid, PEG: polyethylene glycol, CA: cellulose acetate, NC: nitrocellulose.
Fig. 5. Variation of Hildebrand solubility parameter versus number of repetition unit of polymers.
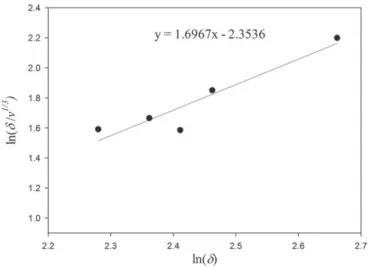
Fig. 6. Logarithm of the ratio γ/v1/3plotted against the logarithm of the Hildebrand
solubil-ity parameters δ. δ in (cal·cm−3)1/2and surface tension γ in mJ·m−2. γ and δ of celluloses
For the molecular simulation of polymers, the number of repeating unit was chosen so that the solubility parameter remains constant in case of further increasing of the repeating unit. Results are displayed inFig. 5. The number of repetition unit was fixed to 8 for MCC, PVP and EC, and 5 for HPMC.
The average value of the cohesive energy density is obtained for all compounds from the last 50 picoseconds (ps) of the 500 ps dynamic simulation, spanning 500,000 time steps. However, getting a good esti-mation of the average standard deviation in molecular dynamics simu-lation requires typically over several millions of time steps, which are
practically difficult to obtain in a reasonable lapse of time. Indeed, the average standard deviation must be computed over uncorrelated frames. This can be achieved by using the block average variance method[35]. Its application to simple system, like Lennard Jones fluids[37]shows that the average standard deviation over uncorre-lated frames is at least one order of magnitude greater than the stan-dard deviation computed directly from the molecular dynamics frame trajectory. Its application to the real systems we studied was not possible in a reasonable lapse of time; therefore we estimated the average standard deviation as ten times the standard error given by Forcite[34].
The number of molecules distributed initially in the simulation cell has very little effect on the values of the solubility parameters[31]. Generally four polymer chains are sufficient, although for very high molecular weights even one chain can be adequate[24]. We have 10 molecules per cell for PVP, MCC, PEG400 and SA, 8 molecules per cell for HPMC, 6 molecules per cell for CA and NC, 30 molecules per cell for NA, 40 molecules per cell for PEG200 and 100 molecules per cell for water. Larger number will increase the computational effort.
Table 2shows that experimental Hildebrand solubility parame-ters are close to the COMPASSII forcefield and HSPiP results. Concerning water, only the PCFF forcefield gives a dispersive contri-bution to the solubility parameter, consequently, in this study, we will compare the solubility parameter predictions obtained from HSPiP and COMPASSII forcefield, except for water where we will use PCFF forcefield values.
Table 3
Work of cohesion in mJ·m−2calculated using different correlations.
Solubility parameter (J·cm−3)1/2 Work of cohesion WAA(mJ·m−2) COMPASSII Gardon[27,28] k′ = 4 m = 0.5 k′ = 4.38a Hildebrand[15] k′ = 4.1 m = 0.43 Sheldon[39] Eq(24) k′ = 5.93 m = 0.45 Bonn[38] k′ = 3.39 m = 0.5 This work Eq(25) k′ = 4 m = 0.59 WAA= 2γ Exp.b δ δd PVP 21.12 19.45 59.75 76.82 30.75 83.19 44.86 107.2 MCC 29.98 17.04 158.01 227.69 87.90 219.99 106.73 106.2 HPMC 20.68 17.03 89.01 113.65 45.59 123.92 67.26 68.0 EC 19.61 18.73 83.75 105.10 42.40 116.60 64.31 71.6 NA 25.40 21.97 108.96 148.76 58.42 151.70 77.38 91.8 SA 18.61 16.75 71.89 88.70 35.97 100.09 56.09 – PEG200 26.54 19.27 117.05 162.10 63.38 162.97 82.03 93.4 PEG400 22.88 20.17 110.55 145.87 57.91 153.91 81.02 – Water 47.33c 5.89c 175.48 293.39 108.05 244.32 103.25 144.0
PVP: polyvinylpyrrolidone, MCC: microcrystalline cellulose, HPMC: hydroxypropyl-methylcellulose, EC: ethyl cellulose, NA: niflumic acid, SA: stearic acid, PEG: polyethylene glycol.
aOnly for water.
b Calculated using the experimental interfacial tension γ given inTable 1. c
PCFF forcefield.
Table 4
Cohesion work (diagonal) and adhesion work in mJ·m−2in the binary mixture calculated
using the solubility parameter obtained from COMPASSII forcefield.
Compounds PVP MCC HPMC EC NA SA PEG200 PEG400 PVP 83.19 MCC 72.85 106.73 HPMC 66.87 69.40 67.26 EC 64.95 56.39 61.05 64.31 NA 90.58 91.02 68.21 63.14 108.96 SA 76.32 70.78 66.11 63.00 81.00 71.89 PEG200 73.29 87.10 71.39 60.92 81.62 71.71 82.03 PEG400 79.51 74.53 71.79 68.46 82.52 75.96 76.60 81.02 PVP: polyvinylpyrrolidone, MCC: microcrystalline cellulose, HPMC: hydroxypropyl-methylcellulose, EC: ethyl cellulose, NA: niflumic acid, SA: stearic acid, PEG: polyethylene glycol.
Table 5
Cohesion work (diagonal) and adhesion work in mJ·m−2in the binary mixture calculated
using the solubility parameter obtained from HSPiP method.
Compounds PVP MCC HPMC EC NA SA PEG200 PEG400 PVP 83.82 MCC 84.33 102.06 HPMC 65.97 68.66 64.63 EC 61.03 61.97 61.65 59.87 NA 82.32 82.02 65.77 61.10 81.00 SA 69.15 65.91 61.50 59.14 68.82 63.57 PEG200 67.36 79.83 63.25 57.87 66.27 56.63 71.12 PEG400 59.60 65.96 60.61 57.08 59.31 54.63 62.68 59.10 PVP: polyvinylpyrrolidone, MCC: microcrystalline cellulose, HPMC: hydroxypropyl-methylcellulose, EC: ethyl cellulose, NA: niflumic acid, SA: stearic acid, PEG: polyethylene glycol.
Table 6
The ideal tensile strength in binary mixtures in J·cm−3calculated using the solubility
parameter obtained from COMPASSII forcefield.
Compounds PVP MCC HPMC EC NA SA PEG200 PEG400 PVP 152.07 MCC 115.18 148.66 HPMC 95.73 88.53 79.14 EC 90.44 70.17 70.20 72.31 NA 146.48 129.32 88.60 79.97 157.98 SA 109.45 90.42 77.88 72.54 105.37 84.81 PEG200 119.59 124.73 93.41 77.71 119.30 93.97 120.87 PEG400 112.84 94.33 83.85 78.16 106.34 88.84 99.42 93.96 PVP: polyvinylpyrrolidone, MCC: microcrystalline cellulose, HPMC: hydroxypropyl-methylcellulose, EC: ethyl cellulose, NA: niflumic acid, SA: stearic acid, PEG: polyethylene glycol.
5.2. Relationship between solubility parameter and surface free energy for cellulose derivatives
For computing the work of adhesion (Eq. (17)), we need to select constants k′ and m that come from Eq.(10). Hildebrand[15]
used k′ = 4.1 and m = 0.43 when δ is in cal1/2·cm−3/2. Gardon[27]
pro-posed k = 16 (k′ = 4) and m = 0.5 for organic acids and molten metals, which gave an error on the ideal tensile strength usually below 25% for the systems he studied. For water he proposed (k′ =4.376) and m = 0.5. From simple statistical thermodynamic considerations, Bonn[38] relat-ed the solubility of polymers to the surface tension and obtainrelat-ed k = 11.5 (k′ = 3.39) by regression analysis. For compounds which do not
contain OH, COOH and a COH groups, Sheldon[39]proposed k = 14.0 (k′ = 3.74) with m = 1, and k = 35.13 (k′ =5.927) with m = 0.45 oth-erwise:
δ2¼ 14γ=v
1=3 if nOH þ nCOOH þ nCOH ¼ 0
35:13γ=v0:45 otherwise (
: ð24Þ
For cellulose polymers, we regress an expression by using the Hildebrand solubility parameter values over the data of 5 compounds; MCC, HPMC, EC, CA and NC. The theoretical best fit line is shown inFig. 6.
The following expression was obtained:
δ¼ 4:00 #γ=v1=3$0:59 #cal $ cm−3$1=2: ð25Þ
Table 3collects the prediction of the work of cohesion calculated using the various correlations cited above and compares them with the experimental values of the work of cohesion WAA= 2γ (for when
A = B). The solubility parameter in the correlations is obtained by mo-lecular simulation using the COMPASSII forcefield.
InTable 3, the results obtained using Eq.(25)are close to the ex-perimental values for MCC, HPMC, EC and PEG. Gardon's[28] corre-lation is close to the experimental values for acids and water. For PVP, Bonn's [38] correlation is the closest. Therefore, we select the corresponding best fit values: k′ = 4 for acids, k′ = 3.01 for PVP, k′ = 4.376 for water, and Eq.(25)for the celluloses derivatives and PEG.
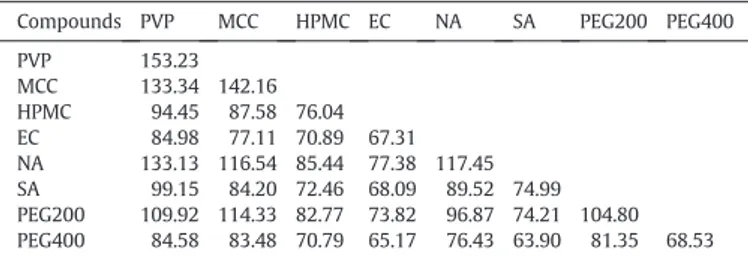
Table 7
The ideal tensile strength in binary mixtures in J·cm−3calculated using the solubility
parameter obtained from HSPiP method.
Compounds PVP MCC HPMC EC NA SA PEG200 PEG400 PVP 153.23 MCC 133.34 142.16 HPMC 94.45 87.58 76.04 EC 84.98 77.11 70.89 67.31 NA 133.13 116.54 85.44 77.38 117.45 SA 99.15 84.20 72.46 68.09 89.52 74.99 PEG200 109.92 114.33 82.77 73.82 96.87 74.21 104.80 PEG400 84.58 83.48 70.79 65.17 76.43 63.90 81.35 68.53 PVP: polyvinylpyrrolidone, MCC: microcrystalline cellulose, HPMC: hydroxypropyl-methylcellulose, EC: ethyl cellulose, NA: niflumic acid, SA: stearic acid, PEG: polyethylene glycol.
Table 8
Interactions predicted for PVP and MCC.
A B
PVP MCC
Exp. obs. WABexp. WABHSPiP σABHSPiP WABcompassII σABcompassII Exp. obs. WABexp. WABHSPiP σABHSPiP WABcompassII σABcompassII
PVP – – – – – – M O M M M MCC M X M M M – – – – – – HPMC O O O M O O[31] O O O O O EC O O O O O O O O M M NA O O O X M M O M M M SA O O O O O O M O PEG200 M M O M M O O O O O PEG400 O O M O O O M O
PVP: polyvinylpyrrolidone, MCC: microcrystalline cellulose, HPMC: hydroxypropyl-methylcellulose, EC: ethyl cellulose, NA: niflumic acid, SA: stearic acid, PEG: polyethylene glycol. O: A surrounds B, X: B surrounds A, M: no interactions between A and B.
Table 9
Interactions predicted for HPMC and EC.
A B
HPMC EC
Exp. obs. WABexp. WABHSPiP σABHSPiP WABcompassII σABcompassII Exp. obs. WABexp. WABHSPiP σABHSPiP WABcompassII σABcompassII
PVP X X X M X X X X X X MCC X[31] X X X X X X X X M M HPMC – – – – – – M[30] M X X M M EC M[30] M O O M M – – – – – – NA X[30] X X X X X M[30] X X X M X SA M M M M M X M X PEG200 X[14] M M X X X M M X M X PEG400 O O X X M M X X
PVP: polyvinylpyrrolidone, MCC: microcrystalline cellulose, HPMC: hydroxypropyl-methylcellulose, EC: ethyl cellulose, NA: niflumic acid, SA: stearic acid, PEG: polyethylene glycol. O: A surrounds B, X: B surrounds A, M: no interactions between A and B.
5.3. Prediction of the interactions in binary mixture
By using the k′ and m values in Eq.(17), we calculate the work of ad-hesion and coad-hesion in a binary system. The results obtained by molec-ular simulations and by Yamamoto's molecmolec-ular breaking method (HSPiP) are presented inTables 4 and 5respectively.
We can also calculate the ideal tensile strength in binary mixtures by using Eq.(13). The ideal tensile strength values obtained by molecular simulation are shown in Table 6, and those obtained using the Yamamoto's molecular breaking method (HSPiP) are presented in
Table 7.
By comparing the adhesion and cohesion work values (Tables 4 and 5) and the ideal tensile strength results (Tables 6 and 7), we predict the affinity between the different compounds (Tables 8, 9, 10 and 11). The adhesive and the tensile approach being derived from the same core show similar predictions.
In all cases, we have WHPMC–HPMCb WHPMC–NAb WNA–NA, this means
that HPMC will adhere over the particles of NA. Moreover, as first ob-served experimentally by Barra[30], and recently reviewed by Benali
[31], HPMC particles surround NA particles.
According to the work of adhesion predictions obtained on the basis of molecular simulation, the particles of EC interact neither with NA nor with HPMC (Table 9). This was also observed by Barra[30]. However, the tensile approach predicts that the particles of EC tend to adhere over the particles of NA (Table 9). This suggests that the adhesion approach gives more accurate predictions than the tensile approach. It's worth mentioning here that Barra observed also a low interaction between NA and EC for medium sized particles, where EC tends to ad-here over the particle of NA, which may explain the disagreement be-tween the predictions obtained with the adhesion approach and those obtained with the tensile strength approach in the case of the couple EC–NA.
Table 10
Interactions predicted for NA and SA.
A B
NA SA
Exp. obs. WABexp. WABHSPiP σABHSPiP WABcompassII σABcompassII Exp. obs. WABexp. WABHSPiP σABHSPiP WABcompassII σABcompassII
PVP X X X O M X X X X MCC M X M M M X X M X HPMC O[30] O O O O O M M M M EC M[30] O O O M O M O M O NA – – – – – – X X X X SA O O O O – – – – – – PEG200 M M M M M M[14] M M M X PEG400 O O O O M M X X
PVP: polyvinylpyrrolidone, MCC: microcrystalline cellulose, HPMC: hydroxypropyl-methylcellulose, EC: ethyl cellulose, NA: niflumic acid, SA: stearic acid, PEG: polyethylene glycol. O: A surrounds B, X: B surrounds A, M: no interactions between A and B.
Table 11
Interactions predicted for PEG200 and PEG400.
A B
PEG200 PEG400
Exp. obs. WABexp. WABHSPiP σABHSPiP WABcompassII σABcompassII Exp. obs. WABexp. WABHSPiP σABHSPiP WABcompassII σABcompassII
PVP M M X M M X X M X MCC X X X X X X X M X HPMC O[14] M M O O O X X O O EC M M O M O M M O O NA M M M M M X X X X SA M[14] M M M O M M O O PEG200 – – – – – – X X M X PEG400 O O M O – – – – – –
PVP: polyvinylpyrrolidone, MCC: microcrystalline cellulose, HPMC: hydroxypropyl-methylcellulose, EC: ethyl cellulose, NA: niflumic acid, SA: stearic acid, PEG: polyethylene glycol. O: A surrounds B, X: B surrounds A, M: no interactions between A and B.
Table 12
Cohesion work (diagonal) and adhesion work in mJ·m−2of the compounds dispersed in water, calculated using the solubility parameter obtained from COMPASSII and PCFF forcefields.
Compounds PVP MCC HPMC EC NA SA PEG200 PEG400
PVP 181.54 MCC 114.68 92.04 HPMC 162.00 108.01 159.17 EC 174.51 109.43 167.39 185.08 NA 166.24 110.16 140.65 150.01 161.93 SA 174.22 112.16 160.79 172.11 156.21 169.34 PEG200 150.65 107.94 145.53 149.49 136.29 148.62 138.40 PEG400 176.76 115.26 165.82 176.92 157.08 172.76 152.86 177.17
Moreover, the predictive results based upon both approaches (tensile strength and work of adhesion approach) indicate that HPMC would be a good binder for MCC substrate (Table 9) and consequently will produce rigid agglomerates. In their work on the interactions be-tween HPMC and MCC, Benali[31]and Lovorka et al.[40]arrived to the same conclusion.
However, no interactions are observed in the case of HPMC–SA mix-ture which may results in friable agglomerate or coating film. To im-prove the properties of this mixture, one way is to add another compound compatible with SA and HPMC. Predictions obtained using molecular simulation show good affinity between PEG400 and both HPMC and SA (seeTable 11). One could suspect that the addition of PEG400 to the SA–HPMC mixture should indirectly improve the consis-tency of the resulting agglomerate. This actually corresponds to the con-clusions of Laboulfie et al.[33]where they stated that adding PEG to the HPMC–SA mixture will enhance the mechanical properties of the resulting composite coating.
In the light of the previous analyses, we conclude that the predic-tions obtained on the basis of molecular simulation calculapredic-tions repro-duce the available experimental observations, especially in the case of the adhesion work approach.
5.4. Prediction of the interactions in aqueous system: dispersion of substrate in a third medium
The work of adhesion and cohesion of different polymers and acids placed in water are calculated using the Israelachivili's relationships
(18) and (19). The results based upon molecular simulation are present-ed inTable 12, and those obtained using the Yamamoto's molecular breaking method (HSPiP) are presented inTable 13.
We notice that the work of adhesion is positive for all the mate-rials. Following Israelachivili's[36]conclusions, all the compounds should aggregate in water; furthermore, the water doesn't penetrate between the compounds which means that there is a spreading of one of the compounds over the other, or that the two compounds will self-associate in water without interacting. This can be explained by the high cohesive energy between water molecules, i.e. the interactions between them are much more attractive than their attraction with the other molecules.
The ideal tensile strength in ternary mixtures is calculated by using Eq.(23). The results based upon molecular simulation are presented inTable 14and those obtained using the Yamamoto's molecular break-ing method (HSPiP) are presented inTable 15.
First, we notice that the cohesion work and adhesion work in water obtained using the HSPiP data are much smaller than those obtained with COMPASSII and PCFF forcefield data. We state that this happens because the PCFF forcefield underestimates the dispersive contribution of the solubility parameter of water compared to HSPiP (seeTable 2).
Regarding the prediction of affinity, for all methods, MCC has the lowest work of adhesion and cohesion in water, this imply that for all the mixtures, MCC will most likely adhere on the surface of the other compounds when they are dispersed in water.
The magnitude of interaction and therefore the affinity between compound A and compound B in a medium C is proportional to minus WBAC(WBAC= WACA− WACB). This also means that, in the
presence of water, if minus WBACis high, the film formed in the
sur-face of the stronger cohesive material will be thicker; this is identi-fied in the case of the couple MCC–EC where minus WMCC–EC–Water
is the highest (Table 12).
Table 13
Cohesion work (diagonal) and adhesion work in mJ·m−2of the compounds dispersed in
water, calculated using the solubility parameter obtained from HSPiP.
Compounds PVP MCC HPMC EC NA SA PEG200 PEG400 PVP 119.55 MCC 88.89 75.45 HPMC 114.55 86.07 126.06 EC 115.06 84.83 128.53 132.20 NA 120.80 89.33 117.10 117.88 122.23 SA 122.11 87.70 127.31 130.40 124.53 133.76 PEG200 100.45 81.75 109.19 109.26 102.11 106.95 101.57 PEG400 107.68 82.87 121.54 123.46 110.14 119.94 108.12 119.53 PVP: polyvinylpyrrolidone, MCC: microcrystalline cellulose, HPMC: hydroxypropyl-methylcellulose, EC: ethyl cellulose, NA: niflumic acid, SA: stearic acid, PEG: polyethylene glycol.
Table 14
The ideal tensile strength in ternary mixtures in J·cm−3of the compounds dispersed in water, calculated using the solubility parameter obtained from COMPASSII and PCFF forcefields.
Compounds PVP MCC HPMC EC NA SA PEG200 PEG400
PVP 347.85 MCC 174.82 115.83 HPMC 237.51 129.15 186.14 EC 251.79 129.36 194.13 212.39 NA 272.13 146.06 179.71 190.08 230.28 SA 255.73 135.19 188.86 200.41 201.09 199.8 PEG200 250.37 144.06 188.00 191.34 194.47 192.97 199.70 PEG400 256.15 138.00 192.88 203.80 200.10 201.82 196.44 204.99
PVP: polyvinylpyrrolidone, MCC: microcrystalline cellulose, HPMC: hydroxypropyl-methylcellulose, EC: ethyl cellulose, NA: niflumic acid, SA: stearic acid, PEG: polyethylene glycol.
Table 15
The ideal tensile strength in ternary mixtures in J·cm−3of the compounds dispersed in water, calculated using the solubility parameter obtained from HSPiP method.
Compounds PVP MCC HPMC EC NA SA PEG200 PEG400
PVP 216.01 MCC 128.03 91.87 HPMC 158.70 97.75 140.85 EC 155.78 93.73 140.93 142.42 NA 189.93 114.04 144.22 142.08 169.4 SA 171.04 100.22 143.06 143.87 155.25 151.84 PEG200 156.50 103.41 134.05 131.13 139.39 131.57 139.40 PEG400 146.84 92.52 133.99 133.52 133.24 132.52 131.31 130.34
On the basis of the previous tables (Tables 12, 13, 14 and 15), we can predict the affinity of our ternary systems (Tables 16, 17, 18 and 19).
Although they differ from the type of input data that they use (HSPiP vs. COMPASSII/PCFF forcefield), both solubility parameter calculation methods tend to give similar predictions.
Overall, the affinities, obtained through the ideal tensile strength and the work of adhesion based upon molecular simulation, are similar in 75% of the systems.
As expected, because of their low cohesion strength in water, MCC molecules surround the other compounds (Table 16). This also can be explained by the high hydrophilic character of the MCC.
Also, in the case of HPMC–SA, whereas no interactions are observed between SA and HPMC in the absence of water (Table 9), HPMC will ad-here on the surface of SA (Table 17) when they are placed in water. It's a rather foreseeable result, since HPMC is a hydrophilic polymer and SA is a hydrophobic acid. In practice, a clear solution is obtained by dispersing HPMC in water, whereas, a white colored solution is obtained for HPMC–SA mixture in water. As explained by Laboulfie[33], HPMC will generate a repulsive force on the surface of SA which will stabilize the mixture and prevent the agglomeration of SA particles, thus explaining the behavior that we sketched inFig. 3.
The same conclusions are obtained for the couple HPMC–EC: HPMC will surround the hydrophobic particles of EC.
According to the tensile approach calculated using molecular simu-lation, there is no interactions between SA and PEG200 nor between EC and PEG200 (Table 19). On the other hand, the adhesion approach predicts that PEG200 will adhere over SA and over EC when placed in water which is in accordance with the fact that PEG200 is a hydrophilic polymer and SA and EC are both hydrophobic.
These conclusions lead to the suggestion that the work of adhesion approach may give better predictions than the tensile strength ap-proach. Furthermore, the polarity of PEG400 is lower than that of PEG200, which means that PEG400 is less hydrophobic than PEG200. This was actually observed by Oelmeier[41]who stated that PEG with higher molecular weight have lower polarity and hence are less hydro-philic. This implies that, as we shift from PEG200 to PEG400, HPMC par-ticles should surround PEG, and, as shown inTable 17, this is predicted by the work of adhesion approach. This was also observed experimen-tally by Laboulfie[33]for PEG1500. Additionally, the adhesion work ap-proach predicts that PEG200 surrounds PEG400 which is in adequacy with the previous statements.
6. Conclusion
In this study, two approaches to predict the affinity between poly-mers and acid in binary mixture were analyzed and compared; the ten-sile strength approach and the work of adhesion approach. To extend the study to any compounds used in coating and granulation processes, the work of adhesion and the tensile strength formula were generalized with the inclusion of Hildebrand's solubility parameter. A correlation between surface free energy and solubility parameter for cellulose de-rivative was proposed. It yielded values for the work of cohesion in good agreement with those measured.
In the case of a ternary mixture, we derived an equation for the ideal tensile strength. This equation hints at which compound would predominantly surround the other in ternary mixtures.
The two models were applied to binary and ternary systems. The binary mixtures included a film forming polymer (HPMC), a hydropho-bic filler (SA), a plasticizer (PEG), a binder/diluant (EC and MCC) and a
Table 16
Interactions predicted for PVP and MCC.
A B PVP MCC WACB CompassII σACB CompassII WACB HSPiP σACB HSPiP WACB CompassII σACB CompassII WACB HSPiP σACB HSPiP PVP – – – – X X X X MCC O O O O – – – – HPMC O O M O X X X X EC M O M O X X X X NA O O X O X X X X SA O O X O X X X X PEG200 O O M O X X X X PEG400 M X M O X X X X
PVP: polyvinylpyrrolidone, MCC: microcrystalline cellulose, HPMC: hydroxypropyl-methylcellulose, EC: ethyl cellulose, NA: niflumic acid, SA: stearic acid, PEG: polyethylene glycol.
O: A surrounds B, X: B surrounds A, M: no interactions between A and B.
Table 17
Interactions predicted for HPMC and EC.
A B HPMC EC WACB CompassII σACB CompassII WACB HSPiP σACB HSPiP WACB CompassII σACB CompassII WACB HSPiP σACB HSPiP PVP X X M X M X M X MCC O O O O O O O O HPMC – – – – O O O O EC X X X X – – – – NA M M M X M M M M SA X X X X O O M X PEG200 O X O M O M O M PEG400 X X O O M M O O
PVP: polyvinylpyrrolidone, MCC: microcrystalline cellulose, HPMC: hydroxypropyl-methylcellulose, EC: ethyl cellulose, NA: niflumic acid, SA: stearic acid, PEG: polyethylene glycol.
O: A surrounds B, X: B surrounds A, M: no interactions between A and B.
Table 18
Interactions predicted for NA and SA.
A B
NA SA
WACB CompassII
σACB CompassII WACB HSPiP
σACB HSPiP WACB CompassII
σACB CompassII WACB HSPiP σACB HSPiP PVP X X O X X X O X MCC O O O O O O O O HPMC M M M O O O O O EC M M M M X X M O NA – – – – M X O X SA M O X O – – – – PEG200 M M O M O M O M PEG400 M M M O X X O O
PVP: polyvinylpyrrolidone, MCC: microcrystalline cellulose, HPMC: hydroxypropyl-methylcellulose, EC: ethyl cellulose, NA: niflumic acid, SA: stearic acid, PEG: polyethylene glycol. O: A surrounds B, X: B surrounds A, M: no interactions between A and B.
pharmaceutical drug (NA). In ternary systems, water was added as a sol-vent to the previous mixtures. The two models gave similar results in good agreement with the available experimental observations overall, but the work of adhesion approach might give more accurate predic-tions than the ideal tensile strength approach. The prediction obtained using the work of adhesion confirmed the experimental observations of Laboulfie et al.[33]: SA particles are stabilized by HPMC particles in water. Also, the addition of PEG400 to the mixture holds the SA and HPMC particles together and consequently enhance the consistency of the formed hydrophobic film. The affinity between particles in aqueous systems is better when their interfacial nature is the opposite.
Appendix A. Work of adhesion equations
The full expressions of the work of adhesion given by Girifalco and Good[25]and Wu[26]are shown in the following table:
Here, inTable A.1, in Girifalco and Good expression, the ε's are the re-pulsive potential constants, vAand vBthe molar volumes of materials A
and B respectively, γAand γBare the surface free energy of A and B
re-spectively. For polymer molecules, it's better to interpret v as the molar volume of the polymer segment or the repeat unit[16].
In the expression of the work of adhesion proposed by Wu, xipand xid
are the polar and the nonpolar fraction of phase i, and the ratios gAand
gBare defined by the ratio of the surface free energy.
Appendix B. Surface free energy calculation using the molar parachor
The surface free energy is the thermodynamic work to be done per unit area of surface extension and as such is a manifestation of the intermolecular forces. Its value can be obtained indirectly from contact angle measurement of two liquids of known polarity or from empirical correlations to estimate the surface free energy. For polymers we have used the correlation with the molar parachor P[32]:
γ¼ P v % &4
: ðB:1Þ
Here, γ is the surface free energy and v is the molar volume. P ¼ 3:989792VWþ Nps0:502094 ðB:2Þ
where VWis the Van der Waals volume and Npsis a correction term:
Nps¼ −3NðcarbonatomswithΩ¼ΩvÞþ 6NðcarbonylsgroupsÞþ 16Nð−S−Þ
þ 6NBr−6NF: ðB:3Þ
Here, N(carbon atoms with Ω = Ωv)equals to the number of carbon atoms
which are singly bonded to all of their neighbors, N(carbonyl groups)is the
total number of carbonyl (\C_O), N(\S\), NBrand NFare the numbers
of sulfur atoms in the lowest (divalent) oxidation state, bromine atoms, and fluorine atoms, respectively, in the repeat unit. For non-polymer compounds, we used the structural contribution method of Sugden found in Bicerano Book[32].
Table 19
Interactions predicted for PEG200 and PEG400.
A B
PEG200 PEG400
WACB CompassII
σACB CompassII WACB HSPiP
σACB HSPiP WACB CompassII
σACB CompassII WACB HSPiP σACB HSPiP PVP X X M X M X M O MCC O O O O O O O O HPMC X O X M O O X X EC X M X M M M X X NA M M X M M M M X SA X M X M O O X X PEG200 – – – – O M O X PEG400 X M X O – – – –
PVP: polyvinylpyrrolidone, MCC: microcrystalline cellulose, HPMC: hydroxypropyl-methylcellulose, EC: ethyl cellulose, NA: niflumic acid, SA: stearic acid, PEG: polyethylene glycol. O: A surrounds B, X: B surrounds A, M: no interactions between A and B.
Table A.1
Work of adhesion equations proposed by Girifalco and Good[25]and Wu[26].
Girifalco and Good Wu
WAB= 2ϕIϕV(γAγB)0.5 ϕI¼εεAABεB ϕV¼ 4 vðAvBÞ 1=3 vA1=3þvB1=3 ð Þ2 WAB= 2φAB(γAγB)0.5 φAB¼ 2 xd AxdB gAxdAþgBxdBþ xp Ax p B gAxpAþgBxpB % & xpi¼ γpi γiand x d i¼ γd i γi gA¼γγABand gB¼ γB γA
Appendix C. The ideal tensile strength in the third medium
In the general case of two different bodies A and B interacting in a third medium C, the relationship between the adhesive tensile strength and the work of adhesion is given by the following expression:
WACBð Þ ¼h Z∞
hσ xð ÞACBdx: ðC:1Þ
WACB(h) is the work required to move to infinity the surface of a body A separated from another body B by a distance h and both placed in a third
medium C, the previous equation can be converted to:
σ xð ÞACB¼
dWACBð Þh
dh jh¼∞−dWdhACBð Þh jh¼x¼ −
dWACBð Þh
Then, using relationship(18), proposed by Israelachivili[36], we obtain the following equation: σ xð ÞACB¼ − dWACBð Þh dh jh¼x¼ − dWABð Þh dh jh¼x−dWdhCCð Þh jh¼xþ dWACð Þh dh jh¼xþ dWCBð Þh dh jh¼x: ðC:3Þ
Now, let's follow the same route of resolution made by Gardon[27], he began by assuming a law of force between surfaces of particles instead of whole particles, then, he divided the surface of each particle into interacting sites. Under those assumptions, for two particles A and B in vacuum, he proposed the following equation of the tensile strength:
σ xð ÞAB¼ − dWABð Þh dh jh¼x¼ πNANB εAB 6x3− λAB 90x9 % & ðC:4Þ
where εABand λABare the attractive and repulsive potential constants between A and B respectively, NAand NBare the number of sites interacting
between A and B. Eq.(C.3)becomes:
σ xð ÞACB¼ πNANB εAB 6x3− λAB 90x9 % & þπNC 2 εCC 6x3− λCC 90x9 % & −πNCNB εAC 6x3− λAC 90x9 % & −πNANC εBC 6x3− λBC 90x9 % & : ðC:5Þ
When two particles in a liquid are in equilibrium, σACB= 0 and x = dACB0 :
d0ACB¼ NANBλABþ N 2 CλCC−NANCλAC−NBNCλBC 15 NANBεABþ N2CεCC−NANCεAC−NBNCεBC 1 2 !ð1=6Þ : ðC:6Þ
This distance can be rewritten using the following relationships[27]:
WAB¼ 0:0625πNANBεAB=d 0 AB 2 d0AB¼ λAB 15εAB % &1=6 : ðC:7Þ
With dAB0 is the distance where A and B in vacuum are in equilibrium and WABis the total adhesion work in binary mixture. Eq.(C.6)becomes:
d0ACB¼ WABd 0 AB 8 þ WCCd0CC 8 −WACd0AC 8 −WBCd0BC 8 WABd0AB2þ WCCd0CC 2 −WACd0AC 2 −WBCd0BC 2 !ð1=6Þ : ðC:8Þ
Using Eq.(6), dACB0 becomes:
d0ACB¼ σ max AB d0AB 9 þ σmaxCC d0CC 9 −σmaxAC d0AC 9 −σmaxBC d0BC 9
σmaxAB d0AB3þ σmaxCC d0CC3−σmaxAC d0AC3−σmaxBC d0BC3
!ð1=6Þ
: ðC:9Þ
If the sites are in contact, spherical and identical, dAB0 is the distance between the center of the neighboring sites of particle A and particle B.
Hence-forth, as Gardon suggested, we can write:
d0AB¼ 0:63 6 πNav % &1=3 v1=3 A þ v 1=3 B # $ 2 ¼ 0:629 ( 10 −8 v1=3 A þ v 1=3 B # $ ðC:10Þ
where v is the molar volume, Navis the Avogadro number and 0.63 takes into account close random packing of the sites[42], Eq.(C.9)becomes:
d0ACB¼ 0:629 & 10−8 σmaxAB v1=3A þ v 1=3 B # $9 þ σmaxCC 2v1=3C # $9 −σmaxAC v1=3A þ v 1=3 C # $9 −σmaxBC v1=3A þ v 1=3 C # $9
σmaxAB #v1=3A þ v1=3B $3þ σmaxCC #2v1=3C $3−σmaxAC v 1=3 A þ v 1=3 C # $3 −σmaxBC v 1=3 B þ v 1=3 C # $3 0 B @ 1 C A 1=6 ð Þ : ðC:11Þ
Given that the sites are spherical, dACB0 should be equal or higher than dAB0.
By integrating the tensile strength σ(x)ACBin Eq.(C.5)from dACB0 to infinity, we obtain the total adhesive work in a medium C:
WACB¼πNANBεABþ πN 2 CεCCþ πNANCεACþ πNBNCεBC 16d0 ACB 2 : ðC:12Þ
The maximum tensile strength σACBmaxbetween compounds A and B placed in a third medium is obtained by solving:
dσ xð ÞACB
Thus, we obtain the distance dACBmaxbetween A and B where the stress is maximum: dmaxACB¼ NANBλABþ N 2 CλCC−NANCλAC−NBNCλBC 5 NANBεABþ N2CεCC−NANCεAC−NBNCεBC 1 2 !ð1=6Þ ¼ 3ð1=6Þd0ACB: ðC:14Þ
Hence, replacing x by dACBmaxin Eq.(C.5)gives:
σmaxACB ¼ πNANBεABþ πNCεCCþ πNANCεACþ πNBNCεBC 9dmax ACB3 ¼πNANBεABþ πNCεCCþ πNANCεACþ πNBNCεBC 15:59d0 ACB 3 : ðC:15Þ
Substitution from Eq.(C.12), we obtain the relationship between the total work of adhesion and the ideal tensile strength:
σmaxACB ¼
1:0263WACB d0
ACB
: ðC:16Þ
An almost identical result can be obtained if, instead of using the Gardon's Eq.(6), we start with adhesive tensile strength formula based on Lennard–Jones law of force[43]:
σABð Þ ¼x 8WAB 3υAB υAB x # $3 − υxAB # $9 % & : ðC:17Þ
If we envisage the atomic spacing υABto be the potential equilibrium distance between A and B, after using the same previous method of
compu-tation, we will obtain:
σmaxAB ¼
1:243WAB d0
AB
and σmaxACB¼1:243WACB d0
ABC
: ðC:18Þ
References
[1]L. Larry Augsburger, K. Murali, Theory of granulation, in: Dilip M. Parikh (Ed.), Hand-book of Pharmaceutical Granulation Technology, 81, 1997, pp. 7–23.
[2]M. Hemati, M. Benali, in: Ulrich Bröckel, Willi Meier, Gerhard Wagner (Eds.), Prod-uct Design and Engineering: Best Practices, Vol. 1, 2007 (chapter 8, Weinheim).
[3]Per Holm high shear mixer granulators, in: Dilip M. Parikh (Ed.), Handbook of Phar-maceutical Granulation Technology, 81, 1997, pp. 151–204.
[4]J.D. Lister, B.J. Ennis, S.M. Iveson, K. Hapgood, Nucleation, growth and breakage phe-nomena in agitated wet granulation processes: a review, Powder Technol. 117 (2001) 3–39.
[5] B.J. Ennis, G.I. Tardos, R. Pfeffer, A microlevel-based characterization of granulation phenomena, Powder Technol. 65 (1991) 257–272.
[6]B.J. Ennis, G.I. Tardos, R. Pfeffer, The influence of viscosity on the strength of an ax-ially strained pendular liquid bridge, Chem. Eng. Sci. 45 (1990) 3071–3088.
[7] M. Benali, V. Gerbaud, M. Hemati, Effect of operating conditions and
physico-chemical properties on the wet granulation kinetics in high shear mixer, Powder Technol. 190 (1–2) (2009) 160–169.
[8] R.I. Mahato, A.S. Narang, Pharmaceutical Dosage Forms and Drug Delivery, Second
Edition CRC Press, 2011.
[9] S. Mattsson, Pharmaceutical binders and their function in directly compressed
tabletsDissertation thesis Uppsala faculty of pharmacy, 2000.
[10] A. Jiménez, M.J. Fabra, P. Talens, A. Chiralt, Effect of lipid self-association on the mi-crostructure and physical properties of hydroxypropyl-methylcellulose edible films containing fatty acids, Carbohydr. Polym. 82 (2010) 585–593.
[11] T.A. Iranloye, E.L. Parrott, Effects of compression force, particle size, and lubricants on dissolution rate, J. Pharm. Sci. 67 (1978) 535–539.
[12] R.C. Rowe, P.J. Sheskey, M.E. Quinn, Handbook of Pharmaceutical Excipients, 6th Edi-tion Pharmaceutical Press, 2009.
[13] J. Kundu, C. Patra, S.C. Kundu, Design, fabrication and characterization of silk fibroin– HPMC–PEG blended films as vehicle for transmucosal delivery, Mater. Sci. Eng. C 28 (2008) 1376–1380.
[14] F. Laboulfie, Depôt en couche mince d'un multi-materiau à la surface de particules
solides: application à l'enrobage de particules alimentaires, INPT, Toulouse, 2013.
[15] J.H. Hildebrand, The Solubility of Nonelectrolytes (New York), 1950.
[16] A.F.M. Barton, CRC Handbook of Solubility Parameters and Other Cohesion
Parame-ters, 1991.
[17] G. Gee, Thermodynamic of Rubber Solutions and Gels in Advances in Colloid Science
(New York), 1946.
[18] P. Choi, T. Kavassalis, A. Rudin, Measurement of three-dimensional solubility param-eters of nonyl phenol ethoxylates using inverse gas chromatography, J. Colloid Inter-face Sci. 180 (1996) 1–8.
[19] C.M. Hansen, The three-dimensional solubility parameter — key to paint component
affinities: I. Solvents, plasticizers, polymers, and resins, J. Coat. Technol. 39 (1967) 505–510.
[20] D.W. Van Krevelen, Chemical structure and properties of coal, XXVII-coal
constitu-tion and solvent extracconstitu-tion, Fuel (1965) 229–242.
[21] K.L. Hoy, New values of the solubility parameters from vapor pressure data, J. Coat. Technol 42 (1970) 76–118.
[22] P.A. Small, Some factors affecting the solubility of polymers, J. Appl. Chem. 3 (1953) 71–80.
[23] HSPiP V. 3.1 Software,http://www.hansen-solubility.com/HSPiP.html2010. [24] M. Belmares, M. Blanco, W.A. Goddard III, R.B. Ross, G. Caldwell, S.H. Chou, J. Pham,
P.M. Olofson, C. Thomas, Hildebrand and Hansen solubility parameters from molec-ular dynamics with applications to electronic nose polymer sensors, J. Comput. Chem. 25 (2004) 1814–1826.
[25] L.A. Girifalco, R.J. Good, A theory for the estimation of surface and interfacial ener-gies. I. Derivation and application to interfacial tension, J. Phys. Chem. 61 (1957) 904–909.
[26] S. Wu, Polar and nonpolar interactions in adhesion, J. Adhes. 5 (1973) 39–55.
[27] J.L. Gardon, Variables and interpretation of some destructives cohesion and
adhe-sion tests, Treatise on Adheadhe-sion and Adhesives1967. 269–324.
[28] J.L. Gardon, Critical review of concepts common to cohesive energy surface tension,
tensile strength, heat of mixing, interracial tension, and butt joint strength, J. Colloid Interface Sci. (1977) 582–596.
[29] R.C. Rowe, Adhesion of film coating to tablet surfaces — a theoretical approach based on solubility parameters, Int. J. Pharm. (1988) 219–222.
[30] J. Barra, F. Lescure, F. Falson-Rieg, E. Doelker, Can the organization of a binary mix be predicted from the surface energy, cohesion parameter and particle size of its com-ponents? Pharm. Res. 15 (1998) 1727–1736.
[31] M. Benali, Prédiction des interactions substrat-liant lors de la granulation: Etude
expérimentale dans un mélangeur à fort taux de cisaillement, approches thermodynamiques par simulation moléculaire, 2006.
[32] J. Bicerano, Prediction of Polymer Properties, CRC Press, 2002.
[33] F. Laboulfie, M. Hemati, A. Lamure, S. Diguet, Effect of the plasticizer on permeability, mechanical resistance and thermal behaviour of composite coating films, Powder Technol. 238 (2013) 14–19.
[34] Accelrys Material Studio Suite release 7, http://accelrys.com/products/materials-studio2013.
[35] H. Flyvbjerg, H.G. Petersen, Error estimates on averages of correlated data, J. Chem. Phys. 91 (1989) 461–467.
[36] J.N. Israelachvili, Intermolecular and Surface Forces, Academic Press, 2010.
[37] D. Frenkel, B. Smit, Understanding Molecular Simulation, Academic Press, 1996.
[38] R. Bonn, J.J. van Aartsen, Solubility of polymers in relation to surface tension and index of refraction, Eur. Polym. J. 8 (1972) 1055–1066.
[39] T.J. Sheldon, C.S. Adjiman, J.L. Cordiner, Pure component properties from group con-tribution: hydrogen-bond basicity, hydrogen-bond acidity, Hildebrand solubility pa-rameter, macroscopic surface tension, dipole moment, refractive index and dielectric constant, Fluid Phase Equilib. 231 (2005) 27–37.
[40] Z. Lovorka, B. Graham, The use of surface energy values to predict optimum binder
selection for granulations, Int. J. Pharm. 59 (1990) 155–164.
[41] S.A. Oelmeier, F. Dismer, J. Hubbuch, Molecular dynamics simulations on aqueous
two-phase systems — single PEG-molecules in solution, BMC Biophys. 5 (2012) 14.
[42] G.D. Scott, Nature 199 (1960) 908.
[43] J.A. Greenwood, Adhesion of elastic spheres, Math. Phys. Eng. Sci. 453 (1961) (2001) 1277–1297.
[44] J.E. Mark, Polymer Data Handbook, 1998.
[45] J. Barra, F. Falson-Rieg, E. Doelker, Influence of the organization of binary mixes on their compactibility, Pharm. Res. 16 (1999) 1449–1455.
[46] M. Ash, I. Ash, Handbook of Green Chemicals, 1998.
[47]R.C. Rowe, Interactions in coloured powders and tablet formulations: a theoretical
approach based on solubility parameters, Int. J. Pharm. 53 (1989) 47–51.
[48] L.P. Demajo, D.S. Rimai, L.H. Sharpe, Fundamentals of Adhesion and Interfaces, CRC
Press, 2000.
[49] R.C. Rowe, Polar/non-polar interactions in the granulation of organic substrates with polymer binding agents, Int. J. Pharm. 56 (1989) 117–124.
[50]P. Bustamante, A. Martin, M.A. Gonzalez-Guisandez, Partial solubility parameters
and solvatochromic parameters for predicting the solubility of single and multiple drugs in individual solvents, J. Pharm. Sci. 82 (1993) 635–640.
[51]A. Onions, Films from water-based colloidal dispersions, Manuf. Chem. 12 (1986)
55–59.
Ahmed Jarray is a Ph.D. student at the Institut National Polytechnique de Toulouse (INPT). He has an Ing. in Chemical and Process Engineering (2011, Gabes, Tunisia) and a MSc in Process Engineering (2012, Lyon, France).
Vincent Gerbaud is a research manager at The Centre Na-tional de la Recherche Scientifique (CNRS). He has a BSc in Chemical Engineering (1991, Toulouse, France), MSc in Chemical Engineering (1992, UMASS, USA) and a PhD in Chemical Engineering (1996, Toulouse, France). He conducts research in process system engineering, with a strong inter-est in small scale modeling: molecular simulation, thermo-dynamics, computer aided molecular and mixture design, He has supervised 12 PhD thesis and 11 post-docs (for more details please visit: http://lgc.inp-toulouse.fr/lgc/annuaire/ cv/vincent-gerbaud.pdf).
Mehrdji Hemati is a professor at the Institut National Polytechnique de Toulouse (INPT) since 1994, and animator of the team “Fluidization for Energy, CVD and new mate-rials”, He has 33 PhD theses supervised at INPT, and author or co-author of more than 100 publications in International Scientific Journals and 15 patterns.
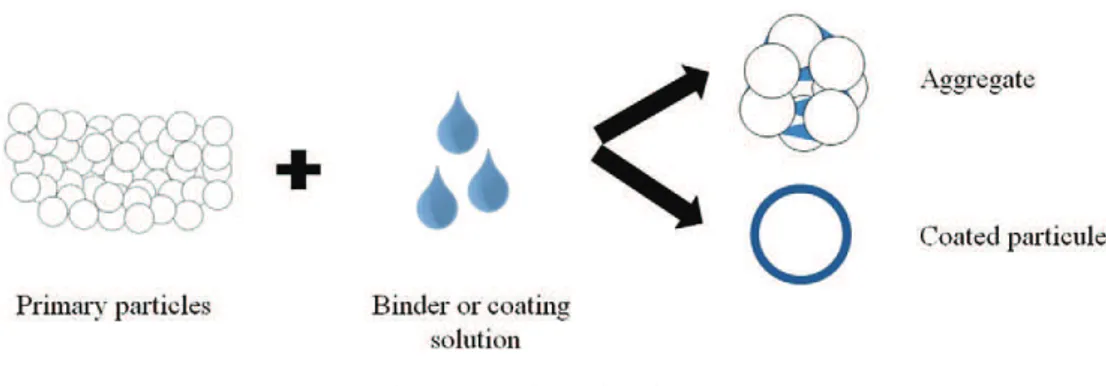
![Fig. 2. Film formation during the evaporative phase. Figure adapted from [51].](https://thumb-eu.123doks.com/thumbv2/123doknet/3224786.92255/5.892.48.847.150.352/fig-film-formation-evaporative-phase-figure-adapted.webp)