OATAO is an open access repository that collects the work of Toulouse
researchers and makes it freely available over the web where possible
Any correspondence concerning this service should be sent
to the repository administrator:
[email protected]
This is an author’s version published in:
http://oatao.univ-toulouse.fr/21409
To cite this version:
Verdalet-Guardiola, Xavier
and Bonino, Jean-Pierre
and Duluard, Sandrine
Nathalie
and Fori, Benoit and Blanc, Christine
Influence of the alloy
microstructure and surface state on the protective properties of trivalent chromium
coatings grown on a 2024 aluminium alloy. (2018) Surface and Coatings Technology,
344. 276-287. ISSN 0257-8972
Influence of the alloy microstructure and surface state on the protective
properties of trivalent chromium coatings grown on a 2024 aluminium alloy
Xavier Verdalet-Guardiola
a,
b,
c, Jean-Pierre Bonino
h,
Sandrine Duluard
h,
Benoit Fori
e,
Christine Blanc
a,
*
a CIRIMAT, Université de Tou/ou.se, CNRS, ENSIACET, 4 allée EmUe Monso, BP 44362, 31030 Tou/ou.se cedex 4, France b CIRIMAT, Université de Tou/ou.se, CNRS, UPS, 118 route de Narbonne, 31062 Toulouse cedex 9, France
c MECAPROTEC Indu.stries, 34 Boulevard de Joffrery, BP 30204, 31605 Muret Cedex, France
ARTICLE INFO ABSTRA CT
Keywords:
Trivalent chromium coating Aluminium alloy Protective properties Copper
Microstructure
Electrochemical impedance spectroscopy
The protective properties of trivalent chromium process (TCP) coatings grown on a 2024-T3 aluminium alloy were studied on the basis of electrochemical measurements performed both in sulphate and chloride solutions and neutral sait spray tests. The influence of the alloy microstructure and surface state was studied: two batches, each one characterized by its own coarse intermetallic particle distribution, and two surface states, i.e. laminated and polished, were considered. Results showed that in 0.1 M Na2SO4, the protective properties of the TCP
coatings decreased when the roughness of the initial surface increased. Furthermore, improved protective properties were observed for a TCP coating grown on a surface containing a lower amount of Al-Cu- Mg IMCs in the initial microstructure. The most plausible explanation is that a fast kinetics of coating growth, either asso ciated to strong initial roughness or a great surface copper coverage, was detrimental for the protective prop erties of the coatings. In more aggressive solutions, i.e. 0.5 M NaCI solution or for neutral sait spray tests, the differences are not significant. The findings are highly relevant for industrial applications: the results showed that variations in batches, for a same type of alloy, or in initial surface state should not be detrimental for the corrosion resistance of the TCP coated samples. However, the conversion process had to be adapted for different types of alloys, characterized by their own microstructure.
1. Introduction
Aluminium alloys are widely used in the aeronautical industry due to their high specific modulus E/p (E, Young modulus and p, density) that allows the mass of the structures to be reduced [1]. Their good mechanical properties are mainly related to the addition of different alloying elements that, unfortunately, lead to a decrease of the corro sion resistance of the alloys when compared to pure aluminium [2,3]. Chromate conversion coatings were largely used to improve the cor rosion resistance of aluminium alloys. However, European regulation REACh, that bans the use of hexavalent chromium, will become effec tive in 2024 [4]. Therefore, new chemical conversion treatments are developed. Trivalent chromium processes (TCP) constitute one of the most promising substitution solutions [5-9].
Contrary to chromate coatings, anti-corrosion properties of trivalent chromium coatings are known to depend significantly on the surface preparation, i.e. pre-treatments performed before TCP [2,7,10--17]. Before chemical conversion, the alloy surface is cleaned in a degreasing
• Corresponding author.
E-mail address: [email protected] (C. Blanc).
solution to remove fats and oils. Then, a desmutting solution dissolves the native oxide and allows the formation of a new oxide with con trolled thickness and composition [2]. Li et al. have shown that a long desmutting step reduces the anti-corrosion performance of a commer cial trivalent chromium coating (Alodine 5900 RTU coating, Henkel group) [17]. They attributed the decrease of the anticorrosion proper ties to the roughness generated by the desmutting process, and more precisely, to the nucleation and growth of pits with increasing depth over the time of desmutting in Turco Liquid Smut-Go NC. Toh et al. have studied different desmutting solutions on aluminium alloy 7475-T7651; they have shown important differences in the morphology and oxide roughness at the alloy surface [18]. Others works have shown a huge influence of the substrate microstructure on the surface reactivity during the pre-treatments and as a consequence on the anti-corrosion properties of the coatings [19-22]. Considering the complex micro structure of industrial aluminium alloys, it seems difficult to establish a clear relationship between the effects of the pre-treatments on the surface morphology, the kinetics of TCP coating growth and the
subsequent protective properties of the TCP coatings. Ail of this gave rise to new challenges at the industrial scale. The first one concerns the ability to generalize the conversion process to different alloys; the second one is related to the need to get away from the influence of the surface state of the substrate before the pre-treatments on the growth of the TCP coatings and their subsequent anticorrosion properties.
In the present work, the surface morphology, chemistry and re activity after different steps of pre-treatment (degreasing and desmut ting) were studied for three samples of AA 2024-T3: two polished samples from two batches of AA 2024-T3 to study the influence of the microstructure and a laminated sample of one of the two batches to detennine, by comparison with the polished sample of the same batch, the effect of the surface state before pre-treatment. Then, the growth rate of the TCP coatings was analysed and their protective properties were evaluated by means of OCP measurements, potentiodynamic po larisation, electrochemical impedance spectroscopy measurements and neutral salt spray tests.
2. Materials and methods
2.1. Materials and sample preparation
The material used was a cold rolled AA 2024-T3 provided as sheets of different thicknesses with similar chemical compositions (Table 1). Two batches were studied and called as alloy A for the 1 mm thick sheet and alloy B for the 3 mm thick sheet respectively. Ail samples corre sponded to 125 x 80 x 3 mm3 parallelepipeds removed from the
sheets. Alloy A was studied as received, i.e. after rolling: the samples were called as laminated samples in the following. Other samples of alloys A and B were abraded using SiC paper down to 1200 and then mechanically-polished to a 1 µm colloïdal diamond finish prior to the pre-treatment. They constituted a reference surface state and are called as polished samples in the following. The samples were protected using a silicone one-component (CAFl, Bluestar Silicones) in order to expose only one side to the different solutions with a 4 (or 10) cm2 surface
area. They were rinsed with acetone prior to the pre-treatments in order to remove inks and other surface pollutants. Then, they were degreased in an alkaline bath (40 g·L -1 sodium tripolyphosphate, 40 g·L -l borax and 5 mL·L -1 Turco 4215 additive, pH
=
9) for 1200 s at 60 •c. Finally, they were immersed in the desmutting bath, i.e. a sulfo-nitro-ferric solution (pH=
1) for 300 s at room temperature. Ail the pre-treatment steps were followed by a rinsing in deionised water. Ail reactants used are of industrial quality.For the formation of the TCP coating, the degreased and desmutted samples were first immersed for 600 s in the conversion solution (32% v/v Socosurf TCS (Socomore, France), pH between 3.8 and 4) at 40 •c to fonn the conversion layer. The coated samples were then immersed in the post-treatment solution (10% v/v Socosurf PACS (Socomore, France), 5% v/v H202 at 35% v/v in water, pH between 4.2 and 5.3) at
room temperature for 300 s. All treatments were followed by rinsing in deionised water. Finally, the samples were dried at 60 •c during 600 s.
2.2. Characterisation of the surface morphology and microstructure. Morphology of the TCP coatings
Scanning Electron Microscopy - Field Emission Gun (SEM-FEG) observations were perfonned with a JEOL JSM 7800F Prime (platfonn of Micro-characterisation Raimond Castaing, Toulouse) operating at
Table 1
Composition of 2024-T3 aluminium alloys.
Wto/o Al Cu Mg Mn Fe A Balance 4.5 1.4 0.57 0.21 B Balance 4.4 1.4 0.51 0.15 Si 0.08 0.08 Table 2
Classification criteria used for the identification of IMCs (0 > 2 µm) where X corre sponds to the results of measurements performed for the matrix.
Type Classification criteria Al-Cu-Mn-Fe-Si Fe> Fe+ 0.2 Cu> Cu Al-Cu-Mg Mg> Mg+ 0.5 Fe� Fe Al-Cu Mg�Mg Fe� Fe Cu>Cu+l
5 kV (secondary electrons) and 10 kV (backscattered electrons) to characterize both the surface morphology and microstructure of the alloys. Concerning the microstructure, attention was paid to coarse intennetallic particles (IMC); energy dispersive spectroscopy (EDS) measurements perfonned by means of a EDS SDD X-Max 80 mm2
Oxford Instruments AZtecEnergy allowed three types of IMC (0 > 2 µm) to be distinguished on the basis of the classification criteria described in Table 2. Transmission electron microscopy (TEM) ob servations were performed with a JEOL JEM 21 OOF (platfonn of Micro characterisation Raimond Castaing, Toulouse) operating at 200 kV to characterize the structure of the TCP coatings. TEM samples were prepared with a Scanning Electron Microscopy - Focused Ion Bearn FEI HELIOS 600i (platfonn of Micro-characterisation Raimond Castaing, Toulouse) equipped with a Gallium Ionie Canon. Samples were covered by an electronic carbon coating (0.5 µm, operating at 5 kV and 2.5 nA, precursor: Naphtalene (C10H8) and an ionic platinum coating (3 µm, operating at 30 kV and 0.43 nA, precursor: Methylcyclopentadieny(tri methyl)platinium (C5H4CH3Pt(CH3h)) before cutting operating at
30 kV and 47 nA to 80 pA.
2.3. Characterisation of the electrochemical behaviour and protective properties
The reactivity of the alloy surface before and after the two pre treatment steps, related mainly to the corrosion behaviour of the IMCs present on the sample surface, was evaluated by perfonning anodic polarisation in a 0.1 M Na2S04 solution [23]. A three-electrode cell
connected to a Bio-Logic VSP potentiostat was used with a saturated calomel electrode (SCE) as reference electrode and a graphite rod as counter electrode. The working electrode was placed vertically with a surface exposed to the electrolyte of 4 cm 2. Polarisation was perfonned
from open circuit potential (OCP) minus 0.05 V to 0.5 V /SCE at 500 m V·h -1 after 1 h of immersion at OCP.
The relative electroactive copper content on the sample surface (4 cm2 exposed to the solution) was determined by cyclic voltammetry
(CV) experiments perfonned in deaerated borate buffer solution (8.17 g·L -l Na2B407_ 10 H20, 7.07 g·L -l H3B03, pH
=
8.4) at roomtemperature [16,24]. The solution was deaerated for 15 min with ni trogen bubbling before CV experiments. The procedure consisted of (a) a 5 min polarisation at -0.7 V5CE; (b) scan from -0.7 VsCE to 0.3 VsCE
then back to -1.2 VsCE at 1 mv-ç1; (c) hold at -0.7 VscE during
lO min; (d) repeat step (b); (e) hold at -0.7 VscE during 20 min; (0
repeat step (b). The area under Cu(O) __,. Cu(!) peak in the last scan was used to detennine the relative electroactive copper content as largely detailed in Scully's work [25,26].
Electrochemical impedance spectroscopy (EIS) measurements were perfonned in naturally aerated 0.1 M Na2S04 solution at room tem
perature to evaluate the protective properties of the coatings using the
Cr Zn Ti V Zr Other
0.01 0.13 0.02 0.01 0.01 0.05
same experimental set-up as for the polarisation experiments except for the position of the working electrode, horizontal, at the bottom of the cell in this case. The samples (surface exposed to the electrolyte of 10 cm2) were first exposed to the solution for one hour at their corro
sion potential before the first measurement (i.e. 0 day) in order to sta bilise the OCP value. EIS measurements were carried out for different immersion times: 0, 3, 7, 14, 21 and 28 days. They were performed at the OCP in the frequency range 6.104 to 5.10-3Hz with a potential
amplitude of 10 mV (rrns). EC-lab software (version 10.37, Bio-Logic) was used to fit the experimental EIS spectra.
To complete the EIS experiments, OCP measurements and po tentiodynamic polarisations were performed in 0.5 M NaCl solution by means of the same experimental set-up than before (surface exposed to the electrolyte of 4 cm2). For the potentiodynamic polarisations, the
samples were first maintained at their OCP for 1 h and then the anodic and cathodic parts were obtained independently from the OCP - 50 mV ( + 50 m V for the cathodic part) at a potential sweep rate of 0.14 m V s - I. Neutra! sait spray tests (NSST) were achieved also in an Ascott sait spray chamber S120iS. Salt spray tests were performed under ISO9227 specification. Each sample was a parallelepiped with a 1 dm2 surface area exposed to the electrolyte and was inspected each
24 h. In these conditions, corrosivity tests (ISO9227) for CR4 steel ex hibit a corrosion rate of 68 g·m -2 for 48 h.
Ail the experiments previously described were repeated three times in order to evaluate the reproducibility of the results.
2.4. Characterisation of the wettability of the swface
Water contact angle was measured with an optical tensiometer Attension Theta T200-Basic and analysed with OneAttension software (Attension Theta). Water contact angle values were recorded for 10 s and the wettability was defined from the values recorded between 8 and 10 s. The measurements were performed immediately after the different treatment steps and repeated 10 times minimum for each condition.
3. Results and discussions
3.1. Characterisation of the surface before the conversion process 3.1.1. Swface morpholo&r for AA 2024-T3 after the pre-treatment step, i.e. degreasing and desmutting
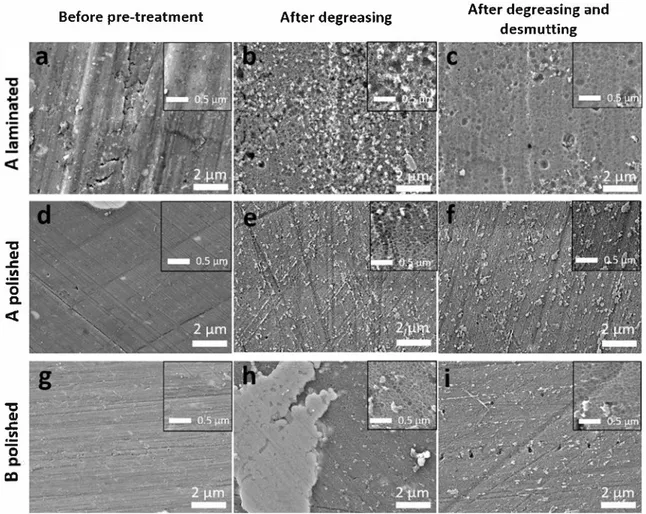
SEM-FEG micrographs of the M 2024-T3 surface for A and B alloys before pre-treatment (after acetone rinsing) and after each step of pre treatment (degreasing and desmutting) are presented in Fig. 1. Before pre-treatment, laminated sample surfaces presented numerous defects related to the rolling process, i.e. rolling grooves, wrenching of mater, inclusions (Fig. la) while polished sample surfaces exhibited low roughness due to the mechanical polishing process (Fig. ld and g). Ail the surfaces exhibited IMCs of various sizes (Fig. 2). The nature of these particles and the surface area they covered will be detailed in the next paragraph. After degreasing, ail the surfaces showed a scalloped mor phology and a high quantity of both residues and IMCs (Fig. lb, e and h). After desmutting, ail the samples showed a similar surface mor phology characterized by a scalloped surface with fewer residues (Fig. le, f and i). Almost ail the IMCs had been removed from the alloy surface after this pre-treatment step. For the laminated surfaces (Fig. le), rolling defects were still observed after surface degreasing and desmutting treatments.
The scalloped surface is characteristic of a severe chemical attack of the aluminium matrix. In the literature, such a significant dissolution operates in acidic desmutting bath, as shown by Toh et al. [18]. In this study, this severe chemical attack in the degreasing bath was consistent with the pH of the degreasing solution (pH = 9) and the relative in stability of aluminium oxide at this pH. After pre-treatment, ail the alloy surfaces showed similar scalloped morphology conceming the
shape of the pattern with slightly smaller pattern size for the polished samples.
3.1.2. Evolution of the alloy microstructure as a function of the pre treatment steps
Table 3 reports the surface area covered by IMCs (only particles with diameter larger than 2 µm were studied) and holes for the different surfaces. Values were obtained by means of an image analysis software ImageJ with an analysis performed for a surface larger than 1 mm2•
Before the pre-treatments, polished samples exhibited a higher surface area of IMC than laminated samples. This difference was exacerbated after degreasing, the IMC surface area on laminated sample A de creasing while it increased for polished surfaces. After the desmutting step, the IMC surface area decreased widely for ail the samples and only 0.1 to 0.4% of the surface was covered by IMCs (Fig. le, f and i). At the same time, the surface area covered by holes, observed as black points in SEM-FEG micrographs, surged due to the IMC removal in relation with the dissolution of the matrix surrounding these particles.
EDS analyses allowed the nature of the IMCs present at the sample surfaces to be determined; the results are summarized in Fig. 3. For these analyses, more than one hundred IMCs were analysed for each sample in order to present representative results. As expected, Al-Cu Mn-Fe (white circle in Fig. 2), Al-Cu-Mg (white square in Fig. 2) and Al Cu (white square in Fig. 2) IMCs were identified but their distribution was very different from one sample to another one. Before the pre treatments, alloy A presented significant differences in microstructure between the laminated and the polished samples, laminated samples showing a larger part of Al-Cu-Mn-Fe-Si particles ( > 90%) compared to polished samples (only 60%). A very large ratio of Al-Cu-Mg particles
( > 70%) was observed for polished samples of alloy B. The highest
amount of Fe-rich intermetallics in alloy A could be explained by the highest Fe content of this alloy compared to alloy B, in agreement with literature data [27-31]. After degreasing, the microstructure of ail samples evolved due to the IMC reactivity. As expected, for laminated samples of alloy A, no strong evolution of the microstructure was ob served because the major part of the IMC was Al-Cu-Mn-Fe-Si particles, i.e. the less reactive intermetallics [25]. However, the surface area covered by these particles decreased (Table 3) which could be related to an enhanced dissolution of the matrix around these IMCs, those parti des acting as cathodic sites which led to their removal. On the contrary, for polished samples of alloys A and B, the ratios of Al-Cu-Mg and Al-Cu particles significantly evolved. Again, the removal of Al-Cu-Mn-Fe particles, due the dissolution of the surrounding matrix, could con tribute to explain the evolution of the Al-Cu-Mg particle ratio. Then, the dissolution of the matrix, due to the pH value, could also explain that more IMCs could be exposed to the electrolyte after degreasing (Table 3). Moreover, the reactivity of the Al-Cu-Mg particles themselves had to be considered. These particles are known to be very reactive [32-34]. They are first anodic to the aluminium matrix and are asso ciated to selective dissolution phenomena leading to a copper enrich ment and then to an inversion of the polarity matrix/particles: the particles become cathodic to the matrix [35]. In near-neutral aqueous solutions, the dominant cathodic reaction on the copper-enriched IMCs is the oxygen reduction reaction that leads to local pH increase and promotes the dissolution of the Al matrix, causing localized attack near the IMCs and then their removal. The differences observed in the mi crostructure evolution between polished samples of alloys A and B could be explained considering that, even for one type of IMC, a large discrepancy could be observed in the kinetics of the reactions occurring at their surface [36]. Finally, a large number of Al-Cu-Mg particles was still present after degreasing. After desmutting, almost ail IMCs were removed. The low number of residual IMCs did not allow a re presentative microstructure to be defined.
The results thus showed that, depending on the surface state (po lished or laminated) and depending on the alloy batch, the nature of the IMCs present on the surface was significantly different before the
pre-Before pre-treatment
After degreasing
After degreasing and
desmutting
""C
QI.c
.!!!
0
Q.<C
""C
QI.c
.!!!
0
cc
Fig. 1. SEM-FEG observations of A laminated (a, b, c), A polished (d, e, f) and B polished (g, h, i) surfaces washed with acetone (a, d, g), degreased (b, e, h) and degreased and desmutted (c, f, i).
treatments and, consequently, due to the IMC reactivity, after the pre treatments steps. The evolution of the microstructure of the different surfaces after the degreasing and desmutting steps clearly showed the reactivity of both the IMCs and surrounding matrix. These phenomena are well-known to be associated with copper coverage of the sample surface. The IMC dealloying and dissolution/back-plating mechanism related to mechanical disconnection of Cu particles from dealloyed porous Al-Cu-Mg particles [37,38] both contribute to the copper re distribution process. However, copper redistribution could also occur from the solid solution, and in particular from the dissolution of the matrix surrounding the IMCs. Therefore, ail the electrochemical pro cesses that had occurred during the pre-treatment should lead to sig nificant evolution of the surface reactivity. To go further in these
investigations, polarisation curves were plotted before and after the pre-treatments and the amount of electroactive copper on the sample surfaces was deterrnined.
3.1.3. Reactivity of the sample surface and corrosion behaviour of the IMCs dwing the pre-treatments
Previous works showed that the reactivity of the IMCs could be studied by anodic polarisation in sodium sulphate solution [23,39].
Fig. 4 thus showed the anodic polarisation curves plotted in 0.1 M so dium sulphate for the different samples at each step of the pre-treat ment. The curves plotted for the samples before the pre-treatments are also given. Ali curves presented a well-defined passivity plateau in good agreement with the low agressivity of the sulphate solutions towards
A laminated
A polished
B polished
•
•
c)
b)
.0--
•·-
Al-Cu-Mn-Fe
•
•
.
Al-Cu-Mg
•
!
.
'�I
••
Al-Cu
.
•
.
Fig. 2. SEM-FEG observations of IMCs for a) A laminated b) A polished c) B polished samples. Al-Cu-Mn-Fe IMCs are identified by means of a white cirde whi!e both Al-Cu-Mg and Al-Cu IMCs are identified with a white square.
Table 3
Surlace area fractions calculated for IMCs (diameter larger than 2 µm) and holes before pre-treatments and after each pre-treatment step, for alloy A (lantinated and polished samples) and alloy B (po!ished samp!es).
IMCs (diameter > 2µm) Holes
% Before pre-treatments Mer degreasing Mer degreasing and desmutting Before pre-treatments Mer degreasing Mer degreasing and desmutting A lantinated 0.8 A polished 1.6 B po!ished 1.2 ._ 100% CIi E 80% :::1 C u 60% ra
...
0...
-
0'#.
40% 20% 0%(a)
0.6 0.10 2.5 0.18 2.9 0.39---
1
---
-
-
1
-
-
---
�
---
-
-
--
----
l
---
-
---
1
----
-
-
--
-
-
1
---
1
---A laminated A polished B polished
0.3 0.1 0.1 100% 80% 60% 40% 20% 0%
(b)
0.5 0.8 0.2 0.4 0.5 1.31
---
1-
----
-
-
-
-
---
----
1
---
�
---
�
---
1
---
1-
---
1
---A laminated A polished B polished
� AICuMnFe(Si) 1111 AICuMg ■ AICu
Fig. 3. Identification of the IMCs present at the surface of the samp!es for alloys A and B (diameter of the IMCs larger than 2 µm) before the pre-treatments (a) and after the degreasing step (b).
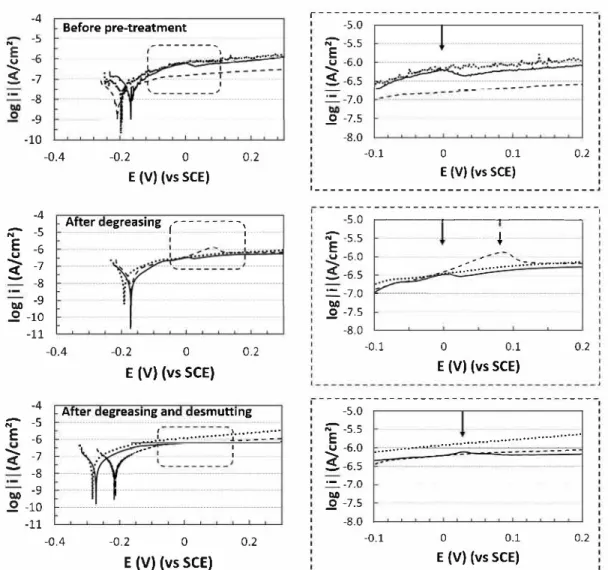
aluminium alloys. However, for some curves, an anodic peak (shown by an arrow) was observed between - 0.1 and 0.2 Vsœ that was attributed to the anodic reactions associated to the dissolution of the IMCs and subsequent surface copper coverage: the anodic peak could be attrib uted to the oxidation of redistributed Cu to CuO [23,39] or to the oxidation of Cu-containing IMCs [25,26]. Before the pre-treatrnents, only the polished sarnples of alloy B exhibited the characteristic peak of IMC reactivity which could be related to the large arnount of Al-Cu-Mg particles in the polished surface of alloy B (Fig. 3a). After degreasing, the characteristic peak of IMC reactivity was still observed for polished sarnples of alloy B, in good agreement with the arnount of Al-Cu-Mg particles (Fig. 3b and Table 3); this peak was also observed for larni nated samples of alloy A which was more surprising considering the nature of the IMCs for these sarnples (Fig. 3b). This could suggest that the degreasing step modified the reactivity of Al-Cu-Mn-Fe particles. This was in good agreement with other studies that showed that a copper enrichrnent could be observed also for this type of IMC even if they were Jess reactive than Al-Cu-Mg particles [23,40]. lt was also consistent with Sieradzki's results that showed that surface copper coverage could be also related to the dissolution of the solid solution surrounding the IMCs [37,38].
After the desmutting step, results clearly showed that none of the sarnples presented such a peak which was consistent with the important decrease of the surface area covered by the IMCs in relation with their removal (Fig. 1 and Table 3).
Therefore, the results showed differences in the reactivity of the different surfaces obtained after each step of the pre-treatrnent in re lation with the microstructure of the sarnples, i.e. the nature of the IMCs present on the surface before the pre-treatrnents and the evolution of their distribution due to their reactivity in the pre-treatrnent baths. Considering that (i) the IMC dissolution can lead to copper redistribu tion (ii) incomplete dissolution of the IMC can leave significant loca lized quantities of copper [16,18,41] and (iii) copper can have a sig nificant impact on the conversion process [42--44], the arnount of electroactive copper remaining on the surface was a major pararneter considering the surface properties; it was determined by CV experi ments for al! the samples.
3.1.4. Evolution of the electroactive copper content during the pre-treatment
The electroactive copper content was calculated from CV experi ments by considering the area of the oxidation peak Cu (0) to Cu (I)
with a reference value measured for pure copper at 100 a.u. as detailed by Scully and co-workers [25,26]. These authors showed that this method can be used to assay surface Cu coverage fixed by the pre treatrnents. Ail Cu oxidation can be attributed to either surface Cu de posited on the alloy surface or Cu-containing IMCs. They also showed that the IMCs alone were a negligible source of Cu peaks in CV ex periments when minimal Cu replating existed; this was especially true for pre-treated sarnples due to the severe IMCs removal during the pre treatrnents. The relative electroactive copper content at the surface of the alloy after each step of the pre-treatrnent is presented in Fig. 5 for the three samples. Before pre-treatrnent, the electroactive copper con tent at the sarnple surface was nearly equal to zero for ail the samples whereas significant amounts of electroactive copper were detected for al! the sarnples after degreasing. Results clearly showed a large dis crepancy in the copper content values measured after degreasing for ail the sarnples. However, the increase of the electroactive copper content for larninated samples of alloy A was in good agreement with the ap pearance of an anodic peak on the polarisation curves (Fig. 4; the peaks are shown by the arrows) for these samples; as suggested before, the result could be explained considering a modification of the reactivity of Al-Cu-Mn-Fe particles after the exposure to the degreasing bath. For polished sarnples of alloys A and B, the increase of the electroactive copper content could be related to the reactivity of Al-Cu-Mg particles associated with copper redistribution, the larger arnount of copper for alloy B being relevant with the presence of a peak on the polarisation curve (Fig. 4) and an higher arnount of Al-Cu-Mg particles compared to alloy A. The desmutting step induced an overall decrease of the elec troactive copper content in good agreement with the IMC removal and suggesting also the dissolution of the copper deposits. A significant arnount of copper was still present after desmutting for the polished sarnples whereas no copper was detected for the larninated samples of alloy A. Such an observation confirmed that both the IMCs and the copper deposits contributed to the electroactive copper content values as proposed by Scully et al. [25,26]. For larninated sarnples, the
- - -A laminated ··· A polished -B polished
-4 -5 NE
-6�
�
-7 -8 -9 -10 -4 ;:;-- -5E
-6J
-7 -8 tl.O -9 .!2 -10 -11 -4 ;:;-- -5E
-6 - -7S.
-8 tl.O -9 .2 -10 -11 Before pre-treatment---
....,...,..
...
-0.4 -0.2 0 0.2E (V) (vs SCE)
A er egreasing �---, .f .. ···-· 1··· 1 -0.4 -0.2 0 0.2E (V) (vs SCE)
A er egreasmg an esmuttmg -0.4...
. } ... 1· :· :· :·:·:·· -0.2�···
:
0E (V) (vs SCE)
0.2 r---5.0 N-5.5, E
� -6.0 �-6.5 =--7.0 _S! -7.5 -8.0 -0.1 0 0.1 E (V) (vs SCE) 0.2'---
---�
-5.0 �----�---�----� î-5.5 � -6.0 �-6.5 =--7.0 tl.0 _S! -7.5 -8.0 -0.1... ·!
-:.: .:
.:.:.'
...
:
::::.
,.,
.-..-•-···-0 0.1E (V) (vs SCE)
0.2 1 1 ---5.0 î·S.S � -6.0 !!.-6.5 =--7.0 tlO _S! -7.5 -8.0 ... --••---t••······::·:·······:·····_··_···· · :··_. ·· _ ··..
-...
-0.1 0 0.1 0.2E (V) (vs SCE)
'---Fig. 4. Anodic polarisation curves plotted in 0.1 M Na2S04 before and after each step of the pre-treatment for alloys A (polished and laminated samples) and B (polished samples). The
arrows allow the anod.ic peak associated to the reactivity of IMCs to be identified.
electroactive copper content values measured after degreasing were mainly explained considering the activation of Al-Cu-Mn-Fe particles due to the exposure to the degreasing bath; after the desmutting step, these particles were removed leading to a copper content equal to zero. For polished samples, the electroactive copper content was explained considering both the Al-Cu-Mg particles themselves and the copper deposits so that, when the IMCs were removed after the desmutting step, the copper content was not equal to zero due to the remaining of copper deposits. Clearly, the size of the IMCs could also contribute to explain the results.
10
3.1.5. Wettability of the pre-treated surfaces
To complete the characterisation of the surfaces generated by the different steps of the pre-treatments, their wettability was measured. The water contact angles of the surfaces before pre-treatment and after each step of pre-treatment are given in Fig. 6. For ail samples, before pre-treatment, the water contact angle was high related to the probable presence of grease and oil left by the rolling and polishing processes. The differences in water contact angle for polished and laminated samples of alloy A could be related to differences in roughness (Fig. 1). However, comparison of the results obtained after degreasing and then degreasing and desmutting for these two samples showed that the
pre-...
A laminated 10 8 6 4 2 0 A polished 10 8 6 4 2 0 B polished 8 CL-0 ... =! 6��
·.;;...
...
s:: 4 QI"'
s::8
0 ······-·--·······-······ o-····-··-··--···-·····-·· Before pre• treatment El Alter Afterdegreasi ng degreasi ng and d�mutting -·---·-·---·---·-·---·-·---·---- -Before pre treatment
•
•
After1
Alterdegreasing degreasing and desmutting
..
---------------------------·-·11,.··----- -Before pre treatment..
Alter Alterdegreasing degreasing and desmutting
Fig. 5. Relative amount of e!ectroactive copper content at the surface of alloys A (laminated and po!ished samp!es) and B (polished samp!es) before and after each step of the pre treatment.
100 80 60 40 20 �---� 100 �---� 100
__________________________________
(a)
80 60 40 20__________________________________
(b)
80 ___________________________________ (c)
__
-C__ $
______________________________ _
QI u b.O----
�
---
40 60----
T
---
-
---ra�
-.
-
-------c;;.:i---�- ---20 0 0 Before pre-treatment 0Oegreased Oesmutted Before
pre-treat me nt Oegreased Oesmutted pre-treatment Before Oegreased Oesmutted
Fig. 6. Water contact angle measured before and after each step of the pre-treatment for a) laminated sample of alloy A; b) polished samp!e of alloy A and c) polished sample of al!oy B.
treatment erased, at least partially, the influence of the initial rough ness. Consequently, results obtained for the three samples after each step of the pre-treatment could be compared. After degreasing, ail samples showed a lower contact angle and thus a higher wettability. At the end of the pre-treatment, al! samples showed similar wettability. This led us to assume that, even if some differences in roughness still existed between the three samples at the end of the pre-treatment, they were not strong enough to modify the access of the electrolyte to the surface during the TCP coating growth. Therefore, any differences ob served in the kinetics of the coating growth should not be explained totally by considering differences in roughness only.
To sum up, previous results showed that, for a same alloy, de pending on its surface state (polished or laminated) and depending on its microstructure (batches A and B) before the pre-treatment, a same pre-treatment process could lead to surfaces before the conversion process which were not exactly the same. A slight difference was ob served in the relative electroactive copper content between the three types of samples studied with a higher content for the polished samples and especially for alloy B. Moreover, even if, after surface treatments, the surface morphology at the microscale corresponded to a scalloped surface for all the samples, at the macroscale more defects were ob served on the laminated surfaces related to the rolling process. lt was now of interest to determine whether these differences could have a significant impact on the chemical conversion process and therefore modify the protective properties of the TCP coatings. To go further in this investigation, the kinetics of growth, structure, morphology and protective properties of the TCP coatings were studied.
3.2. Characterisation and properties of the TCP coatings 3.2.1. Kinetics of growth of the TCP coatings
The OCPs of the three samples after pre-treatment during immersion in the conversion solution (SocosurfTCS) are shown in Fig. 7. Globally, the shape of the curves was the same for all samples: the OCP displayed an initial rapid fall, a subsequent small peak and a graduai rise to a relatively steady state value. According to literature [9,16,45,46], the initial decrease of the OCP was attributed to thinning of the air-formed oxide film on the alloy surface. Such a thinning enabled the electro chemical reactions to proceed [47]. Then, the OCP increase was related
to the deposition of the conversion layer on the alloy surface. The OCP plateau observed should be correlated to a complete coverage of the alloy surface by the TCP coating. As suggested by Andreatta et al. [46], further deposition on the alloy surface should lead to an increase of the thickness of the conversion layer without affecting the OCP. Compar ison of the three curves showed that the minimal OCP value was Jess negative ( - 1.02 V /SCE) for polished sample of alloy B compared to laminated sample ( -1. 05 V /SCE) and polished sample ( -1.10 V /SCE) of alloy A. Further, considering that the OCP was stable when the dif ference between two successive values was < 0.003 V (blue lines in
Fig. 7), the OCP curves suggested that the surface of the samples was completely covered by the TCP coating after about 32 s, 33 s and 37 s for laminated sample of alloy A, polished sample of alloy B and polished sample of alloy A respectively. Therefore the growth of the TCP coating was assumed to be slightly faster on laminated sample of alloy A and polished sample of alloy B compared to polished sample of alloy A. The difference in the kinetics of growth of the TCP coatings should be linked to the roughness but also to differences in chemistry of the surface after the pre-treatment. According to literature, the mechanism of deposition was based on the local raise of pH on the alloy surface. During the OCP decrease, the initial oxide film is dissolved due to fluoride ions leading to the dissolution of aluminium and a shift of the electrode potential to the negative direction. Protons and oxygen reduction occurs accom panied by a local increase in pH which favors the precipitation of hy drated zirconia film and hydrated chromium oxide [7]. Li et al. [17] showed that, with a greater surface roughness, the TCP coating formed Jess completely leading to a less-continuous coating which was in agreement with our results. Therefore, even if differences in water contact angle were not significant for the different surfaces after pre treatment (Fig. 6), the greater roughness observed for laminated sample of alloy A increased slightly the kinetics of growth of the TCP coating. Moreover, previous results showed that at least the initial stages of coating growth could be affected by electroactive copper before it is covered by the growing coating [9,16,45]. Indeed, electroactive copper constitutes cathodic sites where protons and oxygen reduction can occur leading to a local increase of pH that promotes the precipitation of chromium- and zirconium-rich layer. The stronger surface copper coverage observed for polished sample of alloy B should explain a fast kinetics of growth of the TCP coating.
- - - A laminated -- B polished ··· A polished -0.4 _-o.5
�
U -0.6 VI 111 -0.7 ::,, ::: -0.8 2..-o.9e
-1.0 O -1.l -1.2---
('a)
--� -" .. -,. .. -riCffl.WC�.� ... , ... , 0 ---100 200 300 t (s) 400 500 600 -0.4 --0.5
�
U -0.6 VI 111 -0.7 ::,, --os>
_o:9e
-1.0 O -1.l -1.2 0 '---
:
--:---
11
11
---� --'---
'
-
---, --
'.
---
:
--:
--- ' t•
·
---
�
--�-��
�
-
-
�
�
·-
�
-
�
-
�-
-=-:
:-::-
::-::-=-
::1
,:\.
..
::
..
::.::
..
::
.. --: ..
�
... ::
.. ::;
--
-
rr
::.
:::
.::
.
:: .. ::.:: .. ::.:: .. ::
.
::
.. ::.::-.. .
10 20 30 t (s) 40 50 60Fig. 7. a) Variation of the OCP of the pre-treated M 2024 - T3 with immersion time in the conversion bath (SocosurfTCS). Curves are plotted for polished samples of alloys A and B and !aminated sample of alloy A. b) Zoom on the first times of the coating growth.
A laminated A polished B polished
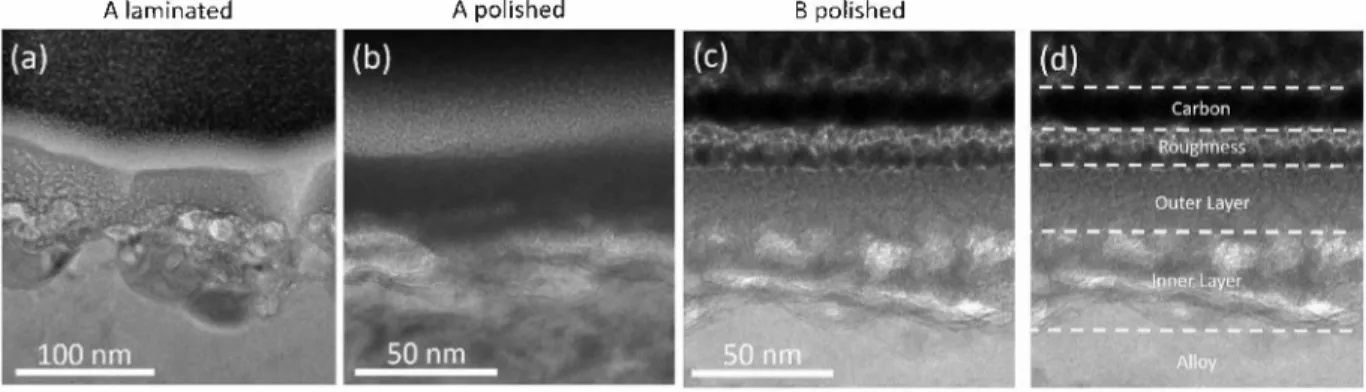
Fig. 8. TEM images of the cross-sections of the TCP coatings grown on AA 2024 - T3 samples for a) laminated samp!e of alloy A, b) polished samp!e of alloy A and c) polished sample of alloy B. The different layers are clear!y indicated in figure d) (corresponding to image c). TEM observations are performed for TCP coatings without the post-treatment in PACS bath.
3.2.2. Structure and morphology of the TCP coatings
TEM images of the cross-sections of the TCP coatings grown during immersion of the AA 2024 samples in the conversion bath without the PACS post-treatment are shown in Fig. 8. Independent of the samples, the TCP coating was formed of two distinct layers. EDS line analysis allowed to distinguish an outer layer mainly composed of chromium and zirconium oxide, hydroxide and/or oxy-hydroxide and an inner part corresponding to a mixture of aluminium fluoride and aluminium oxide as previously shown by different authors [7,48]. Another im portant aspect was the difference in thickness between the different samples assessed by different TEM observations. For polished sample of alloy A, the total thickness of the layer was around 50 nm (Fig. 8 b). For polished sample of alloy B (Fig. 8 c), the total thickness could be evaluated between 60 and 75 nm taking into account or not an extemal defective layer called as "roughness" in Fig. 8 d. For the laminated sample of alloy A, a strong heterogeneity in thickness of the TCP coating was observed (Fig. 8 a) with 50 nm thick zones comprised be tween zones with a thickness of about 115 nm. TEM observations were well-correlated with the kinetics of growth of the TCP coatings (Fig. 7). Indeed, a fast growth of the TCP coating on the sample surface could lead to the formation of a thicker coating as shown by Viroulaud et al. [ 48] by means of ToF-SIMS analyses. These authors also showed that a quick growth was associated with a Jess homogeneous TCP coating which was observed, considering the thickness, for polished sample of alloy B and even more for laminated sample of alloy A. To complete the results, representative SEM-FEG observations of the surface of the TCP coated samples after the post-treatment in the PACS bath were per formed (Fig. 9). Observations clearly showed a low surface roughness with some growth defects for the polished samples. On the contrary, after the conversion process, the laminated samples of alloy A showed large growth defects at the surface and some cracks. The cracks could be related to the stresses generated by differences in the kinetics of coating growth above different zones of the surface but it could also be due to the exposure to vacuum in the SEM.
3.2.3. Study of the coating protective properties in sulphate solutions
First, the protective properties of the TCP coatings after PACS post treatment were determined in a low-aggressive solution, i.e. a 0.1 M Na2SO4 solution by means of EIS analysis. EIS measurements were
performed for ail coated alloys for immersion times varying from O to 28 days. As an example, Fig. 10 presents the EIS spectra plotted for the TCP coated samples after two different immersion times (0 and 14 days) at the OCP in naturally aerated 0.1 M Na2SO4 solution. Independent of
the immersion time, ail the samples showed similar EIS spectra. Visual evaluation of the spectra would lead to the identification of one time constant; however, the analysis using equivalent circuits showed that the difference between the fitted and the experimental data was the lowest using the equivalent circuit proposed by Qi et al. (Fig. 11) based on the identification of two time constants, likely related to the con version coating itself and the electrochemical processes occurring at the coating/alloy interface [9]. This circuit comprises the electrolyte re sistance (R.,), a parallel combination of the charge transfer resistance Rct and a constant phase element Qdl, and finally the coating resistance
R.:oat associated with another constant phase element Qcoat• Visual in
spection of the EIS spectra showed that, at the beginning of the im mersion (t = 0 day), the impedance modulus at 5 10-2 Hz CIZlo.osHz)
measured for 3 different surfaces can be ranked: polished alloy A > polished alloy B > laminated alloy A. As already shown by other au thors [49], higher impedance modulus is associated with improved corrosion protection of the coating which could be related to a less defective coating or to better adhesion of the coating on the metal. Moreover, the frequency ranges where high phase angles ( < - 70°;
within grey zone in Fig. 10) appeared were 5·10-2-3·101 Hz for lami
nated alloy A, ""3·10-3-5·101 Hz for polished alloy A and
1·10-2-5·101 Hz for polished alloy B. The measured frequency range of
high phase angles can be narrower with increasing coating capacitance and suggested reduced corrosion protection of the coating as shown by other authors [9,49,50]. This could be related to easier penetration of the electrolyte through defects of the coating. The results thus showed that both the TCP coatings grown on laminated sample of alloy A and
A
Laminated
A
Polished
B
Polished
-0
-A laminated
·
·
•
··
·
A
polished --B polished
-->
'-! raE
-0 .c 0�
Il +-' N N 107 106 10s 10• 103 102 101 100 107 106 105 10· 103 102 10·3 10-1 101 103Freq (Hz)
105 101 ---· 10° 10-3 10-1 101Freq (Hz)
103 105 -90 -70 !'.... QI -50f
-30 -10 . 10·3 -90 -70 !'.... QI -50f
-30 -10 10·3 10·1 101Freq (Hz)
10-1 101Freq (Hz)
103 105 105Fig. 10. EIS spectra plotted for TCP coated samples with the PACS post-treatment (polished and laminated samp!es of alloy A and polished sample of alloy B) after O day (top) and 14 days (down) of immersion in naturally aerated 0.1 M Na2S04 at OCP.
polished sample of alloy B had lower protective properties than that grown on polished sample of alloy A. This could be explained by re ferring to previous results. First, for laminated samples of alloy A, the defects observed by SEM-FEG (Fig. 9) should explain the lower pro tective properties of the TCP coating grown on this alloy. This was in agreement with works of Li et al. [17] who showed that the TCP coating formed Jess completely and with more defects on a surface with greater surface roughness. Concerning the polished sample of alloy B, the surface copper coverage measured after the pre-treatment should con tribute to explain the results. However, this was not consistent with the work of Qi et al. [16] who showed that a pre-treatment that left copper rich sponges led to more protective coatings. Further, Viroulaud et al. [ 48] concluded from their work that the presence of copper was not the main parameter. As suggested by these authors, a key parameter could be the kinetics of coating growth: a fast kinetics would lead to a thicker TCP coating with some heterogeneities and thus more susceptible to cracking. This hypothesis was consistent with our results; indeed, both laminated sample of alloy A and polished sample of alloy B showed a faster kinetics of coating growth associated with a thicker TCP coating. However, another point of interest was the EIS measurements per formed after 14 days of immersion: for these conditions, no significant difference was observed between al! the coated samples, except that the measured frequency range of high phase angles was a little narrower
(within grey zone in Fig. 10) for polished sample of alloy B. This sug gested that a self-healing mechanism could contribute to repair the defects present inside the TCP coating.
In order to evaluate more properly the protective properties of the coating, an attempt was made to determine the parameters of the previously described equivalent circuit (Fig. 11). The values calculated for O and 14 days of immersion are summarized in Table 4 in order to give quantitative data while Fig. 12 enables to show the evolution of the parameters as a function of the immersion time for the whole duration of the experiments (28 days). However, these values had to be con sidered with precautions because the differences between the experi mental results and fitted data remained significant which was probably due to the heterogeneity of the TCP coatings.
Nevertheless, some comments deserved to be done. First, it was of interest to note that, for ail the coated samples, independent of the immersion time, Rcoat values were of the order of the electrolyte re
sistance which indicated a high permeability allowing access of the electrolyte to the alloy through pores and cracks. This suggested once more that the TCP coatings presented some heterogeneities. On the contrary, Re, values were much higher (in the range of 108·Q·cm2)
showing that the protective properties of the coating were mainly due to its inner layer [9]. Globally, all the resistance values were in the same range of order when the three samples were compared. However,
Table 4
Parameters extracted from EIS spectra using the equivalent circuit of Fig. 11 for TCP coated samples exposed to a 0.1 M Na2SO4 solution at OCP.
Al!oy Surface state Immersion time ( day) Re,
Q·cm2 A Laminated 0 3.30·106 14 237·106 Polished 0 37.0·106 14 295·106 B Polished 0 11.0·106 14 42.9·106
one of the main results was probably that B polished sample exhibited the lowest Re, and Rcoat values, for ail the immersion times (except
0 day for Re, values), indicating the lowest protective properties of the coating developed on its surface. This was in agreement with previous explanations. The low Rcoat values, despite of a thick TCP coating, suggested the presence of a large number of defects such as cracks. As previously said, these cracks were most probably due to differences in kinetics of coating growth over the whole surface of the pre-treated alloy in relation with the presence of copper deposits. Conceming the laminated sample of alloy A, the low Re, values measured for this sample, in particular at the very first stage of immersion, confirmed the low protective properties of the TCP coating in agreement with pre vious explanations. However, this sample showed also the highest Rcoat values. This could be explained by referring to Qi's work [9] who showed that, by increasing the time of the coating treatment for a pure aluminium sample, Re, values decreased while Rcoat values increased. The author attributed the decrease of Re, to the accumulations of
fluoride ions at the base of the coating and the increase of Rcoat to a combination of an increase of the coating thickness and change in the coating morphology. Our previous results (Figs. 7 and 8) showed that the TCP coating grown on laminated sample of alloy A was the thickest which was in good agreement with the high Rcoat values. Further, the
Rcoat Qdl Qcoat adl Ocoat
10-• s"/(Q·cm2) 346 2.4 1.9 0.92 0.86 318 2.8 1.8 0.95 0.95 271 2.3 1.2 0.94 0.94 178 2.5 1.1 0.96 0.96 149 3.3 0.87 0.92 105 3.2 0.89 0.94
great initial roughness should explain the accumulation of fluoride ions near the base of the coating, at least on some parts of the surface, re ducing the protective properties of this coating as suggested also by Viroulaud et al. [ 48]. Conceming the CPE parameters, as previously said, values had to be considered with precautions but the lower acoat combined with higher Ocoat values at the beginning of the immersion for laminated sample of alloy A compared to other samples suggested a strong heterogeneity of the coating in agreement with previous com ments. Moreover, results confirmed a lower corrosion protection at the beginning of the immersion for laminated sample of alloy A and po lished sample of alloy B with an enlarged Qd1 and smaller exponent nc11
[49,51]. Finally, results showed that ail parameters only slightly evolved as a fonction of the immersion time which could be related to the low agressivity of the electrolyte.
Therefore, the results showed that, depending on the microstructure and surface state of the alloy before the pre-treatment, the properties of the surface obtained after the pre-treatment step could be different leading to measurable differences in the protective performance of the TCP coatings in low-aggressive solution.
3.2.4. Srudy of the coating protective properties in chloride solutions
To complete the results, OCP measurements and potentiodynamic
□ A laminated
•
A polished
•
B polished
-NE
�
E
.s:.
0
1.00.,
C, 0.90 0.80a
109 �---� □�--• t-, 108 107 106 0• •
D•
• •
---0'
D...
...
...
...
10 20Immersion time (days)
i
1
10 20
Immersion time (days)
...
30 301
--- ---
---
-
1
--.
--.
---·
---
- - - -.
---
.
-, , , e 1 , , , 1 1 e e 1 • 0 10 20 30Immersion time (days)
-NE
�
E
.s:.
0
-
....
CJ:.u 1000 100 10 1 0� �
...
.
�
'
---
...
---
•
---I. _
---10 20 30Immersion time {davsl
.... 1.00 ,--•----•---•
---�
•t � li
�
■
Il
uo 90 ---CS . )....
ra 0 0.80 0 10-4 10-s 10-6 10-7 10 20 30Immersion time (days)
t
--
•
-
i
---
i
- -
+
----
•
11 1 f 1 1 1 1 1 1 1 1 1 1 1
0 10 20 30
Immers
i
on time (days)
Fig. 12. Parameters for the TCP coated samp!es with the PACS post-treatment (polished and laminated samp!es of alloy A and polished samp!e of alloy B) vs the immersion time in naturally aerated 0.1 M Na2SO4 solution. Parameters are extracted from EIS data using the equivalent circuit given in Fig. 11.
-0.50 -0.55
a-
-0.60 Ill -0.65>
-0.70 �-0.75 � -0.80 -0.85 -0.90- · - Bare A laminated - - -A Laminated
··· A polished -- B polished 0
··· ..
,,... .
---
�
'
----
-
-
�
-
�
_
,.,,_
______ _
---
�
---
'
--- ',---m---
---
-
- -
. ----1000 2000 Time (s) 3000 4000Fig. 13. OCP versus immersion time in 0.5 M NaCI solution for the TCP coated samples with the PACS post-treatment (polished and laminated samples of alloy A and polished sample of alloy B). The OCP curve was also reported for the bare !aminated samp!e of alloy A for comparison.
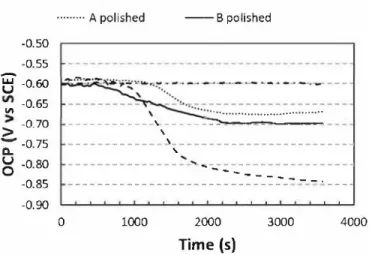
polarisations were performed in 0.5 M NaCI solution. NaCI solution was assumed to be more representative of the in-service conditions; fur thermore, it was also more representative of the industrial tests such as neutral sait spray tests. Fig. 13 shows the OCP versus immersion time in 0.5 M NaCI conditions for the TCP coated samples after PACS post treatment. Ail curves showed relatively stable OCP values in the first 10 min (600 s in Fig. 13); the values were similar for the three samples. Then, the OCP values decreased to reach after 40 min (2400 s) a plateau value of -0.67V vs SCE and -0.70V vs SCE for polished sample of alloy A and B respectively. The experiments were performed at least three times and the results were reproducible for the two samples. For laminated sample of alloy A, the OCP curves exhibited a stronger de crease after 10 min and reached after about 1 h a plateau with OCP values comprised between of -0.85 V vs SCE and -O. 73 V vs SCE. This Jack of reproducibility in the OCP plateau values for the laminated sample of alloy A should be related to the heterogeneities observed in the TCP coating (Figs. 8 and 9) which could vary from one sample to another. In the same solution, the bare alloys showed stable OCP values at around - 0.6 V vs SCE. For the three TCP coated samples, the more negative OCP values reached after 1 h of immersion compared to the bare alloy should be related to a reduction of the kinetics of the oxygen reduction on the sample surface due to the TCP coating [7]. The ex istence of two OCP plateaus suggested that the TCP coatings evolved during immersion in the electrolyte as previously observed in sulphate solution (Fig. 10) with a slight increase of IZlo.osttz between O and
14 days of immersion. Ali results were also in agreement with po tentiodynamic results (Table 5). Comparison of the potentiodynamic polarisation curves in the cathodic demain showed that the cathodic current densities were shifted towards lower values for the TCP coated samples compared to the bare samples. For the bare samples, the values
Table 5
Values deduced from the potentiodynamic polarisation curves p!otted after 1 h at the OCP. Ali experiments were performed in 0.5 M NaC! solution for the TCP coated samp!es (polished and laminated samples of alloy A and polished samp!e of alloy B).
Samples Bare laminated A TCP coated samples Laminated A Polished A Polished B Îcath (A cm -2) at E = -0.9V vs SCE 4-10-5 1-10-• 1-10-• 1-10-• Ecorr (V VS i00rr (A cm-2) E,,,, (V vs SCE) SCE) -0.59 3-10-• -0.59 -0.74 6.3•1o-• -0.60 -0.67 7.9•10-• -0.57 -0.70 1-10-• -0.59
are given for the laminated sample of alloy A only; similar values are obtained for the other bare alloys. This confirmed that the TCP coatings reduced the oxygen availability near the substrate, resulting in cathodic inhibition [16,52]. Furthermore, when the curves were plotted after only 10 min of immersion in the chloride solution (results not shown), only a very short passivity plateau was observed while the passivity plateau was larger when the curves were plotted after 1 h of immersion. This suggested once more either a modification of the TCP coating thickness or a change in the structure, at least in the external layer, during immersion in the electrolyte. Another important result was that, for ail coated samples, pitting was observed with similar values of Epit for ail samples. The results therefore showed that the TCP coatings provided an efficient protection against corrosion mainly due to phy sical blocking by the TCP coating of the oxygen reduction. However, no significant differences were observed between the three coated samples with similar cathodic current densities and Epi, values. EIS measure ments (not shown) led to the same conclusions. This suggested that the differences in protective properties measured previously in a low-ag gressive solution were not significant in a more aggressive solution.
3.2.5. Comparison with mdustrial tests
Because the protective properties of conversion coatings are of major importance for the aeronautical industry, we chose to test also the coating performance using industrial tests, i.e. neutral sait spray tests (NSST). NSST results, reported in Fig. 14, showed that ail the coated samples exhibited at least one pit after 300 h of exposure and > 5 pits after 450 h. This was consistent with previous results that showed only slight differences in protective performance between the different samples in a low-aggressive solution and no significant dif ferences in NaCI solution. This highlighted also that NSST were too much aggressive to distinguish between different conversion coatings while even slight differences in protective properties could be shown in low aggressive solution.
4. Conclusions
The protective properties of TCP coatings grown on alloy 2024-T3 were studied for two different batches; the influence of the initial sur face state (laminated and polished) was studied also. The main con clusions are the following.
1) In a low-aggressive solution, i.e. 0.1 M Na2SO4, the protective
properties of the TCP coatings decreased when the roughness of the initial surface increased. Furthermore, improved protective
600 500 � 400 ::::1
e-
300 41.2
200 � 100 0-A1aminated Apolished Bpolished
■
5 pits■
4 pits � 3 pits � 2 pits=
1 pit Ill O pitFig. 14. Neutra! sait spray test results obtained for TCP coated samp!es with the PACS post treatment of alloys A and B.