Structural modifications of cellulose samples after dissolution into various solvent systems
13
0
0
Texte intégral
Figure
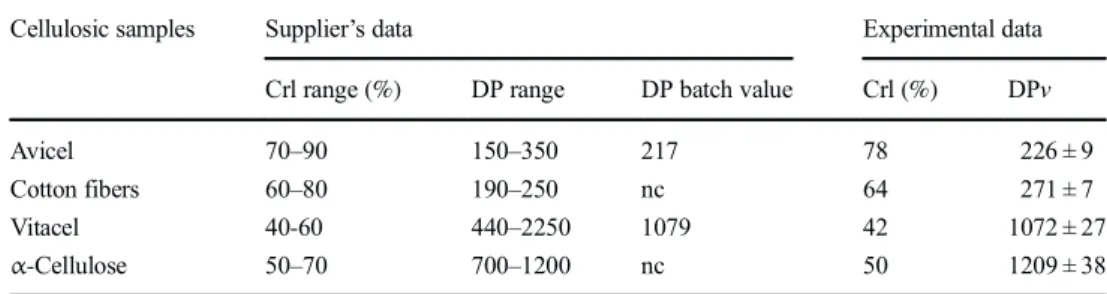
![Table 6. The viscosimetric method using dissolution in cuproethylenediamine [35] is not ideal but is recognized to give a good approximation of the cellulose DP, excluding the effect of hemicellulosic polymers, and allowing a fair com-parison of the effec](https://thumb-eu.123doks.com/thumbv2/123doknet/3166201.90302/9.892.129.764.115.832/viscosimetric-dissolution-cuproethylenediamine-recognized-approximation-cellulose-excluding-hemicellulosic.webp)
+2
Documents relatifs