ISSN: 1524-4539
Copyright © 2009 American Heart Association. All rights reserved. Print ISSN: 0009-7322. Online 72514
Circulation is published by the American Heart Association. 7272 Greenville Avenue, Dallas, TX
DOI: 10.1161/CIRCULATIONAHA.108.808857
2009;120;69-75; originally published online Jun 22, 2009;
Circulation
Luc Piérard and Pascal Guéret
Jean-Luc Monin, Patrizio Lancellotti, Mehran Monchi, Pascal Lim, Emmanuel Weiss,
Stenosis
Risk Score for Predicting Outcome in Patients With Asymptomatic Aortic
http://circ.ahajournals.org/cgi/content/full/CIRCULATIONAHA.108.808857/DC1
Data Supplement (unedited) at:
http://circ.ahajournals.org/cgi/content/full/120/1/69
located on the World Wide Web at:
The online version of this article, along with updated information and services, is
http://www.lww.com/reprints
Reprints: Information about reprints can be found online at
journalpermissions@lww.com 410-528-8550. E-mail:
Fax: Kluwer Health, 351 West Camden Street, Baltimore, MD 21202-2436. Phone: 410-528-4050. Permissions: Permissions & Rights Desk, Lippincott Williams & Wilkins, a division of Wolters
http://circ.ahajournals.org/subscriptions/
Risk Score for Predicting Outcome in Patients With
Asymptomatic Aortic Stenosis
Jean-Luc Monin, MD, PhD; Patrizio Lancellotti, MD, PhD; Mehran Monchi, MD; Pascal Lim, MD;
Emmanuel Weiss, MD; Luc Piérard, MD, PhD; Pascal Guéret, MD
Background—The management of patients with asymptomatic severe aortic stenosis remains controversial. We sought to
develop a continuous risk score for predicting the midterm development of symptoms or adverse events in this setting.
Methods and Results—We prospectively followed 107 patients with asymptomatic aortic stenosis (aged 72 years [63 to
77]; 35 women; aortic-jet velocity, 4.1 m/s [3.5 to 4.4]) at a single center in France. Predefined end points for assessing outcome were the occurrence within 24 months of death or aortic valve replacement necessitated by symptoms or by a positive exercise test. Variables independently associated with outcome were used to build a score that was validated in an independent cohort of 107 patients from Belgium. Independent predictors of outcome were female sex, peak aortic-jet velocity, and B-type natriuretic peptide at baseline. Accordingly, the score could be calculated as follows: Score⫽[peak velocity (m/s)⫻2]⫹(natural logarithm of B-type natriuretic peptide⫻1.5)⫹1.5 (if female sex). Event-free survival after 20 months was 80% for patients within the first score quartile compared with only 7% for the fourth quartile. Areas under the receiver operating characteristic curve for the score were 0.90 and 0.89 in the development and validation cohorts, respectively.
Conclusions—If further validation is achieved, this score may be useful to predict outcome in individual patients with
asymptomatic aortic stenosis to select those who might benefit from early surgery. (Circulation. 2009;120:69-75.)
Key Words: echocardiography 䡲 natriuretic peptides 䡲 risk score 䡲 stenosis 䡲 valves
A
ccording to current guidelines, severe symptomatic aor-tic stenosis (AS) is a straightforward indication for valve replacement.1,2In contrast, the decision to operate onasymp-tomatic patients remains a source of debate.1,2 The risk of
sudden death without preceding symptoms remains a matter of concern,3 as well as the risk of irreversible myocardial
damage due to left ventricular (LV) hypertrophy.4
Further-more, the potential for rapid disease progression and excess mortality in patients with even moderate AS has been pointed out recently.5Prospective studies have demonstrated the poor
midterm outcome of asymptomatic patients with high peak aortic-jet velocity at baseline6 or moderate to severe valve
calcification.7 The prognostic value of B-type natriuretic
peptide (BNP) serum level, reflecting LV end-systolic wall stress, has also been evaluated.8 –12However, no single value
is an absolute criterion to define hemodynamic severity or to predict the development of symptoms because functional capacity in AS is the result of a complex interplay between the aortic valve, the LV, and the systemic vasculature.13Thus,
to select the patients who are likely to benefit from early surgery, a continuous score integrating valve and ventricular-related parameters might be more appropriate. Therefore, we
prospectively followed 107 asymptomatic patients with mod-erate to severe AS at a single center in France. Independent predictors of outcome were integrated to build a continuous risk score, designed to predict the midterm development of symptoms or other adverse events. This score was then validated in an independent set of 107 patients from Belgium.
Editorial see p 9
Clinical Perspective on p 75
Methods
PatientsThe development cohort consisted of 107 consecutive patients referred to the Echocardiography Laboratory at Henri Mondor University Hospital (Créteil, France) and prospectively enrolled on the basis of the following criteria: (1) moderate to severe AS, defined1by a peak aortic-jet velocityⱖ3.0 m/s and/or aortic valve
areaⱕ1.5 cm2; (2) absence of symptoms; (3) normal LV function
defined by an ejection fractionⱖ50% without segmental wall motion abnormality by echocardiography; (4) normal sinus rhythm; (5) no more than mild associated cardiac valve lesion; and (6) serum creatinine⬍160mol/L. The validation cohort included 107 con-secutive patients with asymptomatic AS, who were prospectively followed at Sart Tilman University Hospital (Liège, Belgium). Both
Received July 22, 2008; accepted April 27, 2009.
From Assistance Publique-Hôpitaux de Paris, Department of Cardiology, Henri Mondor University Hospital, Créteil, France (J.-L.M., P.L., E.W., P.G.); Department of Intensive Care Medicine, Institut Jacques Cartier, Massy, France (M.M.); and Sart Tilman University Hospital, Liège, Belgium, (P.L., L.P.).
The online-only Data Supplement is available with this article at http://circ.ahajournals.org/cgi/content/full/CIRCULATIONAHA.108.808857/DC1.
Correspondence to Dr Jean-Luc Monin, Department of Cardiology, Henri Mondor Hospital, 51 avenue De Lattre de Tassigny, 94010 Créteil, France. E-mail jean-luc.monin@hmn.aphp.fr
© 2009 American Heart Association, Inc.
Circulation is available at http://circ.ahajournals.org DOI: 10.1161/CIRCULATIONAHA.108.808857
centers used the same inclusion criteria, the same protocol for echocardiographic and BNP measurements, and the same indications for valve replacement according to current guidelines.2This study was
approved by both local institutional ethics committees, and written informed consent was obtained from all patients before enrollment. Echocardiography
Comprehensive Doppler echocardiography, including M-mode, 2-dimensional echocardiography, color Doppler, and pulsed-wave and continuous-wave Doppler measurements, was performed in all patients at baseline and at each follow-up visit. Patients in the development cohort were evaluated mainly by a single senior echocardiographer (J.-L.M.; 90% of examinations) with the use of commercially available systems. In 17 patients, the baseline echo-cardiography was repeated by the same physician after 25 (18 to 37) days. Thus, intraobserver variability was as follows (mean⫾SD): LV outflow tract diameter, 0.1⫾0.5 mm; LV outflow tract time-velocity integral, 0⫾3 cm; peak aortic-jet velocity, 0.0⫾0.3 m/s; mean transaortic pressure gradient,⫺1⫾6 mm Hg; and aortic valve area, 0.01⫾0.09 cm2. The suspected origin of AS was determined
accord-ing to current criteria.7Peak aortic-jet velocity was derived from
transaortic flow, recorded with continuous-wave Doppler with a multiwindow approach.6Aortic valve area was calculated by the
continuity equation14and indexed to body surface area. The degree
of aortic valve calcification was assessed from echocardiographic zoomed short-axis views and scored on a 4-grade scale according to Rosenhek et al.7
Exercise Testing
Symptom-limited graded bicycle exercise tests were performed at inclusion in 89 patients (83%) of the development cohort. After an initial workload of 25 W maintained for 2 minutes, the load was increased by steps of 25 W every 2 minutes. Twelve-lead ECG was monitored continuously and recorded every 2 minutes with blood pressure measurements. The exercise test was considered abnormal if any of the following events occurred during exercise: dyspnea, angina, syncope or near syncope; insufficient rise in systolic blood pressure (⬍20 mm Hg) or fall in blood pressure compared with baseline;⬍80% of the normal level of exercise tolerance according to age- and sex-adjusted levels;ⱖ2 mm horizontal or downsloping ST-segment depression compared with rest; ventricular tachycardia or⬎4 premature ventricular complexes in a row.15
BNP Measurements
Venous blood samples for BNP were drawn before echocardiogra-phy or any exercise test after 20 minutes of supine rest. Chilled ethylenediaminetetra-acetic acid tubes were centrifuged immediately at 4000g (4°C) for 15 minutes. Separated plasma samples were processed by immunofluorescence assay (Beckman-Coulter, Bio-site). The interassay and intra-assay variations were 5% and 4%, respectively. The assay detection limit was 1 pg/mL.
Follow-Up
Follow-up visits were scheduled every 6 to12 months, according to guidelines.1,2 Each visit included a clinical evaluation, BNP
mea-surements, Doppler echocardiography, and exercise testing (if indi-cated and applicable). Valve replacement was indiindi-cated according to current guidelines (ie, occurrence of symptoms or abnormal exercise test [symptoms or abnormal blood pressure response during exer-cise]).2Predefined end points for assessing outcome in the
develop-ment cohort were the occurrence within 24 months after enrolldevelop-ment of death (any cause) or aortic valve replacement necessitated by symptoms or by a positive exercise test.2 We chose a 24-month
period because it seemed to be the shortest clinically relevant interval for delaying surgery according to a “wait-for-symptom” strategy. Statistical Analysis
Descriptive data are reported as proportions for qualitative variables and median (quartile 1 to quartile 3) for continuous variables, unless otherwise indicated. In the development cohort, baseline variables
previously described as associated with outcome (age,7sex,16cause
of AS and calcification score,7 peak velocity, mean transaortic
pressure gradient and valve area,3,6and BNP serum level8,10,11) were
screened for association with the 24-month end point. We used2
tests for categorical data. To assess the relationship between each numerical variable and the 24-month end point, we first plotted continuous variables against the 24-month end point, and we used the Lowess smoothing function with locally weighted least squares to identify proportional relationships. The results of this procedure indicated that for BNP, a natural logarithm transformation is needed for proportionality. The associations linking numerical variables to the 24-month end point were evaluated by Mann-Whitney U tests. P values⬍0.05 were considered statistically significant. All statistical tests were 2-tailed.
Variables significantly associated with outcome in univariable analysis were included in a multiple logistic regression model.17–19
We used backward elimination of nonsignificant variables to define a simple score. Then the  coefficient of each of the variables independently associated with a 24-month end point was used to build the score.20
Finally, we evaluated the score performance to predict the 24-month composite end point in the development cohort and an independent validation cohort of 107 patients. To evaluate discrim-ination, the area under the receiver operating characteristic curve was determined.21To evaluate calibration, Hosmer-Lemeshow
goodness-of-fit tests using 5 quintiles of poor outcome were performed.
Results
Characteristics and Outcomes in the Development CohortIn the development cohort, follow-up information was avail-able for 104 patients (97%). On the basis of patient history and echocardiographic analysis, the suspected origin of AS was calcification of a 3-leaflet (n⫽75), bicuspid (n⫽22), or unicuspid (n⫽1) aortic valve, rheumatic disease (n⫽2), radiotherapy (n⫽2), or undetermined (n⫽2). According to current guidelines, AS was severe or moderate in 75 and 29 patients, respectively. Predefined end points were reached in 62 patients within 8 months (5 to 13) including 3 deaths, 58 aortic valve replacements, and 1 patient who refused surgery despite development of symptoms and a positive exercise test. Of note, 90% of outcomes in this group (n⫽56) occurred before 20 months. One patient died postoperatively (operative mortality, 2%) at day 4 from right ventricular failure. In contrast, 42 patients remained free of clinical event after 32 months (26 to 45) of follow-up. Patients’ characteristics according to outcome are given in Table 1.
Deaths Before Surgery
Three patients from the development cohort died before surgery. A 79-year-old man with moderate AS (peak velocity, 3.9 m/s; aortic valve area, 1.1 cm2; BNP, 245 pg/mL) died of
pneumonia after 6 months. A 75-year-old woman with severe AS (peak velocity, 4.6 m/s; aortic valve area, 0.7 cm2; BNP,
56 pg/mL) died of bowel cancer at 10 months. A 71-year-old man with moderate AS (peak velocity, 3.5 m/s; aortic valve area, 1.2 cm2; BNP, 34 pg/mL) died of aortic endocarditis at
14 months.
Valve Replacement Indicated by Exercise Test Results
Valve replacement was indicated for an abnormal exercise test at baseline in 11 patients (aged 76 years [70 to 78]; peak
velocity, 4.1 m/s [3.7 to 4.5]; BNP, 175 pg/mL [62 to 240]). These tests were considered positive for dyspnea (n⫽3), fall of systolic blood pressure (n⫽4), or insufficient rise in blood pressure (n⫽4, associated with significant ST depression in 2 cases). These 11 patients underwent surgery within 2 months (1 to 4). Seven other patients underwent surgery within 9 months (7 to 14) for an abnormal exercise test during follow-up (insuffi-cient rise in blood pressure in 5 or dyspnea in 2).
Other Indications for Valve Replacement
Aortic valve replacement was necessitated by the develop-ment of symptoms in 37 patients within 10 months (7 to 16) (dyspnea, n⫽32; angina pectoris, n⫽3 including 1 patient with associated dyspnea; syncope, n⫽2). Four patients (aged 67 years [65 to 73]; 3 women; peak aortic-jet velocity, 4.3 m/s [4.0 to 4.4]; serum BNP, 38 pg/mL [36 to 48]) underwent valve replacement within 3 months (1 to 6) after enrollment, without symptom or positive exercise test. Surgery was performed at the discretion of the referring physician in 3 cases, whereas the fourth patient was a 31-year-old woman with severe AS who wanted to schedule pregnancy. Data from these 4 latter patients were censored at the time of valve replacement.
Predictors of Outcome/Building of the Risk Score
Variables associated with the 24-month end point by univari-able and multivariunivari-able analysis are given in Tunivari-able 2.
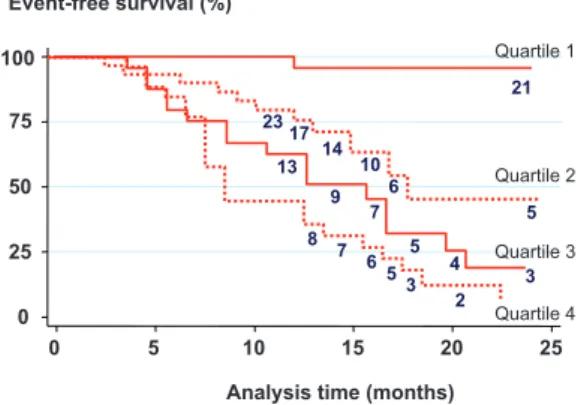
Accord-ing to multivariable analysis, 3 parameters were independent predictors of outcome: female sex, serum BNP, and peak aortic-jet velocity at baseline. For each individual patient, a risk score was calculated according to the following formula: Score⫽[peak velocity (m/s)⫻2]⫹(natural logarithm of BNP⫻1.5)⫹1.5 (if female sex). Of note, there were no threshold values for the continuous variables included in the model (Figures I and II in the online-only Data Supplement). Kaplan–Meier analysis of symptom-free survival according to the score quartiles in the development cohort is shown in Figure 1.
Characteristics and Outcomes in the Validation Cohort
The validation cohort consisted of 107 consecutive patients with the following baseline characteristics: age, 71 years (66 to 78); 42 women (39%); peak aortic-jet velocity, 4.1 m/s (3.7 to 4.6); aortic valve area, 0.8 cm2(0.7 to 0.9); mean pressure
gradient, 42 mm Hg (34 to 49); serum BNP, 59 pg/mL (33 to 113). The suspected origin of AS was calcification of a 3-leaflet valve (n⫽93), bicuspid aortic valve (n⫽12), or rheumatic disease (n⫽2). Events occurred in 56 patients within 11 months (7 to 16), including 5 deaths, 41 valve replacements, and 10 patients who developed symptoms (3 refused surgery, and 7 were on the waiting list at the time of last follow-up). The median follow-up duration in the
vali-Table 1. Characteristics of the 104 Patients Prospectively Followed in the Development Cohort, According to the 24-Month End Point
Characteristic*
Whole Group (n⫽104)
Remained Asymptomatic (n⫽42)
End Point Within
24 Months (n⫽62) P Age, y 72关63–77兴 70关53–77兴 74关65–78兴 0.16 Female sex, n (%) 35 (34) 9 (21) 26 (42) 0.03 Serum BNP, pg/mL 58关30–111兴 30关14–64兴 83关47–165兴 0.0001 BNP at first follow-up, pg/mL 66关32–173兴 36关16–71兴 161关64–242兴 0.0001 Creatinine,mol/L 96关84–109兴 97关85–106兴 94关83–116兴 0.97
Aortic valve anatomy 0.002
Three-leaflet valve, n (%) 75 (72) 23 (55) 52 (84)
Bicuspid aortic valve, n (%) 22 (21) 13 (31) 9 (15)
Calcification score 3 to 4, n (%) 72 (69) 24 (57) 48 (77) 0.01 Peak velocity, m/s 4.1关3.5–4.4兴 3.6关3.2–4.0兴 4.3关3.9–4.6兴 0.0001 Progression in peak velocity, m/s per year 0.3关0.0–0.5兴 0.2关0.0–0.4兴 0.4关0.1–0.6兴 0.27 Mean pressure gradient, mm Hg 40关31–50兴 33关24–40兴 47关36–55兴 0.0001 Valve area, cm2 0.9关0.8–1.1兴 1.1关1.0–1.3兴 0.8关0.7–1.0兴 0.0001
Indexed area, cm2/m2 0.5关0.4–0.6兴 0.6关0.5–0.7兴 0.5关0.4–0.5兴 0.0001
LV end-diastolic diameter, mm 51关47–53兴 51关48–52兴 50关47–53兴 0.67 LV end-systolic diameter, mm 29关27–32兴 29关26–32兴 29关27–33兴 0.50 Interventricular septum (diastole), mm 12关11–13兴 12关11–13兴 12关11–13兴 0.48 LV posterior wall (diastole), mm 12关11–13兴 12关10–13兴 12关11–13兴 0.24 LV ejection fraction, % 67关62–72兴 68关65–72兴 66关60–70兴 0.08 Known coronary artery disease, n (%) 23 (22) 10 (24) 13 (21) 0.87
Diabetes mellitus, n (%) 13 (12) 4 (10) 9 (15) 0.42
Hypertension, n (%) 58 (56) 22 (52) 36 (58) 0.48
Hypercholesterolemia, n (%) 38 (37) 16 (38) 22 (35) 0.83
Values in square brackets are quartile 1 to quartile 3.
dation sample was 21 months. Of note, 90% of outcomes (n⫽50) occurred before 20 months in this group. Five patients from the validation cohort died before surgery (Table 3), all from cardiac causes (congestive heart failure, n⫽2; sudden death, n⫽2; acute pulmonary edema, n⫽1). One patient died postoperatively (operative mortality, 2%). Valve replace-ment was necessitated by the developreplace-ment of symptoms in 29 patients within 11 months (7 to 14). The main symptoms were dyspnea, angina pectoris, or syncope in 18, 8, and 3 patients, respectively. In the remaining 12 patients, surgery was per-formed for new onset of atrial fibrillation (n⫽1), positive exercise test (n⫽6), or equivocal symptoms (n⫽5). In contrast, 51 patients remained free of clinical event after 21 months (18 to 27) of follow-up. The median value of the risk score in the validation cohort was 14.9 (13.5 to 16.5). Of note, the score values of all 5 patients who died before surgery were in the third and fourth score quartiles (Table 3). Kaplan–Meier analysis of symptom-free survival according to the score quartiles in the validation cohort is given in Figure 2. This analysis shows a progressive decrease of midterm event-free survival according to each score quartile, without significant difference compared with the validation cohort.
Prognostic Value of the Score Over its Range
By pooling the development and the validation cohorts (n⫽211 patients), the median score value was 14.8 (13.2 to 16.3). The adverse event rate according to continuous score values in this combined cohort is shown in Figure 3. This figure shows a low event rate (⬍10%) for score values ⬍11, with a steep linear increase between 11 and 16 a slower increase in the high-risk range (⬎75%) for values ⬎16.
Score Performances in the Development and Validation Cohorts
The area under the receiver operating characteristic curve for the score was 0.90 (95% confidence interval, 0.84 to 0.96) in the development cohort and 0.89 (95% confidence interval, 0.84 to 0.96) in the validation cohort, indicating a good discrimination, with a significant improvement in both cohorts compared with peak velocity or BNP levels when considered alone (Table 4).
Discussion
The decision to operate on asymptomatic patients with severe AS remains a source of debate. The rationale for a wait-for-symptom strategy is supported by the rarity of sudden death without preceding symptoms.3,7,22 Therefore, the combined
risks of surgery and prosthesis-related events probably out-weigh the risk of sudden death in a truly asymptomatic patient.1,2However, there is a risk of death while the patient
is on the waiting list for surgery7and a risk of progressive and
eventually irreversible myocardial damage.4 Therefore, risk
stratification is clinically important.
In this study, we developed a risk score based on the 3 independent predictors of midterm outcome in a population of asymptomatic patients with mostly severe AS. According to this score, 80% of patients within the first quartile remained free from events after 20 months of follow-up. In contrast, only 7% of patients within the fourth score quartile remained free of events after 20 months.
Independent Predictors of Outcome in Asymptomatic AS
Our results confirm the high prognostic impact of peak aortic-jet velocity at baseline to predict the occurrence of
Event-free survival (%)
Analysis time (months)
21 0 25 50 75 100 0 5 10 15 20 25 23 17 14 10 6 5 13 9 7 5 4 3 8 7 6 53 2 Quartile 1 Quartile 3 Quartile 2 Quartile 4
Figure 1. Kaplan–Meier analysis of symptom-free survival
according to the score quartiles in the development cohort. The respective values for score quartiles 1 to 4 were 12.9, 14.6, 16.2, and 19.7. Numbers below each slope represent the patients at risk at each time point.
Table 2. Predictors of Outcome in the Development Cohort by Univariable and Multivariable Analysis Univariable Analysis Multivariable Analysis
Variable Odds Ratio (95% CI) P Odds Ratio (95% CI) P
Female sex 2.65 (1.08–6.5) 0.03 5.21 (1.46–18.6) 0.01
Serum BNP* 4.0 (2.2–7.2) 0.0001 3.87 (1.84–8.1) 0.0001
Three-leaflet valve 4.3 (1.7–10.7) 0.002 2.34 (0.56–9.7) 0.24 Calcification score 3–4 3.1 (1.3–7.5) 0.01 2.11 (0.61–7.2) 0.23
Peak velocity† 5.4 (2.45–11.8) 0.0001 6.2 (2.1–17.9) 0.001
Transaortic mean pressure gradient‡ 1.09 (1.05–1.13) 0.0001 1.14 (0.93–1.39) 0.22 Aortic valve area§ 0.59 (0.47–0.74) 0.0001 0.86 (0.63–1.16) 0.32 Indexed valve area㛳 0.42 (0.28–0.63) 0.0001 0.7 (0.4–1.2) 0.23
Variables are given at baseline unless indicated otherwise. CI indicates confidence interval. *Odds ratios are expressed per log unit increase in marker levels.
†Odds ratios are expressed per 1 unit increase⬎2. ‡Odds ratios are expressed per 1 unit increase⬎10. §Odds ratios are expressed per 0.1 increase⬎0.5. 㛳Odds ratios are expressed per 0.1 increase ⬎0.3.
symptoms or adverse events.6In contrast to the findings of
Rosenhek et al,7neither the annual rate of progression in peak
velocity nor the degree of valve calcification was indepen-dently predictive of outcome in the present study. This might be explained for 2 main reasons. First, because of the wider range of velocities at the time of inclusion in this study, the prognostic impact of baseline velocity might preclude the effect of its annual progression. Second, the most powerful predictor of outcome in our study (ie, serum BNP) was not assessed by Rosenhek et al.7
In contrast to previous studies,3,5–7we found that female
sex was independently predictive of the midterm develop-ment of symptoms. This observation is in agreedevelop-ment with the results of Hachicha et al,16who found a higher prevalence of
women among patients with paradoxical flow, low-gradient AS despite normal LV function, a condition associ-ated with a significantly worse outcome compared with patients with normal flow.16In addition, Legget et al23found
that despite similar hemodynamic severity, women with AS reported more functional impairment, with a shorter exercise duration and lower anaerobic threshold. This may be due to a relatively smaller LV cavity and increased relative wall thickness that could be associated with higher filling pres-sures and a lower increase in cardiac output during exercise.23
Moreover, an interaction between sex and serum BNP values has also been suggested by some other reports.24,25
Previous studies have demonstrated the relationship be-tween BNP serum levels and the hemodynamic severity of AS,11the presence of symptoms,10,11or clinical outcome.8,11
To our knowledge, this is the first prospective study
demon-strating the incremental prognostic value of BNP level over peak aortic-jet velocity in a relatively large cohort of patients with asymptomatic AS.
Rationale for Utilizing a Risk Score
The risk score developed in the present study is based largely on the combination of 2 quantitative variables reflecting hemodynamic severity at baseline at both the aortic valve and ventricular levels. Intentionally, we sought to assess all potential predictors available at baseline to predict midterm outcome. The rationale for this is that some patients may become symptomatic before the first follow-up visit; thus, follow-up parameters would not be appropriate in this case. In contrast to every single measurement that cannot predict the development of symptoms, this score might better reflect the complex interplay between the LV and the aortic valve.13
Furthermore, the good reproducibility and independent prog-nostic value of both variables have been demonstrated previ-ously.3,8,10,11,26 Of note, all 5 preoperative deaths from the
validation cohort were due to cardiac causes, presumably related to AS (sudden death or heart failure). More impor-tantly, the score values of these 5 patients were all in the third and fourth score quartiles (n⫽2 and 3, respectively). This result supports the fact that earlier surgery in these high-risk patients might have prevented some of these deaths. The rationale for utilizing this score rather than logistic models relies on its robustness for predicting clinical outcome and its simplicity. For research purposes as well as for the clinician, this score is easier to use than the sophisticated logistic models on which it was built. Further validation on large cohorts of patients will only require computing their baseline characteristics including sex, peak aortic velocity, and serum
Risk Score value Observed 24-month event rates (%)
0 10 20 30 40 50 60 70 80 90 100 7 9 11 13 15 17 19 21 23
Figure 3. Observed event rate at 24 months in the combined
cohort (n⫽211 patients) according to continuous risk score values.
Table 3. Characteristics and Outcomes in the 5 Patients Who Died Before Surgery in the Validation Cohort Sex Age, y Peak Velocity, m/s Serum BNP, pg/mL Score Value Follow-Up
Duration, mo Cause of Death
Male 84 3.4 521 16.1 9 Heart failure
Male 77 4.0 123 15.2 6 Pulmonary edema
Male 78 4.3 229 16.8 8 Heart failure
Female 68 5.6 71 19.1 13 Sudden death
Female 49 4.8 116 18.3 19 Sudden death
Event-free survival (%)
Analysis time (months)
Quartile 1 Quartile 3 Quartile 2 Quartile 4 0 25 50 75 100 0 5 10 15 20 25 28 15 19 21 12 18 10 14 18 8 25 12 6 15 5 4 10 13 16 6 11 3 9 8 5 2
Figure 2. Kaplan–Meier analysis of symptom-free survival
according to the score quartiles in the validation cohort. The quartiles values of the development cohort were taken for this analysis.
BNP to assess the corresponding score values against out-come. In addition, if this validation is achieved, such a score could be easily implemented as a risk calculator for bedside use to stratify risk in individual patients.
Limitations of the Study
A limitation of this study might be the relatively small number of patients included in the development cohort compared with previous prospective studies on asymptomatic AS.6,7 In addition, the average follow-up duration in the
validation cohort was 21 months, which is slightly shorter than the 24-month follow-up duration on which the score was initially developed. However, given that 90% of the outcomes occurred before 20 months in both cohorts, we think that they are comparable. Furthermore, our results demonstrate the excellent discrimination and calibration of this score to predict midterm outcome, both in the development cohort and in an independent validation cohort. Another limitation might be the inclusion of patients with moderate AS in the devel-opment cohort. Of note, most of the patients in this cohort (72%) had severe AS. Furthermore, the inclusion of patients with moderate AS is clinically relevant, given the potential for rapid disease progression and excess mortality in these patients.5
Conclusions
Although further validation is needed to fit with different healthcare systems or other techniques of measurement of BNP, this score may already be useful in its present form to stratify risk in patient cohorts before randomization in a prospective study. Finally, if further validation is achieved, this score may be useful to predict outcome in individual patients with asymptomatic AS to select those who might benefit from early surgery.
Sources of Funding
This study was supported in part by the French Society of Cardiology.
Disclosures
None.
References
1. Bonow RO, Carabello BA, Kanu C, de Leon AC Jr, Faxon DP, Freed MD, Gaasch WH, Lytle BW, Nishimura RA, O’Gara PT, O’Rourke RA, Otto CM, Shah PM, Shanewise JS, Smith SC Jr, Jacobs AK, Adams CD, Anderson JL, Antman EM, Fuster V, Halperin JL, Hiratzka LF, Hunt SA, Nishimura R, Page RL, Riegel B. ACC/AHA 2006 guidelines for the management of patients with valvular heart disease: a report of the American College of Cardiology/American Heart Association Task Force on Practice Guidelines. Circulation. 2006;114:e84 – e231.
2. Vahanian A, Baumgartner H, Bax J, Butchart E, Dion R, Filippatos G, Flachskampf F, Hall R, Iung B, Kasprzak J, Nataf P, Tornos P, Torracca L, Wenink A, Priori SG, Blanc JJ, Budaj A, Camm J, Dean V, Deckers J, Dickstein K, Lekakis J, McGregor K, Metra M, Morais J, Osterspey A, Tamargo J, Zamorano JL, Angelini A, Antunes M, Fernandez MA, Gohlke-Baerwolf C, Habib G, McMurray J, Otto C, Pierard L, Pomar JL, Prendergast B, Rosenhek R, Uva MS. Guidelines on the management of valvular heart disease: the Task Force on the Management of Valvular Heart Disease of the European Society of Cardiology. Eur Heart J. 2007;28:230 –268.
3. Pellikka PA, Sarano ME, Nishimura RA, Malouf JF, Bailey KR, Scott CG, Barnes ME, Tajik AJ. Outcome of 622 adults with asymptomatic, hemodynamically significant aortic stenosis during prolonged follow-up.
Circulation. 2005;111:3290 –3295.
4. Lund O, Erlandsen M, Dorup I, Emmertsen K, Flo C, Jensen FT. Predictable changes in left ventricular mass and function during ten years after valve replacement for aortic stenosis. J Heart Valve Dis. 2004;13:357–368. 5. Rosenhek R, Klaar U, Schemper M, Scholten C, Heger M, Gabriel H,
Binder T, Maurer G, Baumgartner H. Mild and moderate aortic stenosis. Natural history and risk stratification by echocardiography. Eur Heart J. 2004;25:199 –205.
6. Otto CM, Burwash IG, Legget ME, Munt BI, Fujioka M, Healy NL, Kraft CD, Miyake-Hull CY, Schwaegler RG. Prospective study of asymptom-atic valvular aortic stenosis: clinical, echocardiographic, and exercise predictors of outcome. Circulation. 1997;95:2262–2270.
7. Rosenhek R, Binder T, Porenta G, Lang I, Christ G, Schemper M, Maurer G, Baumgartner H. Predictors of outcome in severe, asymptomatic aortic stenosis. N Engl J Med. 2000;343:611– 617.
8. Bergler-Klein J, Klaar U, Heger M, Rosenhek R, Mundigler G, Gabriel H, Binder T, Pacher R, Maurer G, Baumgartner H. Natriuretic peptides predict symptom-free survival and postoperative outcome in severe aortic stenosis. Circulation. 2004;109:2302–2308.
9. Gerber IL, Legget ME, West TM, Richards AM, Stewart RA. Usefulness of serial measurement of N-terminal pro-brain natriuretic peptide plasma levels in asymptomatic patients with aortic stenosis to predict symptom-atic deterioration. Am J Cardiol. 2005;95:898 –901.
10. Gerber IL, Stewart RA, Legget ME, West TM, French RL, Sutton TM, Yandle TG, French JK, Richards AM, White HD. Increased plasma natri-uretic peptide levels reflect symptom onset in aortic stenosis. Circulation. 2003;107:1884 –1890.
11. Lim P, Monin JL, Monchi M, Garot J, Pasquet A, Hittinger L, Vanover-schelde JL, Carayon A, Gueret P. Predictors of outcome in patients with severe aortic stenosis and normal left ventricular function: role of B-type natriuretic peptide. Eur Heart J. 2004;25:2048 –2053.
12. Weber M, Arnold R, Rau M, Elsaesser A, Brandt R, Mitrovic V, Hamm C. Relation of N-terminal pro B-type natriuretic peptide to progression of aortic valve disease. Eur Heart J. 2005;26:1023–1030.
13. Otto CM. Valvular aortic stenosis: disease severity and timing of inter-vention. J Am Coll Cardiol. 2006;47:2141–2151.
14. Skjaerpe T, Hegrenaes L, Hatle L. Noninvasive estimation of valve area in patients with aortic stenosis by Doppler ultrasound and two-dimensional echocardiography. Circulation. 1985;72:810 – 818. 15. Iung B, Gohlke-Bärwolf C, Tornos P, Tribouilloy C, Hall R, Butchart E,
Vahanian A. Recommendations on the management of the asymptomatic patient with valvular heart disease. Eur Heart J. 2002;23:1253–1262. 16. Hachicha Z, Dumesnil JG, Bogaty P, Pibarot P. Paradoxical low-flow,
low-gradient severe aortic stenosis despite preserved ejection fraction is associated with higher afterload and reduced survival. Circulation. 2007; 115:2856 –2864.
17. Lemeshow S, Teres D, Avrunin JS, Gage RW. Refining intensive care unit outcome prediction by using changing probabilities of mortality. Crit
Care Med. 1988;16:470 – 477.
18. Lemeshow S, Teres D, Klar J, Avrunin JS, Gehlbach SH, Rapoport J. Mortality probability models (MPM II) based on an international cohort of intensive care unit patients. JAMA. 1993;270:2478 –2486.
Table 4. Score Performances for the Prediction of the 24-Month End Point by Logistic Regression
Area Under the ROC Curve
Hosmer-Lemeshow Goodness-of-Fit Test Development cohort
BNP 0.79 (0.70–0.88) 2⫽3.35, P⫽0.35
Peak aortic-jet velocity 0.77 (0.68–0.87) 2⫽6.75, P⫽0.08
Risk score 0.90 (0.84–0.96)* 2⫽1.5, P⫽0.68
Validation cohort
BNP 0.84 (0.77–0.91) 2⫽6.05, P⫽0.11
Peak aortic-jet velocity 0.61 (0.49–0.71) 2⫽0.99, P⫽0.80
Risk score 0.89 (0.84–0.96)† 2⫽2.74, P⫽0.43
ROC indicates receiver operating characteristic. 95% confidence intervals are shown in parentheses.
*P⫽0.003 vs BNP, P⫽0.0032 vs peak aortic-jet velocity. †P⫽0.045 vs BNP, P⫽0.0001 vs peak aortic-jet velocity.
19. Lemeshow S, Teres D, Pastides H, Avrunin JS, Steingrub JS. A method for predicting survival and mortality of ICU patients using objectively derived weights. Crit Care Med. 1985;13:519 –525.
20. Hosmer D, Lemeshow S. Applied Logistic Regression, 1st ed. New York: John Wiley & Sons; 1989.
21. Hanley JA, McNeil BJ. The meaning and use of the area under a receiver operating characteristic (ROC) curve. Radiology. 1982;143: 29 –36.
22. Horstkotte D, Loogen F. The natural history of aortic valve stenosis. Eur
Heart J. 1988;9:57– 64.
23. Legget ME, Kuusisto J, Healy NL, Fujioka M, Schwaegler RG, Otto CM. Gender differences in left ventricular function at rest and with exercise in asymptomatic aortic stenosis. Am Heart J. 1996;131:94 –100. 24. Maisel AS, Clopton P, Krishnaswamy P, Nowak RM, McCord J,
Hol-lander JE, Duc P, Omland T, Storrow AB, Abraham WT, Wu AH, Steg
G, Westheim A, Knudsen CW, Perez A, Kazanegra R, Bhalla V, Herrmann HC, Aumont MC, McCullough PA. Impact of age, race, and sex on the ability of B-type natriuretic peptide to aid in the emergency diagnosis of heart failure: results from the Breathing Not Properly (BNP) multinational study. Am Heart J. 2004;147:1078 –1084.
25. Christ M, Laule-Kilian K, Hochholzer W, Klima T, Breidthardt T, Per-ruchoud AP, Mueller C. Gender-specific risk stratification with B-type natriuretic peptide levels in patients with acute dyspnea: insights from the B-type natriuretic peptide for acute shortness of breath evaluation study.
J Am Coll Cardiol. 2006;48:1808 –1812.
26. Otto C. Aortic stenosis: echocardiographic evaluation of disease severity, disease progression, and the role of echocardiography in clinical decision making. In: Otto C, ed. The Practice of Clinical Echocardiography. Phila-delphia: WB Saunders; 1997:405– 432.
CLINICAL PERSPECTIVE
The decision to operate on asymptomatic patients with severe aortic stenosis remains a source of debate. The risk of sudden death without preceding symptoms remains a matter of concern as well as the risk of irreversible myocardial damage due to severe left ventricular hypertrophy. In the present study, we developed a risk score based on the 3 independent predictors of midterm outcome (ie, sex, peak aortic-jet velocity, and serum B-type natriuretic peptide) in a population of 104 consecutive patients with mostly severe aortic stenosis who were asymptomatic at baseline and prospectively followed. This score was then validated on an independent cohort of 107 consecutive patients. According to this score, 80% of patients within the first quartile remained free from events after 20 months of follow-up. In contrast, only 7% of patients within the fourth score quartile remained free of events after 20 months. The rationale for utilizing this score rather than logistic models relies on its robustness for predicting clinical outcome and its simplicity. Although further validation is needed, this score may already be useful in its present form to stratify risk in patient cohorts before randomization in a prospective study. Finally, if further validation is achieved, this score may be useful to predict outcome in individual patients with asymptomatic aortic stenosis to select those who might benefit from early surgery.
0
.2
.4
.6
.8
1
Endpoint
1
2
3
4
5
Natural Logarithm of BNP
Supplemental Figure 1: Lowess smoother graph of the relationship between natural logarithm of BNP
and 24-month endpoint (bandwidth = .8)
SUPPLEMENTAL MATERIAL
at SWETS SUBSCRIPTION SERVICE on February 21, 2010 circ.ahajournals.org
0 .2 .4 .6 .8 1 2 3 4 5 6
Peak velocity (m/s)
Supplemental Figure 2: Lowess smoother graph of the relationship between Peak aortic-jet velocity (m/s)
and 24-month endpoint (bandwidth = .8)
at SWETS SUBSCRIPTION SERVICE on February 21, 2010 circ.ahajournals.org