Downslope-shifting pockmarks: interplay between hydrocarbon
leakage, sedimentations, currents and slope’s topography
Sutieng Ho1,5 · Patrice Imbert2 · Martin Hovland3 · Andreas Wetzel4 · Jean-Philippe Blouet5 · Daniel Carruthers6
Abstract
Pockmarks in Pliocene-Quaternary continental slope deposits offshore Angola show features related to: (1) fluid leakage craters that formed repeatedly, (2) authigenic methane-derived carbonates that indicate the (former) presence of hydrocarbons and (3) erosional–depositional structures that are clearly related to current activity. Depending on topography, the pockmarks show differing development: “Advancing Pockmarks” preferentially developed on regional slopes or inclined topography (> 2.5°–3°). They arranged in a chain-like pattern and mimic the outline of buried turbidite channels below. These pockmarks and their infill migrated downslope in response to shifting vents. “Nested Pockmarks” occur in gently sloping areas (< 2°). Their isolated conical infill records slope-parallel migration within a specific depth range pointing to the influence of contour currents. Both pockmark types are long-lived and they record preferential fluid migration along specific pathways, which developed at the downcurrent sidewalls of pockmarks due to flow separation initiating “cavity flow” within the pockmarks. The durable specific migration paths include pockmark sidewalls, vertically stacked erosional-interface of sediment waves, or entire pockmark bodies. The vertical extent of both pockmark types from End Miocene to the present-day seafloor docu-ments various intensities of episodic fluid bursts followed by periods of quiescence and fill.
Keywords Pockmark migration · Pockmark infill · Hydrocarbon leakage · Angola
Introduction
Pockmarks are topographic depressions originating from fluid (water, oil, and/or gas) expulsion at the seafloor. Their formation has been widely studied (see Judd and Hovland
2007, and references therein). Classic examples of present-day or buried pockmarks appear in vertical section often as v-shaped craters with simple draping or aggrading infill (cf. Hovland and Judd 1988; Kelley et al. 1994; Judd and Hovland 2007; Çifçi et al. 2003).
Aligned pockmarks or strings of pockmarks were discov-ered first in the Norwegian Trench by Hovland (1981). Sub-sequently, pockmarks aligned above buried channels were found, for instance in the area of the West Africa continental margin (Haskell et al. 1997; Pilcher and Argent 2007), the Niger Delta and offshore (Davies 2003; Cauquil et al. 2003; Benjamin et al. 2015), the Lower Congo Basin (Gay 2002; Gay et al. 2003), the Gulf of Guinea (Coterill et al. 2005), the Rio Muni Basin (Jobe et al. 2011), and offshore Angola (Maroga 2008; Ho et al. 2012b). The spatial coincidence of pockmark strings and turbidite channels suggests that the lat-ter acted as leaking hydrocarbon reservoirs offshore weslat-tern Sutieng Ho [email protected] Patrice Imbert [email protected] Martin Hovland [email protected] Andreas Wetzel [email protected] Daniel Carruthers [email protected] 1
Department of Geosciences, National Taiwan University, P.O. Box 13-318, 106 Taipei, Taiwan
2 Total-CSTJF, Avenue Larribau, 64000 Pau, France 3
Center for Geobiology, University of Bergen, Postboks 7803, 5020 Bergen, Norway
4 Geological Institute, University of Basel, Bernoullistrassse 32, 4056 Basel, Switzerland
5
Unit of Earth Sciences, University of Fribourg, Chemin du Musée 6, 1700 Fribourg, Switzerland
6 Companie Genéral Géophysique, Llandudno, UK
http://doc.rero.ch
Published in "International Journal of Earth Sciences 107(8): 2907–2929, 2018"
which should be cited to refer to this work.
Africa (Gay et al. 2003; Cauquil et al. 2003). Leakage sites are preferentially located along the channel margins where the mechanical resistance of the overburden is the lower (cf. Gay et al. 2003; Pilcher and Argent 2007; Jobe et al. 2011). This implies that turbidite channels underwent an increase in pore pressure and served as reservoirs for upward migrated fluid (Gay 2002; Gay et al. 2003).
Vertical stacking of buried pockmarks are caused by reac-tivation of fluid leakage (Hovland 1981; Mazzotti et al. 1987; Çifçi et al. 2003; Moss 2010). Therefore, variations of pock-mark size and morphology along a vertical succession can be used to reconstruct the evolution of fluid venting intensity through time (Ho et al. 2012a). In contrast to purely aggrada-tional pockmark succession, slant stacked, or lateral-shifted pockmarks, both buried and modern, have been recognised in a few studies (e.g. Curzi and Veggiani 1985; Dimitrov and Dontcheva 1994; Baraza and Ercilla 1996; Casas et al. 2003; Pilcher and Argent 2007; Dondurur and Çifçi 2009; Maroga
2008; Andresen and Huuse 2011; Ho et al. 2012b). Their formation mechanism, however, has not been addressed in detail yet. Besides recurrent fluid leakage, the formation of slanted stacked pockmarks must involve additional factors and processes that led to their lateral shift (Maroga 2008; Ho et al. 2012b). For example, bottom current activity has been suggested to cause polyphase filling and lateral shift of seafloor depressions (Heiniö and Davies 2009).
It is the purpose of the present paper to describe and to analyse vertical successions of shifted pockmarks lined up above channels, in particular to decipher the relationship between fluid leakage, bottom currents, infill processes, and seafloor topography. Conceptual models for these, so far undescribed shifting pockmarks, are proposed based on their geometries shown on seismic sections and two-way time (TWT) maps of selected horizons. In this study area, pockmarks of the given type are either buried or occur on the present-day seafloor. This study is based on selected buried pockmarks that developed along two palaeo-channel com-plexes. The proposed conceptual models are applicable for both ancient and modern pockmarks. Pockmark appears to be useful to reconstruct the local bottom-current direction and the depositional environment on the seafloor. In addi-tion, they provide information about hydrocarbon migration processes including timing and flux variations.
Seismic data, method and terminology
This study is based on 3D seismic data obtained in the Lower Congo basin in ~ 800–1650 m water depth. The investigated survey has a vertical resolution of 5–7 ms TWT (~ 4–6 m) in the first second of the investigated interval and a bin size of 6.25 × 6.25 m2. Its dominant frequency is 55–80 Hz. The seismic data have been processed to zero phase and
then interpreted using the in-house software of Total S.A., Sismage© (Guillon and Keskes 2004). For the seismic
images, the following colour code is utilised. Amplitudes are represented with a dual-polarity palette being white at zero. Positive amplitudes (= downward increase of acoustic impedance) are represented by a white–yellow–red trend, while negative amplitudes (= downward decrease of imped-ance) are displayed on a grey scale, with the most nega-tive amplitude in black. For a detailed structural analysis of pockmarks, individual horizons within the infill have been picked manually and examined in a 3D viewer. Well data are unavailable for the studied interval. Ages of horizons and information on lithostratigraphy are sourced from Total S.A.’s confidential internal reports (Vignau et al. 2000). The studied deposits were subdivided into intervals separated by horizons of proven or tentative age, labelled Ma and H, respectively.
For the pockmark features addressed in this study, the following terminology is applied:
Individual pockmarks are roughly conical erosional forms being nearly circular in plane view.
For simplification, the term “pockmark” is applied indistinctively for both the active or buried corresponding structures.
Upslope/downslope refers to the regional slope. For most of the study area, downslope means SW-wards and upslope NE-wards.
Upcurrent (lee)/downcurrent (stoss) refer to cases where the current direction is known. Progradation is used for downcurrent migration of sediment infill in depressions and retrogradation for upcurrent migration.
Far field refers to the area surrounding a pockmark (Ho et al. 2012a, b).
Geological context and oceanography
Regional structures, local setting and stratigraphyThe study area is located in the Lower Congo Basin, off-shore Angola, (Fig. 1a; Broucke et al. 2004). This conti-nental margin formed during the break-up of Gondwana, by opening of the South Atlantic in the Early Cretaceous (Mascle and Phillips 1972; Larson and Ladd 1973). The syn-rift sequence (Neocomian to early Aptian) is mainly composed of continental and lacustrine deposits capped by up to 1000 m thick Aptian evaporites (Marton et al. 2000). Transgression during the post-rift phase led to marine car-bonate deposits during the Aptian, and then shale-dominated deposits during the Late Cretaceous. Sedimentation rates increased abruptly from the Oligocene onwards, with signifi-cantly enlarged input of terrigenous siliciclastics (Liro and Dawson 2000; Lavier et al. 2001; Séranne and Anka 2005).
Fi
g
. 1
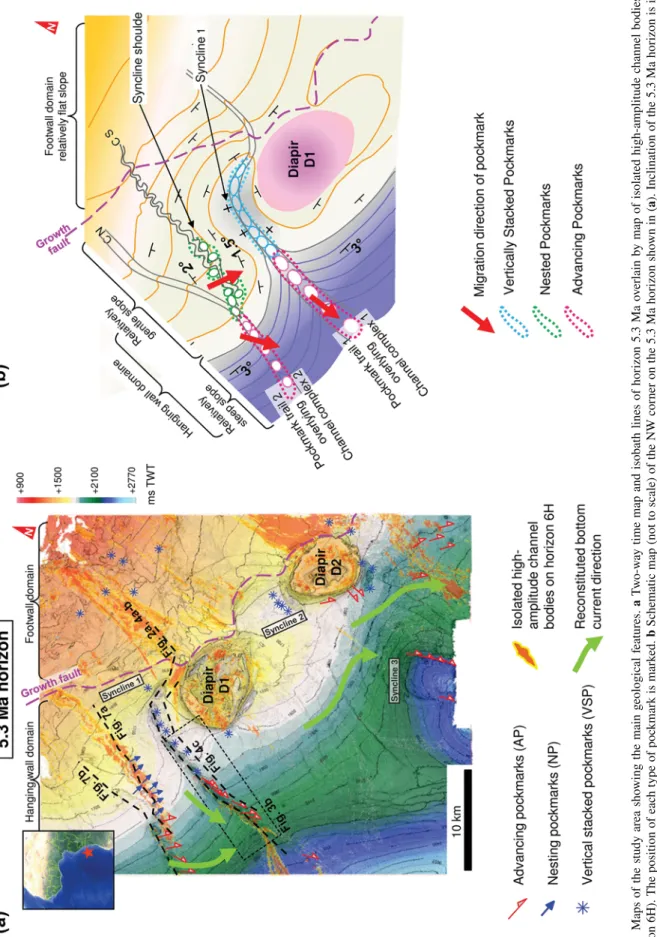
Maps of t
he s
tudy area sho
wing t he main g eological f eatures. a T w o-w ay
time map and isobat
h lines of hor izon 5.3 Ma o v er lain b y
map of isolated high-amplitude c
hannel bodies (at
hor
izon 6H). The position of eac
h type of poc kmar k is mar k ed. b Sc
hematic map (no
t to scale) of t he NW cor ner on t he 5.3 Ma hor izon sho wn in ( a ). Inclination of t he 5.3 Ma hor izon is indi-cated b y digits. T w o poc kmar
k trails occur abo
v e tw o under lying c hannel comple x
es (CC1 and CC2). Channel Comple
x 2 is composed of tw o ups tream branc hes, Channel N o rt h (CN) and Channel Sout h (CS) t hat mer g e do wns
tream. Lateral shif
t of adv ancing poc kmar ks and N es ted P o ckmar ks is indicated b y a red ar ro w . A d v ancing poc kmar ks are res tr icted to s teepl y inclined channel segments (> 3°), while nes ted poc kmar ks and v er ticall y s tac k ed poc kmar ks occur in or adjacent to g entl y sloping c hannel segments (< 1.5°–2°)
http://doc.rero.ch
Thereafter, extensive turbidite systems sourced from the ancestral Congo River started to develop in the study area (Séranne and Anka 2005). Oligocene and Miocene turbidites act as prolific oil dominated hydrocarbon reservoirs, mostly feed by upper Cretaceous source rocks (Broucke et al. 2004).
Gravitational gliding over the Aptian evaporites played a major role in the late Cretaceous-Cenozoic structuration of the basin. With respect to deformation three domains are distinguished (Broucke et al. 2004): (1) extension dominates
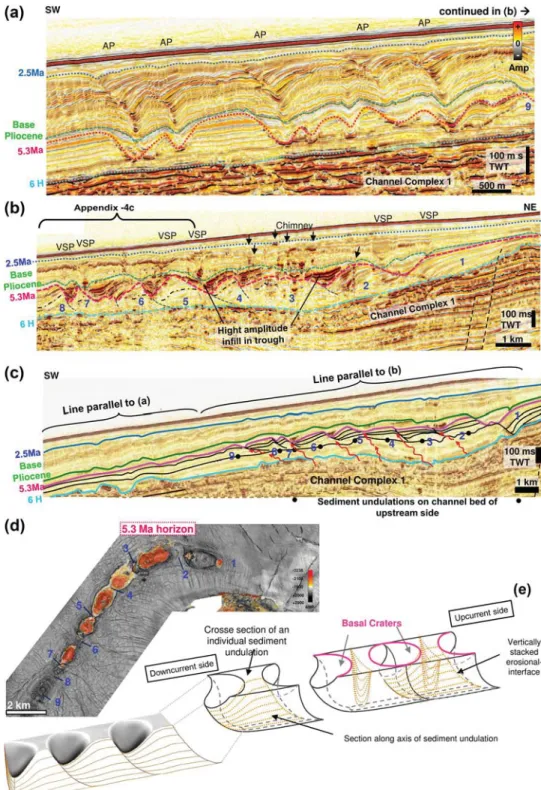
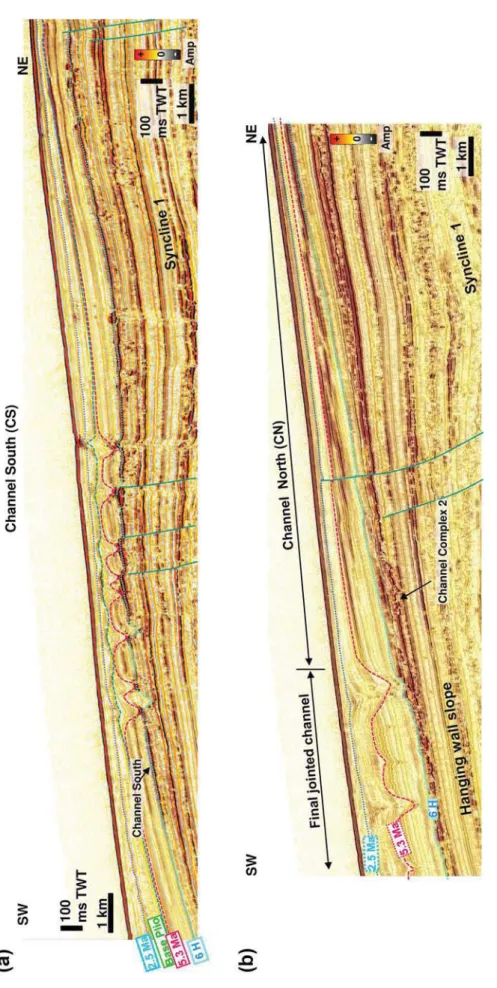
in the upslope part with listric faults and rafts detaching on the salt, (2) translation in the middle part is character-ised by salt diapirs and normal faults, and (3) compression in the distal part is expressed by folds and thrusts with salt canopy. The study area is located in the translational domain. A major growth fault or synsedimentary normal fault, striking NW–SE, parallel to the continental shelf and dipping seaward, divides the area into footwall and hanging wall domains (Fig. 1a). The hanging wall slope becomes Fig. 2 Seismic profiles showing
the main geological features of the study area and their strati-graphic location. a Section of Channel Complex 1 (see Fig. 1
for location). The major growth fault divides the study area into footwall and hanging wall domain. The part of channel that crosses the footwall domain and Syncline-1 in the hanging wall domain is called upslope part. The part of channel on the slope downward Syclince-1 toward SW is called downslope part. Vertically stacked pock-marks are located above the upslope part of the channel, whereas advancing pockmarks are located above the downslope part. b Seismic sections and interpretative drawing of the three types of studied pock-marks
significantly steeper (from 1.5° to 3°) ~ 10 km to the SW of the growth fault (Fig. 1b). Numerous normal faults struc-ture the footwall domain, while the hanging wall has rollo-ver morphology. The fault was active during the Miocene and is sealed by Pliocene deposits (Ho 2013; Fig. 2a). Two salt diapirs (D1 and D2 on Fig. 1a) affect the hanging wall topography. Salt withdrawal Syncline-1 formed adjacent to Diapir-1 in the NW, approximately since the Early Miocene (Fig. 1b); while Syncline-2 and -3 occurred next to Diapir-2. After the Miocene no major tectonic event was recorded in the study area (Philippe 2000; Ho 2013).
The Neogene to Quaternary sedimentary succession within the study area consists of well-bedded hemipelagic sediments (Broucke et al. 2004; Vignau et al. 2000). Two late-Miocene turbidite channel complexes oriented NE–SW incise Upper Miocene strata (Ho et al. 2012a). Channel Complex 1 (CC1) bends around the NW flank of Diapir-1. Channel Complex 2 (CC2) in the NW flank of Syncline-1, is composed of two sets of channels (Fig. 1b), Channel North (CN) and Channel South (CS) (Fig. 1b), both of which merge downdip on the regional (hanging wall) slope. Above the NE part of CC1 next to Diapir-1, sedimentary undulations are observed in the interval of Late Miocene. Pockmarks and other fluid venting structures occur in an interval between the Middle Miocene and the present-day seafloor within the deposits covering channel complexes (Fig. 2b, c). The studied pockmarks are located within Pliocene-Quaternary interval, which has been deformed by polygonal faults (Ho et al. 2013, 2016).
Regional currents
To decipher the potential role of bottom current activity on the formation and migration of pockmarks, the palaeo-oceanographic setting of the study area during the Miocene is reviewed.
There is little information specific to the deep-marine currents during the Miocene and Pliocene in the study area. However, the stratigraphic distribution of current induced sedimentary features suggests that the general pattern of present-day oceanic circulations established during the late Miocene (e.g. Séranne and Abeigne 1999; Berger et al.
2002; Gong et al. 2016). The modern circulation pattern is, therefore, used in first approximation as an analogue of the Neogene oceanic circulation.
The study area is located in the transition between North Atlantic Deep Water (NADW) and Antarctic Intermediate Water (AAIW) (van Bennekom and Berger 1984) in the water depth of 700–1300 m. Downslope currents of vary-ing strength have been recorded within the Congo canyon-channel system (e.g., Vangriesheim et al. 2009a, b), while high-energetic turbidity currents may occur at a rate of 66
events/100 years as estimated from cable breaks offshore Congo (Heezen et al. 1964).
Outside of the study area, upwelling occurs north and south of the Congo River mouth, at ~ 5°S and ~ 7°S, respec-tively (Lutjeharms and Meeuwis 1987). Similarly, about 200 km north of the study area, deep channels incised into Miocene slope deposits have been used as indicators of upwelling currents in 500–1500 m water depth (Séranne and Abeigne 1999). In contrast, in the study area sedimen-tary structures indicating upwelling currents have not been observed.
Results
Pockmark morphology
Several types of pockmarks have been observed in the study seismic survey. Pockmarks among the same type can be either buried or active (Figs. 2b, 11 in Appendix). They are classified according to their infill pattern and the position of their apex center (Fig. 2b):
1. “Vertically Stacked Pockmarks” (VSPs) 2. “Advancing Pockmarks” (APs)
3. “Nested Pockmarks” (NPs) 4. “Basal Craters” (BCs)
VSPs are characterised by vertically stacked, draping infill or different generations of pockmarks develop along the same vertical axis (e.g. Hovland 1981; Mazzotti et al.
1987; Çifçi et al. 2003; Moss 2010). They have already been widely investigated (see “Introduction”), therefore, their for-mation is not addressed here. APs have been only briefly investigated (Ho et al. 2012b), while NPs have never been reported in the literature. The latter two types of pockmarks are examined in detail.
Pockmark types
Advancing pockmarks (APs)
They are defined as downslope tilted stack of individual, consecutively overlapping pockmarks (Fig. 3a). APs are cir-cular in plane view (Fig. 3b; Ho et al. 2012b). The diameter of individual pockmarks varies from 300 to 600 m and their depths is < 50 ms TWT. The height of the pockmark stack is between 50 and 300 m. The horizontal shifting distance of APs ranges from 60 to 300 m (Fig. 12 in Appendix). The majority of APs occur in Pliocene hemipelagic depos-its while some of them are present on the modern seafloor, but being smaller (Fig. 11a in Appendix). Most of APs are arranged parallel to underlying turbidite channels (Fig. 1b;
see also Fig. 4). To decipher their formation, analysing the cross-sectional characteristics is essential.
1. In a generally aggrading setting, AP’s infills exhibit pro-nounced asymmetry in longitudinal section recording a downslope shift. The pockmarks and their far fields are drapped with several generations of isopach sediment layers except a specific area on the downcurrent side-wall. The infill on the upcurrent sidewall of pockmarks is in continuity with the upcurrent far field (Fig. 3a). In contrast, on the downcurrent sidewall, infill reflec-tions are discontinuous and appear truncated within the
lower to the middle upper part of the pockmark sidewall. The interruption is often crescent-shaped in map view (Fig. 3c; in 3D view Fig. 3d).
2. Occasionally, reflections on the upcurrent sidewall thicken towards the pockmark centre and may continue on the downcurrent sidewall only for a short distance and then taper out (e.g. h2, h5 in Fig. 3a).
3. Different generations of pockmark craters have been observed (cƍ in Fig. 3a). They appear as recurrent down-ward convex truncations cutting previous depressions and their infills at the downcurrent sidewalls. The trun-cating craters are called rejuvenated craters in this study. Fig. 3 Detailed characteristics
of advancing pockmarks (APs). a Longitudinal section (paral-lel to the direction of greatest slope) of an AP [see (b) for location]. Large basal crater labelled BC; rejuvenated craters labelled cƍ. b TWT map and superimposed dip map showing trail of basal craters below APs. c TWT map and superimposed dip map of selected horizons h1–h6 within the AP shown in (a). Oval areas indicate the far field sediment around pock-mark. A crescent-shaped trunca-tion is visible on each horizon. d Infill layer of AP (horizons h2, h3, h4) in 3D-view showing truncation at downcurrent stoss sidewalls in 3D view
4. Towards the top of APs, the depth of the depressions decreases, until the depression is filled and conformably overlain by Quaternary sediments. The detailed archi-tecture of APs is shown in Fig. 13 in Appendix.
Nested pockmarks (NPs)
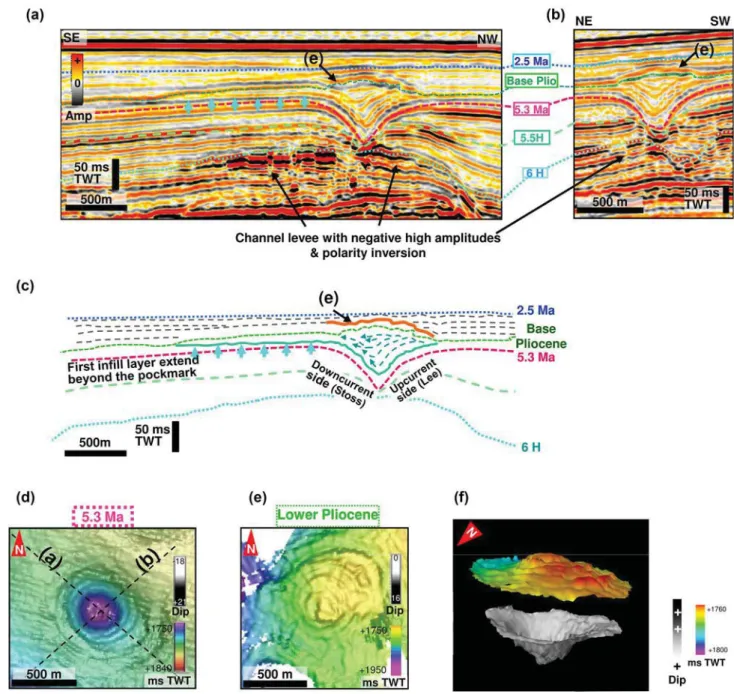
Nested Pockmarks are characterised by vertically stacked, conical infill layers that do not extend into the far field (Fig. 5a, b), except the first layer (Figs. 5a, 7b). Each coni-cal infill layer is constrained by that underneath, as the TWT maps at the top of the infill show a concentric pattern Fig. 4 Pockmark Trail 1 above
Channel Complex 1 (CC1); see Fig. 2a for full profile. a AP trail at downslope side of CC1. b VSPs above sediment undulations (blue numbers) at upslope side of CC1. Major growth faults are located NE of this profile. Black arrows indi-cate negative high-amplitude, bright spot chimneys. c Seismic section parallel to median axis of channel complex intersect-ing edge of Pockmark Trail 1 showing sediment undula-tions (blue numbers) above upslope side of CC1; black dots indicate their base. Red arrows mark potential fluid migra-tion pathways. d Locamigra-tion of sediment undulations and basal pockmarks on amplitude map of horizon 5.3 Ma. Blue numbers refer to pockmarks shown in (b) and (c). e Schematic 3D drawing of the internal structure of sediment undulations based on 360° observation in seismic data. Gas might have used vertically stacked erosional interfaces between undulations for migration to initiate crater development
(Fig. 5c, d). Thus, the structure of NPs resembles a slightly tilted set of nested bowls.
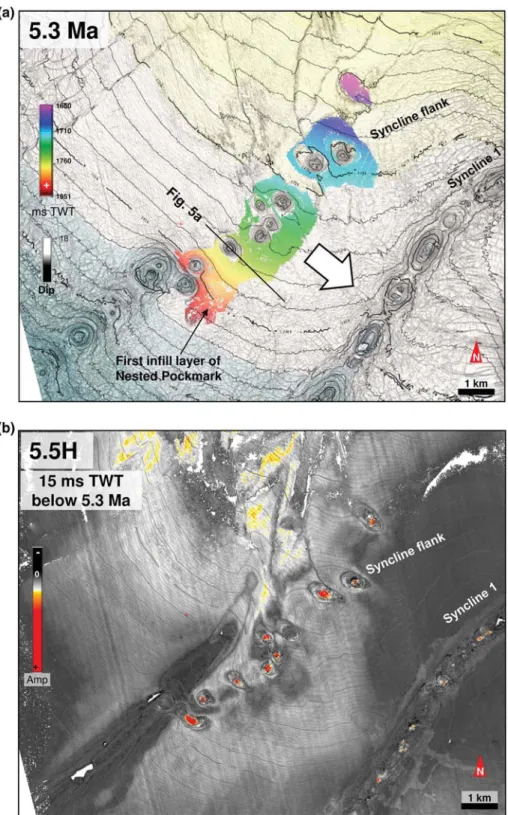
Reflections inside the initial NP craters onlap onto the downcurrent sidewalls while on the upcurrent side they terminate at the margin (Fig. 5a). The infill layers of NPs show a slight migration of successive deepest centres of 40–160 m, with a migration direction toward the syncline slope, but parallel to the isobaths. NPs show only one single
generation of erosional crater. Craters at the base of NPs are rather elliptic and their long axis is parallel to the isobaths (Fig. 6a). The asymmetric infills of NPs are systematically aligned with the long axis of the initial craters (Fig. 6b). The crater diameter ranges from > 300 to 600 m, while depth varies from 90 to 150 ms TWT. Sediment accumulated on the gently inclined (5°–10°) lee side, while less deposition occurred on the steeper side (10°–15°) stoss side.
Fig. 5 Nested pockmarks (NPs). a, b section across (a) and along (b) pockmark axis. c Seismic interpretation of (a), for geological inter-pretation see insert in Fig. 9. d TWT map of Basel Crater at 5.3 Ma. e TWT map and superimposed dip map of NPs infill top showing
annu-lated structure and radial alignment of convex positive high-ampli-tude reflections. f 3D-view of NP crater (dip map) and its overlying annulated structure (TWT map)
The top of NPs is marked by a dome-like high-positive reflection (Fig. 5a, b). In some cases, it appears to crosscut background horizons and shows a radial pattern (Fig. 5e, f). The overlying strata onlap onto these domes. Most of NPs are buried, but some NPs exhibit a dome partly outcropping on the modern seafloor (Fig. 11b in Appendix). Like the majority of APs, NPs are aligned along the channel complex underneath (Fig. 7).
Basal craters (BCs)
These features represent the earliest pockmarks in horizon 5.3 Ma below the VSPs and APs (see highlighted depres-sions on Fig. 4a–c). Their diameter ranges from 300 to > 1000 m and their internal depth from 50 to 100 ms TWT. They are often larger than the depressions in the subsequent Fig. 6 Elongate shape of Nested
Pockmark (NP) craters having longest axis parallel to isobaths of Syncline-1 flank. a Super-imposition of TWT and dip map of horizon 5.3 Ma with basal infill of NPs extending on Syncline-1 flank (for strati-graphic position see b). Infill is preferentially oriented towards Syncline-1. The white arrow indicates the migration direction of the successive deepest cen-tres of NP infills. b Amplitude horizon 5.5 H with bathymetric contours intersecting the base of NPs shows elongate geometry of their primary craters
Fi g . 7 P o ckmar k T rail 2 abo v e Channel Comple x 2 (CC2) composed of N es ted P o ckmar ks (NPs) in t
he upslope side and A
d v ancing P o ckmar ks ( APs) in t he do
wnslope side. Channel Comple
x 2 f o rms while Channel N o rt
h (CN) and Channel Sout
h (CS) join. a NPs occur abo v e CS abo v e tectonic f aults wit hin Anticline 1. b
APs occur abo
v
e CN
stack. Some of the BC are (sub)circular, while others merge into elongate features (Fig. 4d).
BCs occur along the different part of channels. In the upslope side of CC1 (Fig. 4b, c) they particularly develop above the vertically stacked, erosional-interface of sedi-ment undulations (Fig. 4e), and truncate the top surface of undulations (Fig. 4b, c). The stepwise aggrading struc-tures of the undulations are particularly well-observed in sections parallel to the central axis of the pockmark trail (Fig. 4b, c). The high-amplitude infills of BCs show irregular thickness. They are parallel and onlap against the sidewalls of the undulations, but occasionally they are discontinuous (Fig. 4b–d).
Pockmark distribution
The distribution of the different types of pockmarks in the study area is strongly related to the geological structures underneath, the regional slope, and the local relief. These parameters were evaluated for the 5.3 Ma time horizon, where pockmarks initiated. Since the study area was not affected by active salt diapirism after the end of Miocene (Philippe 2000; Ho 2013), the topographic measurements presented below are rather reliable.
APs and NPs exhibit a lateral shift of infill and occur on an inclined relief (Fig. 1a). APs are located on relative steep slopes: (1) on the hanging wall slope dipping at c.a. 3°, (2) on the slope in the SE corner of the study area dipping at c. 2.5°, (3) above concentric extensional faults of Syncline-3
(Fig. 1a), and (4) along the inclined part of WSW flank of Diapir-2. NPs are located on the flanks of Syncline-1 dip-ping at c. 2°. Pockmark without shifting infill like VSP occur only in nearly horizontal areas dipping < 1.5°, above the cen-tre of Syncline-1 and its SW rim (Figs. 1a, 2a).
These three types of pockmarks are aligning along the courses of buried CC1 and CC2 and form two pockmark trails. Pockmark Trail 1 is composed upslope of VSPs and downslope of APs (Fig. 4a, b), and is located above the BC trail. Pockmark Trail 2 exhibits a sinuous course (Fig. 1). NPs are present only in the upslope part of Channel South (CS) in the hanging wall domain (Fig. 7a) while no pock-mark occur along Channel North (CN; Fig. 7b). In the downslope side of CC2, APs were also observed (Fig. 7b).
Association with other gas-related seismic structures
Several indications of fluid leakage other than pockmarks are observed along the turbidite channel complexes in the subsurface: Negative high-amplitude anomalies (NHAAs) and polarity reversals (Coffeen 1986; Sheriff 1978), bottom simulating reflections (BSR; Coffeen 1986) and seismic chimneys (Hustoft et al. 2007).
NHAAs occur especially along the crest of the levee of CC-2, underneath the NP trail, from where chimneys ema-nated upward (Fig. 14a in Appendix). At the downslope tip of Pockmarks Trail 1, local phase reversals of seismic reflec-tions are present at the top of underlying CC-1 and c. 300 ms
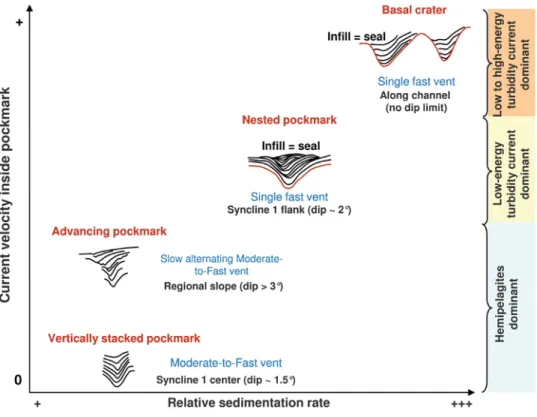
Fig. 8 Conceptual diagram showing interpretation of cur-rent velocity versus relative sedimentation rates inside pockmarks based on seismic facies analysis by Sangree et al. (1978) modified from Ho (2013). The pure aggradational infill within VPs indicates hemi-pelagic sedimentation under tranquil conditions (Sangree et al. 1978). The infill of APs is formed in the same setting, but repeatedly reworked by bottom current producing the lateral shifts. NPs are characterised by sigmoidal progradation affected by low-energy turbidite currents (Sangree et al. 1978), whereas BCs show onlapping infills with thickness variations and occasionally discontinuous infills; as deposited by low- and high-energy turbidite current (Sangree et al. 1978)
above, at the base of the Pliocene (Fig. 14b in Appendix). Along Pockmark Trail 1, chimneys emanate from the under-lying channel complex or from the high-amplitude infill of BCs, which is capped by a BSR (Fig. 14c in Appendix).1 The chimneys often terminate in positive high-amplitude anomalies located within shallow depressions (< 5 ms TWT) (Ho et al. 2012a, b).
Interpretation and discussion
Evidence of hydrocarbons leakage from the channelsPhase reversals at the surface of CC1 and the levees of CC2 indicate gas accumulations in turbidite channel deposits (Fig. 14b in Appendix). The alignment of phase reversals with overlying NHAAS at the base of Pliocene interval, in which pockmarks occur, indicate that gas migrated from the buried channels into the (pockmarked) Pliocene interval. Similarly, “high-amplitude bright spot” chimneys are present along both channel complexes. They terminate upward in positive high-amplitude patches that are interpreted as gas-escape conduits terminating in methane-derived authigenic carbonates (MDAC) or gas hydrates (Fig. 14a, c in Appendix; Hustoft et al. 2007; Petersen et al. 2010). The latter also indicate upward gas migration as demonstrated by the modern counterparts in the offshore Congo Basin (e.g., Gay et al. 2006; Sahling et al. 2008; Cauquil and Adamy 2008; Feng et al. 2010; Thomas et al. 2011). The restriction of BSRs to the cover sediments along the upslope part of CC1 (Fig. 4b), sug-gests that methane was supplied from the channel deposits below in the recent past (at least a few 100 years; cf. Sul-tan et al. 2004).
Gas migration through the channel deposits is particu-larly supported by the occurrence of BCs that coincide with troughs of sediment undulations (Fig. 4c) and their high-amplitude infill reflections beneath the BSRs (Fig. 14c in Appendix). They are interpreted as gas-bearing infills capped by a gas hydrate layer (cf. Coffeen 1986; Sheriff
1978). The gas-bearing BCs occur above the tip of erosional-interface of undulations in direct connection to the underly-ing channel deposits, suggestunderly-ing that gas in the underlyunderly-ing channel used the erosional-interface of sediment undulations for migration (Fig. 15 in Appendix; Ho 2013). This could result from a local increase in permeability along the eroded side where coarser and reworked sediments accumulate (Jopling 1965), or from preferential seal breaching where the thickness of undulations is thinnest.
Pockmark infills as indicator of bottom currents directions
Pockmarks on the seafloor act as local sediment traps, there-fore, the various geometries of their infills provide infor-mation about the sediment transport that in turn reflects direction of currents (Sangree et al. 1978; Mitchum et al.
1977; Sangree and Widmier 1978; Cattaneo et al. 2004). The infill characters of different pockmarks are compared and the interpretation is shown in Fig. 8.
The seismic reflection in the interval containing APs and VSPs is parallel and thus indicates a low-energy environ-ment facilitating accumulation of hemipelagic particles. The reflections continue from the far field into the pockmarks. However, the infill of APs is asymmetric and shifted sys-tematically downslope, and hence, implies another factor that affected the geometry of pockmark infills. The critical difference between APs and VSPs is their location, where VSPs developed on quasi-horizontal area (ca. 1.5°), while APs occur uniquely on slopes (ca. 3°). In addition, even NPs display that their infills shifted toward the syncline slope along the syncline flank (ca. 2.5°). All these observations indicate that slope inclination influenced the sediment depo-sition within pockmarks.
In contrast, the relatively thick infills of NPs and BCs show laterally varying stratal pattern and pinching out at the crater sidewalls (Fig. 2b) and thus, may indicate accel-erated bottom currents or mass flows in the pockmark locations which increased deposition rates of infill (Fig. 8; Mitchum et al. 1977; Cattaneo et al. 2004). The differences in sediment accumulation rates at different pockmark side-walls suggest that the depositional processes occurred in a regime modulated by currents on the seafloor and affected by topography.
Several types of sedimentary features document the role of gravity currents, besides the presence of channel com-plexes. Sediment undulations are restricted to the thalweg of CC1. They are characterised by low-angle (6°–20°) erosional interfaces separating the undulations (Fig. 4e). Their 3-D geometry (Fig. 4e) makes it clear that they are more akin to sediment waves (Migeon et al. 2001; Cattaneo et al. 2004) than fault-bound tilted blocks (Imbert and Ho 2012). Sedi-ment waves are common features in turbidite channels (e.g. Nakajima et al. 1998; Migeon et al. 2001; Normark et al.
2002). The dipping direction of the sediment waves indi-cates downward flow (c.f. Migeon et al. 2001; Cattaneo et al.
2004). The sediment wave strata exhibit consistently ero-sion at the stoss side implying repeated current reworking. Further up, the high-reflective, flank-onlapping infill within BCs suggests deposition by (high-energy) turbidity currents (c.f. Mitchum et al. 1977). Similary, APs with thick infill deposited occasionally around the lower upslope sidewall are interpreted as fined-grained turbidites (e.g. nepheloid layer
deposits). They also suggest activity of downslope bottom current flowing along the thalweg of CC1.
The elliptical craters of NPs have their long axis parallel to the isobaths rather than to the regional slope (Fig. 6a), indicating that NPs were modified by contour currents that flowed along the flank of Syncline-1 (e.g. Hovland 1984; Josenhans et al. 1978; Bøe et al. 1998; Manley et al. 2004). This interpretation is supported by (1) the infill of NPs that
shows a slight shift and is tilted towards the SE, while both shift and tilt are parallel to the isobaths of the syncline flanks (Fig. 6b), and (2) the first infill layer of NP that extends on the Syncline-1’s flank toward the same NW–SE direction (Fig. 6b). This asymmetry of shape and fill as well as migra-tion towards the SE point to the influence of contour currents that flowed in the same direction when NPs were forming. Fig. 9 Model for development
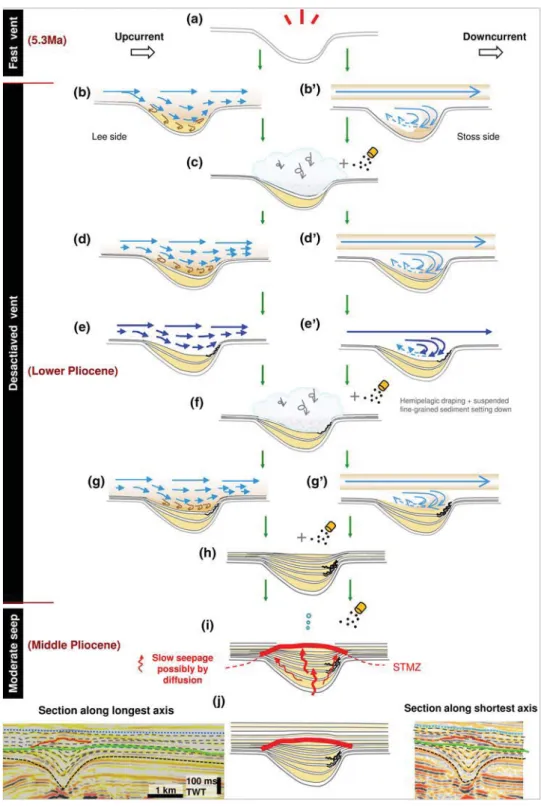
of Nested Pockmarks (NPs). Blue arrows indicate currents. Brown arrows within pockmark indicate sediment deposition. After formation of the initial crater (a), sediment is depos-ited by secondary branch of bottom current (cavity flow) separated from main branch. Two flow patterns are possible (1) depression-parallel laminar streaming (b) and (2) turbulent vortex flow with backflow (bƍ). c During periods of reduced bottom current strength, fine-grained sediment may settle. d, dƍ represent repetition of stage (b) and (bƍ), forming a new layer. e, eƍ during periods of increased bottom current activ-ity, laminar flow (e) or vortices (eƍ) may sort or even rework sediment at the upcurrent stoss side as evidenced by truncation of reflections (see Fig. 6a). f Same stage as (c), decreasing bottom current strength. g, gƍ pockmark continuing to fill up to local base level. h NP is formed. i Pockmark becoming sealed by hemipelagic deposits, methane-derived authigenic car-bonates with convex structure may crosscut top of infill and coeval hemipelagites (for detail see text). j Present-day stage. The final stage of conceptual model matches the two inserts of seismic profiles with geologi-cal interpretation (compare with observations in Fig. 5)
The current direction NW–SE is the same as today observed offshore Angola in 1000–2000 m water depth.
Pockmark formation and fill processes
To decipher how asymmetric pockmark infills are produced, the flow pattern and behaviour of bottom currents crossing depressions needs to be analysed. In the domain of fluid mechanic, it is well-documented that water currents undergo flow separation at the rim of depressions such as pockmarks and split into two branches of currents, (1) an upper main branch with high flow velocity that continues its original direction, and (2) a secondary branch with lower velocity that sinks into the depression (Taneda 1979; Sinha et al.
1982; Brothers et al. 2011). Circulation of the secondary current within depressions is well-studied in various sci-entific disciplines, such as aircraft, civil engineering, and hydraulics where it is known as ‘(lid-driven) cavity flow’ (e.g., Greenspan 1969; Migeon et al. 2000; Henderson
2001; Manley et al. 2004; Pey et al. 2014). Depending on the aspect ratio (height/length) of the basal pockmark crater, substratum angle, and Reynolds number (given by velocity, density, and viscosity of fluid as well as bottom roughness; Allen 1984) the secondary current can generate two different cavity flow patterns; (1) streamlines parallel to pockmark topography (bed-parallel streamlines) at relative low cur-rent velocity (cf. Fang et al. 1999; Zdanski et al. 2003), or (2) vortices initiating a vertical backward circulation within the depression at relatively high current velocities (Taneda
1979; Higdon 1985; Pozrikidis 1994; Brothers et al. 2011). Previously, Ho et al. (2012b) suggested that only one type of cavity flow, i.e. vortex flow, can generate asymmetric pockmark sediment infill, but without direct evidence of the flow pattern. Since the two types of aforementioned cavity flow are indeed possible (cf. Manley et al. 2004), therefore, in the section below both bed-parallel streamlines and vor-tices scenarios are evaluated.
Nested pockmarks
The curved geometry of NP infills can result from different flow patterns of the secondary current within the pockmark. Material transported by the secondary current was appar-ently deposited on the lee side of NPs, where the slope is gentler than at the stoss side (Fig. 5a). There are two pos-sibilities for the two types of cavity flow:
Case 1 (Fig. 9; left) At a comparatively moderate bottom current flow velocity, the secondary branch of the current sinks into the crater at the upcurrent side and flows parallel to the topography (Higdon 1985; Pozrikidis 1994; Fig. 9b). The divergence of the flow at the upcurrent side of the cra-ter induces a reduction of the current velocity (principle of Bernoulli in fluid mechanic) and thus, facilitates deposition
on the upcurrent lee side of the crater (e.g. Collinson and Thomson 1988; Fig. 9b). At the downcurrent stoss side of the crater, due to convergence flow accelerates and causes thinner and occasionally truncated deposits there (Fig. 9e). When currents wane, a hemipelagic drape may form (Fig. 9c, f). Such current intensity through time is typical of contour currents (e.g. Gross and Williams 1991).
Case 2 (Fig. 9; right) At comparatively high flow veloci-ties, flow separation occurs along the downcurrent side of a depression and results in vortices (turbulent backward flow) (e.g. Allen 1984; Fig. 9bƍ, dƍ). Shear stresses induced by fric-tion between turbulent backward flow and the sidewall are higher on the stoss than on the lee side (Sinha et al. 1982; Haigermoser et al. 2007; Pey et al. 2012). The reduction in shear stress enhances deposition on the lee side, while erosion most likely affects the stoss side (cf. Allen 1984). Consequently, truncation at the stoss side can be caused by each type of cavity flow or a combination of both that may co-occur (Fig. 9e, eƍ; Manley et al. 2004). During pockmark infilling, they may alternate with time depending on current speed. However, in the absence of Pliocene oceanographic data, the flow pattern within the studied pockmarks remains speculative.
NPs are marked by high-reflectivity, dome-like features at the top of the infill that are onlapped by the sedimentary cover (Fig. 5a, b). The high-amplitude positive reflection is interpreted as methane-derived authigenic carbonates (MDAC, see above) precipitated within the sulfate–methane transition zone (SMTZ) (Fig. 9i, j; cf. Petersen et al. 2010; Plaza-Faverola et al. 2011; Ho et al. 2012a). The dome-like appearance very likely developed due to increased meth-ane flux that pushed the SMTZ towards the seabed (Paull and Ussler 2008; Hovland et al. 1987, Fig. 3). The appar-ent onlapping of reflections onto the high -amplitude dome may result from the interference between parallel sedimen-tary strata and the MDAC dome that precipitated within the strata. Within the high-reflectivity domains the radial pattern observed in plane view is interpreted as fragmenta-tion of the MDAC dome by differential compacfragmenta-tion between the aggrading pockmark infill, the lithified MDAC, and the rather soft surrounding fine-grained deposits. The concentric pattern simply results from interference of successive posi-tive and negaposi-tive reflections of conical pockmark infills and the MDAC dome.
Advancing pockmarks
APs are characterised by both polyphase crater rejuvenation and asymmetric slanted infill within each crater. The reju-venated craters occur systematically above the downcurrent (stoss) sidewalls, which are onlapped by the terminations of downward dipping slanted infill. As a result, APs migrate
downslope in the same direction as the underlying turbidite channels.
The asymmetric slanted infill is caused by disrupted infill reflections on the downcurrent pockmark sidewalls (Fig. 3a), which exhibit crescent-shaped voids in map view (Fig. 3c). These crescent areas are restricted to the downcurrent side of pockmarks and are aligned with the channel axis, sug-gesting sediment reworking or starvation caused by bottom
currents flowing downslope. Since the infill reflections ter-minate very abruptly on the crater downcurrent sidewall, the interpretation of local erosion affecting originally continu-ous, isopachous hemipelagic sediment layers is favoured.
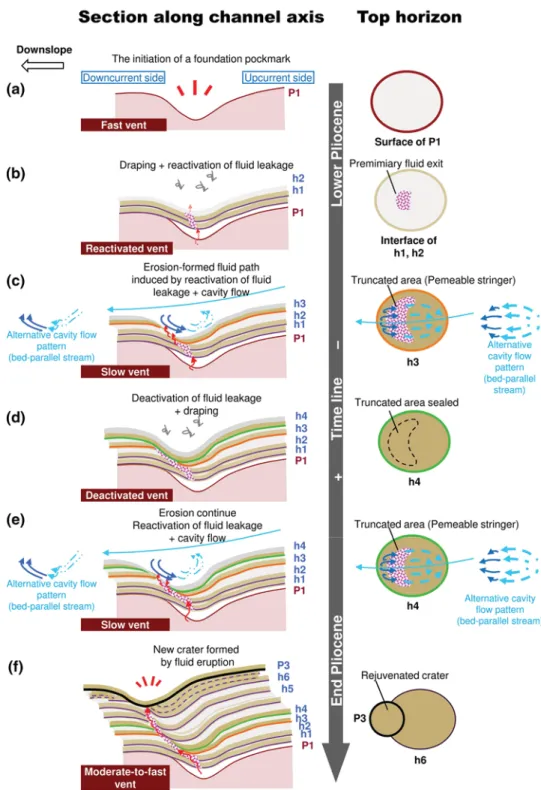
Fluid mechanic studies show that streamlines parallel to depressional topography can erode the rim of a depression on the downcurrent side above the sidewall; it is because at the downcurrent rim where the primary and secondary Fig. 10 Model for the
develop-ment of Advancing Pockmarks (APs). Blue arrows indicate currents. Pink dotted elongate area indicate vertical stack of truncational area (disrupted infill reflection) that formed permeable fluid pathway. a Formation of Basal Crater or foundation pockmark formed. b First infill above Basal Crater (P1). c Fine-grained sediment at pockmarks’ upcurrent stoss side re-suspended by cavity flow (bed-parallel stream flow or vortex flow) and seepage; crescent-shaped truncation of previous infill; during waning stage of current/seepage coarse sediment accumulates in string-ers at downcurrent side (for details see text). d Deposition of hemipelagic material during times of reduced bottom-current strength. e Rejuvenation of seepage while venting site is displaced along the coarse stringer. f Further downslope shifting by renewed venting (crater) truncating downslope flank of previous infill. The above steps repeat several times depending on the longevity of APs
currents re-attach, the secondary current is accelerated when it is pull out of the pockmark by the overflowing, high-veloc-ity primary current (Taneda 1979; Sinha et al. 1982; Higdon
1985; Pozrikidis 1994; Haigermoser et al. 2007; Pey et al.
2012). In sedimentology studies, these streamline parallel currents (except turbidity currents) are suggested to be too slow for eroding sediment inside pockmarks (e.g. Manley et al. 2004). There is an assumption that parallel stream-lines can prevent sedimentation on pockmark sidewalls (Pau et al. 2014), but the assumption is based on interpretations of analogue models that actually show high velocity currents occur at the downstream pockmark “rim” instead of on the sidewall. In fact no study has demonstrated yet that erosion/ starving occurs along the downcurrent pockmark sidewall down to the sidewall bottom as observed in Advancing Pockmarks.
It has been consistently demonstrate by fluid mechanics studies that vortices are generated by high-speed currents flowing down the downcurrent depression sidewalls, where currents undergo flow separation and where shear stress is the highest (cf. Sinha et al. 1982; Higdon 1985; Haigermoser et al. 2007; Brothers et al. 2011). Consequently, vortices are suggested to cause erosion on downcurrent pockmark side-walls as evidenced by direct pockmark observations (Manley et al. 2004; Nowell and Jumars 1984; Yager et al. 1993; Abelson and Denny 1997).
Bottom currents eroding pockmark sidewalls in combi-nation with gas seepage have been suggested by Josenhans et al. (1978), Baraza and Ercilla (1996) and Manley et al. (2004), while Maroga (2008) mentioned that downslope cur-rents interfering with gas venting disfavour sedimentation on the downcurrent pockmark sidewall and induce downslope pockmark shifting. Josenhans et al. (1978) hypothesized that when unidirectional currents affect pockmarks experi-encing fluid escape, erosion or non-deposition occurs from the venting point at the pockmark centre upward along the downcurrent side. In the case of APs, infill layers are well-preserved at the pockmark centres, and thus, the hypothesis of Josenhans et al. (1978) is not applicable in this study.
Fluid seepage occurring on pockmark sidewalls and causing local reductions of sediments has been demon-strated by the analogue and geological models (De Vries et al. 2007; Hovland et al. 2010). The sediments that were being eroded or lifted by seepages on downcurrent sidewall would then be transported away by currents (Manley et al.
2004). As a result, crescent-shaped disrupted layers form
at the downcurrent side of APs resulting from fluid expul-sion on the sidewall in combination with cavity flow(s). The occurrence of fluid migration along the downcurrent side-wall is also indicated by the formation of rejuvenated craters systematically located above the (buried) slanted stack of eroded sidewalls (Fig. 3a). Detail scenarios for AP formation are proposed in the conceptual model below.
Starting from the post formation of BC which being bur-ied, subsequent expulsions break through the seal of BC and create another crater before overlaying AP arrays formed; the AP formational steps are as follows:
1. Formation of the lowest crater of the AP array by gas expulsion from underlying channels (Fig. 10a).
2. Sedimentation. The first phase of infill occurs while hemipelagic deposits drape the depression before seep-age reactivation (h1–2 in Figs. 3a, 10b), with occasion-ally fine turbidite layers deposited on upcurrent (lee) side. Thereafter renewed less intense fluid seepage may truncate the hemipelagic drapes (pink dotted zone in Fig. 10b), either through erosion (removal of sediment, discontinuity) or reduced sedimentation (thinning of the corresponding interval below seismic resolution). The next infill phase (h3) might have occurred during times of reduced bottom water current activity and fluid seep-age (Fig. 10c).
3. Downcurrent sidewall erosion. During periods of con-siderably strong flow, bottom currents undergo flow separation when entering pockmarks. The resultant cavity flow comprises vortices or bed-parallel streams that reduce sedimentation on the downcurrent pock-mark sidewall (Fig. 10c). Episodic fluid venting on the pockmark sidewall and cavity flow may act solely or simultaneously and cause resuspension or erosion of the downcurrent sidewall. Bottom current erosion on the downcurrent sidewall leads to lowering of lithos-tatic pressure and hence, promotes fluid escape. Each erosional phase induces the crescentic truncation area observed on horizon (e.g. Fig. 3c).
4. Development of permeable stringers at downcurrent side. Erosion by either cavity flows and/or seepages, on the downcurrent sidewall removed the fine particles and left a lag of coarser grains (Fig. 10c). The coarse sedi-ment has a higher permeability and thus, can represent a later preferential fluid pathway at the pockmark down-current sidewall.
5. Downslope infill migration. Later sedimentation results in a draping on the previous conical infill, and filled the crescent-shaped area left by erosion (Fig. 10d). The draping layer is episodically eroded by seepages and bot-tom currents (Fig. 10e). The combination of repeated erosion and filling processes on the downcurrent side-wall leads to migration of pockmark infill. A fluid flow pathway is formed along the pockmark stoss sidewall by an inclined stack of crescent-erosional patterns. 6. Formation of a rejuvenated crater. A renewed phase of
enhanced fluid expulsion occurs while fluid pressure increases in the underlying sediments. Overpressured fluids migrate upward via the permeable stringer within the downcurrrent side and lead to the formation of a new pockmark crater above (Fig. 10f). The sedimentary architecture, thus, controls the site where a new erup-tional crater forms. The rejuvenated crater shifts for the distance downward given by the length and position of the permeable stringer underneath. Repetition of these processes causes downslope migration of the craters (Fig. 10f).
7. Sealing. The whole pockmark system is buried by sub-sequent sedimentation once fluid flow has ceased.
Conclusions
The architecture and lateral migration of pockmark infill reflect the interaction between fluid leakage, topography and currents. Fluid expulsion controls the initial pockmark topography, which in turn leads to perturbation of bottom-current flow pattern and affects sediment accumulation. Within pockmarks, bottom currents induce cavity flows that influences pockmark filling processes. Pockmarks with aggrading infill occur where seafloor is relatively flat, while pockmarks with migrating infill occur where sea-floor is inclined. The slope influences gravity-driven bot-tom currents and affects the related sedimentary processes. Such currents and seepages induce localized sediment reworking and sorting in particular at the downstream stoss side of pockmarks where layers enriched in coarse material can form permeable pathways. Both factors impact directly the connectivity of permeable zones in dif-ferent levels inside the pockmark system. Nucleation sites of subsequent leakage structures are thus pre-configured.
Two new types of pockmarks were found above buried channel fill deposits, “Advancing Pockmarks” (APs) and “Nested Pockmarks” (NPs).
NPs occur on relatively gentle slopes (dip > 2°, but < 3°). NPs represent a vertical stack of isolated, conical infill layers. Each generation of conical infill decreases in size upward to fit into the previous one. The deepest domain of these conical infills prograded slightly along the isobaths while contour currents were funnelled by local relief.
APs occur on steeper slope (> 3°). APs show asym-metric, inclined aggrading infill at the upcurrent side which onlaps on the downcurrent sidewall. APs record a downslope shift and recurrent rejuvenation of fluid vent-ing that is expressed by a series of craters truncatvent-ing the downcurrent margin of the underlying infill. Fluid vent-ing and concomitant cavity flow induced by currents in channels cause erosion of pockmark infill at the down-current side. Furthermore at the downdown-current side down-current activity leads to enrichment of coarse sediment having enhanced permeability that in turn favours fluid migration. The coarse sediment at the downcurrent side constitutes a subvertical, permeable string and pre-configures the loca-tion of crater rejuvenaloca-tion. The sedimentary architecture facilitates a downslope shift of renewed fluid expulsion and hence, generates pockmark systems that advance on the regional slope.
Three uncommon hydrocarbon migration pathways that determine the overall of geometrical development and internal organisation of studied pockmarks, were identi-fied; (1) vertically stacked erosional interfaces shaping sediment waves at the stoss side above that Basal Craters formed; (2) the whole NPs which act as conduits as evi-denced by the occurrence of authigenic carbonate bod-ies at their top; (3) cumulative truncations and associated coarse sediment stringers on the downcurrent sidewall of each AP rejuvenated crater.
Acknowledgements We thank Total S.A. for providing data, funding and its partner for publication permission, and the Ministry of Science and Technology of Taiwan for the Grant MOST1052914I002069A1. Our work is based on and extended from S. Ho’s PhD. The scientific work was fully carried out in Total S.A. and under its direction. S. Ho thanks Benoit Paternoster for his supervision on Geophysics. S. Ho also thanks Cardiff University and JA Cartwright for his great interest in this work and general support. Thanks also for the advices and the enormous support from Gordon Lawrence, David Hutchings, Ludvig Löwemark, and Char-Shine Liu.
Appendix
See Figs. 11, 12, 13, 14, 15.
Fig. 11 The studied pockmarks outcrop on the modern seafloor. a Advancing pockmark (AP). (i) Cross-section of an AP [see (ii) for location]. (ii) Dip map of modern seafloor shows the topmost depres-sional topography of the AP, which suggests the recent activity of the AP. b Nested pockmark (NP). (i) Cross-section showing a NP with its
top partly visible on the modern seafloor [see (ii) and (iii) for loca-tion]. (ii) Seabed dip map showing the top of NP constituting the floor of a modern pockmark and suggesting recent activities of the NP. (iii) Time horizon of 5.3 Ma superposed on its dip map showing the position of the NP’s primary crater
Fig. 12 Height versus horizon-tal distance between topmost and basal deepest centre of advancing pockmarks
Fig. 13 Detailed seismic interpretation of an advanc-ing pockmark (AP). (Top) Interpreted seismic section of an AP. Outline for middle por-tion of AP. Dotted line at stoss side represents initial volume of infill before removed by ero-sion. (Bottom) Outline of upper part and middle part of AP
Fig. 14 Fluid venting structures in association with the pockmark trails and channel complexes. a Chimneys rooting within the levees of Channel Complex 2. (i) Two chimneys (black arrows) above levee terminating in depressions on modern seafloor, [see (ii)]. (ii) ampli-tude map of present-day seafloor with 2 chimneys terminating in shal-low depressions and associated positive high-amplitude anomalies (black arrows). Positive high-amplitude anomalies are interpreted as methane-derived authigenic carbonates possibly in association with gas hydrate. b Negative high-amplitude anomalies (NHAAs; black arrows) at 5.3 Ma horizon above polarity inversion at top of Channel Complex 1. (i) Cross-section of downslope side of Channel Complex 1 showing NHAAs and polarity inversion above and at channel
sur-face (horizon 6H). (ii) NHAAs showing elongate and round shapes on horizon 5.3 Ma amplitude map (orange domains) being superim-posed with blue contours indicating location of polarity inversion below NHAAs. (iii) Polarity inversion showing elongate and round shape on amplitude horizon 6H (black domains). (c) Amplitude anomalies at upslope side of Channel Complex 1. (i) Seismic profile showing BSR that define upper boundary of NHAA infills within BCs and intersect bottom of VSPs above. Chimneys originate from channel complex or NHAA infills of BCs and penetrate BSR and VSPs above. (ii) Amplitude map of Lower Pliocene across base of VSPs (P1) and top of BCs (P0) showing planar geometry of NHAA infill inside pockmarks
References
Abelson A, Denny M (1997) Settlement of marine organisms in flow. Ann Rev Ecol Syst 28(1):317–339
Allen JRL (1984) Sedimentary structures, their character and physical basis (I + II). Elsevier, Amsterdam
Andresen KJ, Huuse M (2011) ‘Bulls-eye’ pockmarks and polygonal faulting in the Lower Congo Basin: relative timing and impli-cations for fluid expulsion during shallow burial. Mar Geol 279:111–127
Baraza J, Ercilla G (1996) Gas-charged sediments and large pockmark-like features on the Gulf of Cadiz slope (SW Spain). Mar Pet Geol 13:253–261
Benjamin U, Huuse M, Hodgetts D (2015) Canyon-confined pockmarks on the western Niger Delta slope. J Afr Earth Sc 107:15–27 Berger WH, Lange CB, Wefer G (2002) Upwelling history of the
Ben-guela–Namibia system: a synthesis of Leg 175 results. Proc Ocean Drill Progr Sci Results 175:1–103
Bøe R, Rise L, Ottesen D (1998) Elongate depressions on the south-ern slope of the Norwegian Trench (Skagerrak): morphology and evolution. Mar Geol 146:191–203
Brothers LL, Kelley JT, Belknap DF, Barnhardt WA, Andrews BD, Maynard ML (2011) More than a century of bathymetric observa-tions and present-day shallow sediment characterization in Belfast Bay, Maine, USA: implications for pockmark field longevity. Geo-Mar Lett 31:237–248
Broucke O, Temple F, Rouby D, Robin C, Calassou S, Nalpas T, Guillocheau F (2004) The role of deformation processes on the geometry of mud-dominated turbiditic systems, Oligocene and Lower–Middle Miocene of the Lower Congo basin (West African Margin). Mar Pet Geol 21:327–348
Casas D, Ercilla G, Baraza J (2003) Acoustic evidences of gas in the continental slope sediments of the Gulf of Cadiz (E Atlantic). Geo Mar Lett 23:300–310
Cattaneo A, Correggiari A, Marsset T, Thomas Y, Marsset B, Trin-cardi F (2004) Seafloor undulation pattern on the Adriatic shelf and comparison to deep-water sediment waves. Mar Geol 213:121–148
Cauquil E, Adamy J (2008) Seabed imagery and chemosynthetic com-munities: examples from deep offshore West Africa. In: 2008 Offshore Technology Conference, pp 5–8
Cauquil E, Stephane L, George R, Shyu J-P (2003) High-resolution autonomous underwater vehicle (AUV) geophysical survey of a large, deep water pockmark offshore Nigeria. In: 65th EAGE Conference and Exhibition, pp 56–59
Çifçi G, Dondurur D, Ergün M (2003) Deep and shallow structures of large pockmarks in the Turkish shelf, Eastern Black Sea. Geo Mar Lett 23:311–322
Coffeen JA (1986) Seismic exploration fundamentals. Pennwell Books, Tulsa
Collinson JD, Thomson DB (1988) Sedimentary structures. Hyman and Allen, London, p 204
Coterill K, Tari G, Valasek D, van Dyke S (2005) 3D Gulf of Guinea seismic images offer useful comparisons with offshore Morocco. World Oil 226:43
Curzi PV, Veggiani A (1985) I pockmarks nel mare Adriatico. cen-trale. Acta Nat Ateneo Parmense 21:9–90
Davies RJ (2003) Kilometer-scale fluidization structures formed during early burial of a deep-water slope channel on the Niger Delta. Geology 31:949–952
De Vries MH, Svanø G, Tjelta TI, Emdal AJ (2007) Pockmarks: created by reduced sedimentation or a sudden blow-out? In: Proceeding of the seventeenth international offshore and polar engineering conference. International Society of Offshore and Polar Engineers, Lison, pp 1361–1365
Dimitrov L, Dontcheva V (1994) Seabed pockmarks in the southern Bulgarian Black Sea zone. Bull Geol Soc Den 41:24–33 Dondurur D, Çifçi G (2009) Anomalous strong reflections on high
resolution seismic data from the Turkish Shelf of the Eastern Black Sea: possible indicators of shallow hydrogen sulphide-rich gas hydrate layers. Turk J Earth Sci 18:299–313
Fang L, Nicolaou D, Cleaver J (1999) Transient removal of a con-taminated fluid from a cavity. Int J Heat Fluid Flow 20:605–613 Feng D, Chen D, Peckmann J, Bohrmann G (2010) Authigenic car-bonates from methane seeps of the northern Congo fan: micro-bial formation mechanism. Mar Pet Geol 27:748–756
Gay A (2002) Les marqueurs géologiques de la migration et de l’expulsion des fluides sédimentaires sur le plancher des marges passives matures: exemples dans le bassin du Congo. Doctoral dissertation. University of Lille I
Gay A, Lopez M, Cochonat P, Sultan N, Cauquil E, Brigaud F (2003) Sinuous pockmark belt as indicator of a shallow buried tur-biditic channel on the lower slope of the Congo Basin, West African Margin. Geol Soc Lond Spec Publ 216:173–189 Gay A, Lopez M, Ondreas H, Charlou JL, Sermondadaz G,
Cocho-nat P (2006) Seafloor facies related to upward methane flux within a Giant Pockmark of the Lower Congo Basin. Mar Geol 226:81–95
Gong C, Wang Y, Steel RJ, Peakall J, Zhao X, Sun Q (2016) Flow processes and sedimentation in unidirectionally migrating deep-water channels: From a three-dimensional seismic perspective. Sedimentology 63:645–661
Greenspan D (1969) Numerical studies of prototype cavity flow problems. Comput J 12:88–93
Gross TF, Williams AJ (1991) Characterisation of deep-sea storms. Mar Geol 99:281–301
Guillon S, Keskes N (2004) Sismage and the 3-D visualization at total. In: American Association of Petroleum Geologists Inter-national Conference, Cancun, Mexico, pp 24–27
Haigermoser C, Vesely L, Novara M, Zuzio D, Onorato M (2007) Time-resolved PIV applied to cavity unsteady flows. AIAA Paper, 3432
Fig. 15 The 3D view of a seismic section shows basal craters (BCs) in troughs of sediment undulations located in the upslope part of Channel Complex 1. BCs expressed by green colour 3D-horizon intersecting seismic record showing some sediment undulations (labelled corresponding to Fig. 5c). The 3D drawing shows the inter-nal structure of the undulations and the interpreted gas migration pathways along the inclined stacked of erosional interfaces
Haskell N, Nissen S, Whitman D, Antrim L (1997) Structural fea-tures on the West African continental slope delineated by 3D seismic coherency. Am Asso Pet Geol Bull 81:1382
Heezen BC, Menzies RJ, Schneider ED, Ewing WM, Granelli NCL (1964) Congo submarine Canyon. Am Asso Pet Geol Bull 48:1126–1149
Heiniö P, Davies RJ (2009) Trails of depressions and sediment waves along submarine channels on the continental margin of Espirito Santo Basin, Brazil. Geol Soc Am Bull 121:698–711
Henderson J (2001) Investigation of cavity flow aerodynamics using computational fluid dynamics. Doctoral dissertation. University of Glasgow
Higdon JJ (1985) Stokes flow in arbitrary two-dimensional domains: shear flow over ridges and cavities. J Fluid Mech 159:195–226 Ho S (2013) [first submission; 2014 validated correction]. Evolution
of complex vertical successions of fluid venting systems during continental margin sedimentation. Doctoral dissertation. Cardiff University
Ho S, Cartwright JA, Imbert P (2012a) Vertical evolution of fluid vent-ing structures in relation to gas flux, in the Neogene-Quaternary of the Lower Congo Basin, Offshore Angola. Mar Geol 332:40–55 Ho S, Cartwright J, Imbert P (2012b) The formation of advancing
pockmarks arrays: an interplay between hydrocarbon leakage and slope sedimentation. American Association of Petroleum Geolo-gists Annual Convention and Exhibition, Long Beach, pp 22–25 Ho S, Carruthers TD, Imbert P, Cartwright J (2013) Spatial variations
in geometries of polygonal faults due to stress perturbations and interplay with fluid venting features. In: 75th EAGE Conference and Exhibition incorporating SPE EUROPEC 2013
Ho S, Carruthers D, Imbert P (2016) Insights into the permeability of polygonal faults from their intersection geometries with linear chimneys: a case study from the Lower Congo Basin. Carnets de Géologie 16:17
Hovland M (1981) A classification of pockmark related features in the Norwegian Trench. Continental Shelf Institute, IKU, Publication 106:28
Hovland M (1984) Gas-induced erosion features in the North Sea. Earth Surf Proc Land 9:209–228
Hovland M, Judd A (1988) Seabed pockmarks and seepages: impact on geology, biology, and the marine environment. Graham and Trotman, London
Hovland M, Talbot MR, Qvale H, Olaussen S, Aasberg L (1987) Meth-ane-related carbonate cements in pockmarks of the North Sea. J Sediment Res 57:881–892
Hovland M, Heggland R, De Vries MH, Tjelta TI (2010) Unit-pock-marks and their potential significance for predicting fluid flow. Mar Pet Geol 27:1190–1199
Hustoft S, Mienert J, Bünz S, Nouzé H (2007) High-resolution 3D-seismic data indicate focussed fluid migration pathways above polygonal fault systems of the mid-Norwegian margin. Mar Geol 245:89–106
Imbert P, Ho S (2012) Seismic-scale funnel-shaped collapse features from the Paleocene–Eocene of the North West Shelf of Australia. Mar Geol 332:198–221
Jobe ZR, Lowe DR, Uchytil SJ (2011) Two fundamentally different types of submarine canyons along the continental margin of Equa-torial Guinea. Mar Pet Geol 28:843–860
Jopling AV (1965) Hydraulic factors controlling the shape of laminae in laboratory deltas. J Sediment Res 35:777–791
Josenhans HW, King LH, Fader GB (1978) A side-scan sonar mosaic of pockmarks on the Scotian Shelf. Can J Earth Sci 15:831–840 Judd AG, Hovland M (2007) Seabed fluid flow: the impact of
geol-ogy, biology and the marine environment. Cambridge University Press, Cambridge
Kelley JT, Dickson SM, Belknap DF, Barnhardt WA, Henderson M (1994) Giant sea-bed pockmarks: evidence for gas escape from Belfast Bay. Maine Geol 22:59–62
Larson RL, Ladd JW (1973) Evidence for the opening of the South Atlantic in the Early Cretaceous. Nature 246:209–212
Lavier LL, Steckler MS, Brigaud F (2001) Climatic and tectonic con-trol on the Cenozoic evolution of the West African margin. Mar Geol 178:63–80
Liro LM, Dawson WC (2000) Reservoir systems of selected basins of the South Atlantic. In: Mello MR, Katz BJ (eds) Petroleum systems of South Atlantic margins, vol 73. American Associa-tion of Petroleum Geologists Memoir, Tulsa, pp 77–92 Lutjeharms J, Meeuwis J (1987) The extent and variability of
south-east Atlantic upwelling. S Afr J Mar Sci 5:51–62
Manley PL, Manley T, Watzin MC, Gutierrez J (2004) Lakebed pockmarks in Burlington Bay, Lake Champlain: I. Hydrody-namics and implications of origin. In: Manley TO, Manley PL, Mihuc TB (eds) Lake champlain: partnerships and research in the New Millennium. Springer, New York, pp 299–399 Maroga B (2008) Pockmarks of pliocene in the lower congo basin:
morphology and mechanism of formation. (Les pockmarks du Pliocène du Bassin du Bas-Congo: Morphologie et mécanismes de mise en place). Master thesis, Université des Pays de l’Adour
Marton G, Tari L, Lehmann GC CT (2000) Evolution of the Angolan passive margin, West Africa, with emphasis on post-salt struc-tural styles. Atlantic rifts and continental margins. Am Geophys Union 115:129–149
Mascle J, Phillips JD (1972) Magnetic smooth zones in the South Atlantic. Nature 240:80–84
Mazzotti L, Segantini S, Tramontana M, Wezel FC (1987) Clas-sification and distribution of pockmarks in the Jabuka Trough (central Adriatic). Bollettino de Oceanologia Teorica ed Appli-cata 5:237–250
Migeon C, Texier A, Pineau G (2000) Effects of lid-driven cav-ity shape on the flow establishment phase. J Fluids Struct 14:469–488
Migeon S, Savoye B, Zanella E, Mulder T, Faugères JC, Weber O (2001) Detailed seismic-reflection and sedimentary study of turbidite sediment waves on the Var Sedimentary Ridge (SE France): significance for sediment transport and deposition and for the mechanisms of sediment-wave construction. Mar Pet Geol 18:179–208
Mitchum R Jr, Vail P, Thompson III, S (1977) Seismic stratigra-phy and global changes of sea level: Part 2. The depositional sequence as a basic unit for stratigraphic analysis: Sect. 2. In: Payton CE (ed) Seismic stratigraphy: application to hydrocar-bon exploration, vol 26. American Association of Petroleum Geologists Memoir, Tulsa, pp 53–62
Moss JL (2010) The spatial and temporal distribution of pipe and pockmark formation. Doctor dissertation. Cardiff University Nakajima T, Satoh M, Okamura Y (1998) Channel-levee complexes,
terminal deep-sea fan and sediment wave fields associated with the Toyama deep-sea channel system in the Japan Sea. Mar Geol 147:25–41
Normark WR, Piper DJW, Posamentier H, Pirmez C, Migeon S (2002) Variability in form and growth of sediment waves on turbidite channel levees. Mar Geol 192:23–58
Nowell ARM, Jumars PA (1984) Flow environments of aquatic ben-thos. Ann Rev Ecol Syst 15:303–328
Pau M, Gisler G, Hammer Ø (2014) Experimental investigation of the hydrodynamics in pockmarks using particle tracking veloci-metry. Geo Mar Lett 34:11–19
Paull CK, Ussler W III (2008) Re-evaluating the significance of sea-floor accumulations of methane-derived carbonates: seepage or erosion indicators? In: Proceedings of the 6th International Con-ference on Gas Hydrates (ICGH 2008). Paper 5581
Petersen CJ, Bünz S, Hustoft S, Mienert J, Klaeschen D (2010) High-resolution P-Cable 3D seismic imaging of gas chimney structures in gas hydrated sediments of an Arctic sediment drift. Mar Pet Geol 27:1981–1994
Pey YY, Chua LP, Siauw WL (2012) The characteristics of open cav-ity flow with a length to depth ratio of 4. WIT Trans Eng Sci 74:59–70
Pey YY, Chua LP, Siauw WL (2014) Effect of trailing edge ramp on cavity flow structures and pressure drag. Int J Heat Fluid Flow 45:53–71
Philippe Y (2000) Angola central area and SW corner: tertiary regional structural synthesis. Internal report. Elf Exploration [Internal Report]
Pilcher R, Argent J (2007) Mega-pockmarks and linear pockmark trains on the West African continental margin. Mar Geol 244:15–32 Plaza-Faverola A, Bünz S, Mienert J (2011) Repeated fluid expulsion
through sub-seabed chimneys offshore Norway in response to gla-cial cycles. Earth Planet Sci Lett 305:297–308
Pozrikidis C (1994) Shear flow over a plane wall with an axisymmetric cavity or a circular orifice of finite thickness. Phys Fluids 6:68–79 Sahling H, Bohrmann G, Spiess V, Bialas J, Breitzke M, Ivanov M,
Kasten S, Krastel S, Schneider R (2008) Pockmarks in the North-ern Congo Fan area, SW Africa: Complex seafloor features shaped by fluid flow. Mar Geol 249:206–225
Sangree J, Widmier J (1978) Seismic stratigraphy and global changes of sea level, part 9: seismic interpretation of clastic depositional facies. Am Asso Petrol Geol Bull 62:752–771
Sangree JB, Waylett DC, Frazier DE, Amery GB, Fennessy WJ (1978) Recognition of continental slope facies, offshore Texas-Louisiana. In: Bouma AH, Moore GT, Coleman JM (eds) Framework, facies and oil-trapping characteristics of the upper continental margin. Studies in geology, vol 7. American Association of Petroleum Geologists, Tulsa, pp 87–116
Séranne M, Abeigne CRN (1999) Oligocene to Holocene sediment drifts and bottom currents on the slope of Gabon continental mar-gin (West Africa): consequences for sedimentation and southeast Atlantic upwelling. Sediment Geol 128:179–199
Séranne M, Anka Z (2005) South Atlantic continental margins of Africa: a comparison of the tectonic vs climate interplay on the evolution of equatorial West Africa and SW Africa margins. J Afr Earth Sc 43:283–300
Sheriff RE (1978) A first course in geophysical exploration and inter-pretation. International Human Resources Development Corpora-tion, Boston, p 313
Sinha SN, Gupta AK, Oberai M (1982) Laminar separating flow over backsteps and cavities. II-Cavities. AIAA J 20:370–375 Sultan N, Cochonat P, Foucher JP, Mienert J (2004) Effect of
gas hydrates melting on seafloor slope instability. Mar Geol 213:379–401
Taneda S (1979) Visualization of separating Stokes flows. J Phys Soc Jpn 46:1935–1942
Thomas S, Hill AJ, Clare MA, Shreeve JW, Unterseh S (2011) Under-standing engineering challenges posed by natural hydrocarbon infiltration and the development of authigenic carbonate. In: 2011 Offshore technology conference, pp 1–15
van Bennekom A, Berger G (1984) Hydrography and silica budget of the Angola Basin. Neth J Sea Res 17:149–200
Vangriesheim A, Khripounoff A, Crassous P (2009a) Turbidity events observed in situ along the Congo submarine channel. Deep Sea Res II 56:2208–2222
Vangriesheim A, Pierre C, Aminot A, Metzl N, Baurand F, Caprais J-C (2009b) The influence of Congo River discharges in the surface and deep layers of the Gulf of Guinea. Deep Sea Res II 56:2183–2196
Vignau S, Deharbe JM, Ros JB, Boutet C, Masse P, Jaffuel F, Walge-nwitz F, Gerard J, Martin R, Blake B (2000) Well study report: sedimentology—inorganic geochemistry—structural analysis— biostratigraphy. Total SA [Internal Report]
Yager PL, Nowell AR, Jumars PA (1993) Enhanced deposition to pits: a local food source for benthos. J Mar Res 51:209–236
Zdanski P, Ortega M, Fico NG Jr (2003) Numerical study of the flow over shallow cavities. Comput Fluids 32:953–974