This project is funded by the European Union under the 7th Research Framework Programme (theme SSH) Grant agreement nr 290752. The views expressed in this press release do not necessarily reflect the views of the European Commission.
Working Paper n° 70
Opportunities of the demographic dividend on
poverty reduction in Sub-Saharan Africa
Eva Medina, Sonia Chager
UAM
Enhancing Knowledge for Renewed Policies against Poverty
Subtask 9.2.1: Demographic scenarios and their impact on poverty
"Opportunities of the demographic dividend on poverty
reduction in Sub-Saharan Africa"
Research team: UAM
Eva Medina, eva.medina@uam.es Sonia Chager, sonia.chager@uam.es
1. Abstract
Demographic changes in the age structure of a population can have an impact on the economic outcome. In this sense, analysing the different periods of the demographic transition in a country can help in identifying windows of opportunity. Based on this premise, the objective of this investigation has been to build a panel data model to shed light on those elements that ought to be prioritized in the present African political agendas so as to maximize the gains from a demographic dividend (also called demographic bonus or gift) and, therefore, contribute to the poverty decline.
2. Introduction
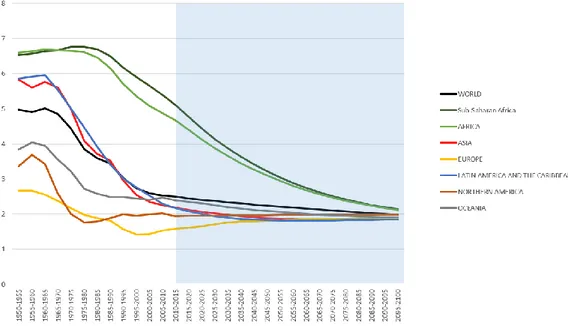
Sub-Saharan Africa still remains as an “outlier” in terms of the fertility transition, with high fertility rates that are slowly falling (Figure 1). It has been argued that the fact that the demographic transition is yet to take place has been provided as one of the reasons holding back growth in the region (Bloom et al. 1998; Bloom et al. 2003).
Figure 1: Total fertility by major geographical region, 1950-2100 (children per woman)
Source: Own calculations from the United Nations World Population Prospects (2015)
Precisely, it is within the third stage of the demographic transition that the demographic window of opportunity is revealed, as the fertility rates decline (with a previous fall in the mortality rates, especially the ones for infant mortality) and the working age population increases relative to the dependent population (the children and the elderly). Consequently, the prospects expected with this change in the population pyramid are twofold:
The so called “First Dividend” can be achieved through various pathways, including the societies’ reallocation of resources from investment in children to physical capital, job training, technological progress and stronger institutions, as well as the rise of women’s participation in the workforce (who reduce the time spent for childbearing over their life-cycle when having fewer children), and thus, a boost in savings an economic growth becomes possible (Bloom & Canning, 2011);
Moreover, a “Second Dividend” can present itself with the prolongation of the retirement period due to rising longevity, hence these economically dependent old aged individuals will require either ownership of capital/savings accumulation, family support, and/or transfers from the state (welfare system). In any case, both dividends are related to one another and, as Mason (2005) asserts, the magnitude of the second dividend depends largely on how wealth is created during the first dividend.
Therefore, as Ross (2004, p.4) bestows, Sub-Saharan Africa is just starting to enter its demographic window of opportunity – under the assumption of declining rates over the next several decades – and if these declines persist and if governments involved take pro-active
actions following to some extent those as from East-Asia (with its economic miracle), “the
dividend may become real rather than potential”.
3. Evidence and analysis
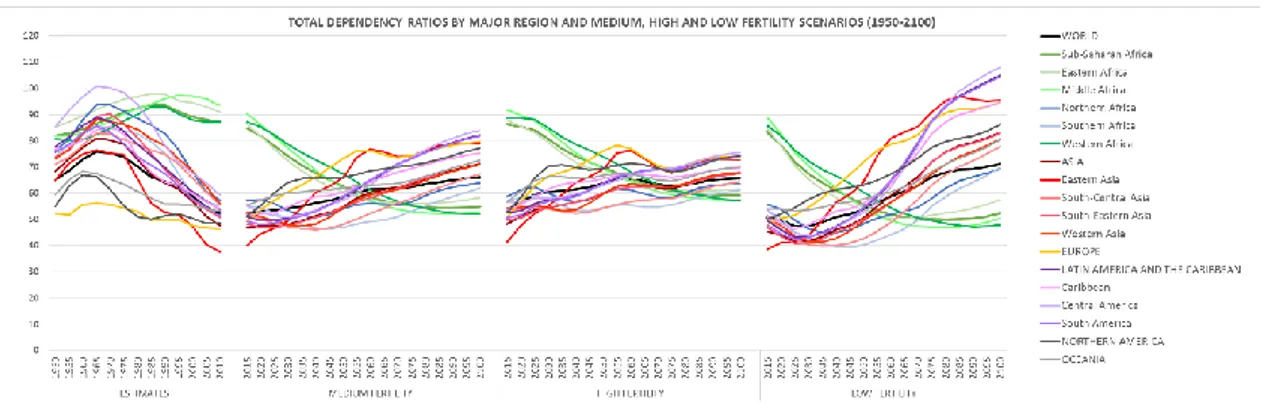
The main variable employed to illustrate the potential dependency burden that a country can face when advancing through its demographic transition (with its total magnitude and timing) has been the dependency ratio. In this regard, it is important to acknowledge the differences between Asia and Africa in their Total Dependency Ratio (TDR) trends. In particular, East Asia has had the fastest and most pronounced demographic transition, with its TDR dropping from a ratio of 76.4 dependents for every 100 working age population (ages 15 to 64) in 1965 to 37.7 in 2010, with a rate of change of -50.6% in 45 years (see Figure 3). However, Sub-Saharan Africa and its Western, Eastern and Middle regions are displaying an opposite trend to the rest of the world. In the estimates period, while all regions are undergoing declines in their respective TDRs, these three African areas are actually increasing them (reaching ratios above 90).
Figure 3: Total Dependency Ratio by Major regions, for all three Fertility Scenarios
Source: Own calculations from the United Nations World Population Prospects (2015)
Nevertheless, in the African region there is an acute heterogeneity in terms of the timing of the demographic transition (see Figure 5). In fact, some countries exhibit striking analogous patterns as that of Eastern Asia, in terms of the speed and timing of the transition: Mauritius, Seychelles, Reunion, Morocco, Tunisia, and Western Sahara; and to a lesser extent Zimbabwe, Algeria, Cape Verde, South Africa, Namibia, and Botswana. Nonetheless, it is important to note that no country in Middle Africa is forecasted to experience such a demographic transformation in the short run. An added issue is that of Niger, who has yet to achieve its highest peak in its TDR (expected in 2020), and the closing of the window (alongside Zambia
and Mali) is still not clear. Despite the heterogeneity in the region, if Sub-Saharan Africa continues with high trends in its fertility rates, the total dependency ratio will not only take longer in time to decrease but the level of the burden will be greater.
These rather unoptimistic results for Africa concerning the timing and magnitude of the demographic window of opportunity, illustrated above, are also reinforced when the demographic dividend is quantified. In this regard, the equation Eq.5 from Figure 2 becomes a means to measure the contribution of each factor/variable of the econometric model to the change in the GDP per capita over time. That is how the product between the estimated coefficient and the value of the variable vary between time periods (Kelley & Schmidt, 2005). Accordingly, for the total sample, the contributions in the change in Y/Ngr (0.15 percentage points on average every 5-year period), can be summarized as follows: the demographic component has a contribution of 0.24 percentage points to the change in the growth of GDP per capita, which is smaller than that of the economic component (0.47), and the convergence factor (-0.56). However, the latter result could be rather misleading if one does not acknowledge the contribution of every single explanatory variable. In this regard, among the demographic variables, the Child Dependency Ratio (D1) takes the lead (0.37), followed by the Size of the Population (-0.21), the Old Age Dependency Ratio (D2) (0.07), the Population Density (0.02), and the arithmetic effect (-0.01). Concerning the economic variables, Sectoral Change accounts for most of the contribution (0.26), followed by Life Expectancy at birth (0.09), Inflation (0.06), Savings (0.03), Capital (0.02), Political Rights (0.01), and Government Consumption (-0.01). Additionally, the comparison among regions shows that, on average for D1, Asia is the forerunner (0.6), having seized the demographic dividend the most. Europe/North-America/Oceania and Latin America and the Caribbean follow next with a contribution of 0.4 percentage points to the growth of GDP per capita, with Africa contributing the least (0.16).
In fact, these geographic differences between the front-runner (Asia) and the laggard (Africa) turn out to be greater when Eq.5 is estimated for each region separately (Table 1). The estimation results again reflect that the first dividend has had a major impact in Asia when compared to the rest of the world, with Africa lagging behind (with the coefficient of the child dependency ratio being almost half the size of Asia’s). In more detail, for Asia, these empirical results suggest that the variation in the child dependency ratio between the years 1960-2014 (from 70.45 to 37.61) has contributed an average of 0.6pp every 5-year period to the growth of the GDP per capita; on the other hand, Africa has only contributed 0.03pp, not only due to its lesser impact (that is, its lower coefficient), but also because the reduction of its child dependency ratio over this period has been much smaller (from 79.51 in 1960 to 74.92 in 2014).
Table 1: Empirical results for the third specification by major areas
Note: * Denotes 10% significance, ** denotes 5% significance, and *** denotes 1% significance.
All in all, when analysing the evolution of the demographic contributions for Asia and Africa until the year 2100 (Figure 3), that is the evolution of the contribution of the arithmetic effect and the dependency ratios on changes in Y/Ngr, the following results have been obtained:
In the case of Asia, at the beginning of the demographic window, the contributions of the arithmetic effect (WAgr – Ngr) have been relatively important, in the sense that the growth in WA has been larger than the one in N. However, the contribution of the Child Dependency Ratio largely exceeds this mathematical effect from 1975 onwards. It is worth mentioning that Asia will continue to benefit from a first demographic dividend (until 2040), mainly explained by those countries who are still within the window of opportunity.
Africa, conversely, presents a pattern in which until the 80’s the contribution of the Child Dependency Ratio has been rather acute (negative), while gradually declining over time. Simultaneously, the arithmetic effect, although relatively low, has been positive throughout 1965 to 2000. Actually, in this particular region the demographic transition is expected to be slow and longer in time, with a much lesser impact of D1 with respect to Asia.
Coefficients:
Y/WA (Initial, in log) -6.819 *** -6.881 *** -4.691 *** Gross Capital Formation (% of GDP) 0.095 *** 0.107 ** 0.086 **
Life Expectancy at birth (in log) 4.329 * -2.016 6.950 ** Inflation (Annual percentage) -0.004 *** -0.004 *** -0.021 *** Sectoral Change (% Agriculture in GDP) -0.161 *** -0.146 ** -0.066
Government Consumption (% of GDP) -0.125 *** -0.119 -0.043 Political Rights (Rating of Freedom) -1.019 ** -1.098 -1.175 Political Rights^2 0.118 ** 0.135 0.124 Gross Savings (% of GDP) 0.078 *** 0.119 *** 0.017 Child Dependency ratio (log) -5.624 *** -8.278 *** -4.990 * Old Age Dependency ratio (log) 2.553 * 0.363 -0.617 Population Density (per sq. km) 0.002 ** 0.002 *** 0.007 Population Size (log of N) -2.604 *** -5.040 ** -1.122 Constant 107.0 *** 191.3 *** 55.3 **
Periods included: 9 9 9
Cross-sections included: 132 34 41
Total panel observations: 742 190 239
R-squared: 0.56 0.66 0.55 Adjusted R-squared: 0.45 0.55 0.42 CONVERGENCE PRODUCTIVITY (Ze) (Zd) ALL
COUNTRIES ASIA AFRICA
-0.6 -0.4 -0.2 0 0.2 0.4 0.6 0.8 1 1.2 1.4 196 5 197 0 197 5 198 0 198 5 199 0 199 5 200 0 200 5 201 0 201 5 202 0 202 5 203 0 203 5 204 0 204 5 205 0 205 5 206 0 206 5 207 0 207 5 208 0 208 5 209 0 209 5 210 0
Differences in the arithmetic effect Differences in log(D1) Differences in log(D2)
-0.6 -0.4 -0.2 0 0.2 0.4 0.6 0.8 1 1.2 1.4 196 5 197 0 197 5 198 0 198 5 199 0 199 5 200 0 200 5 201 0 201 5 202 0 202 5 203 0 203 5 204 0 204 5 205 0 205 5 206 0 206 5 207 0 207 5 208 0 208 5 209 0 209 5 210 0
Differences in the arithmetic effect Differences in log(D1) Differences in log(D2)
AFRICA ASIA
Figure 3: Contribution of the arithmetic effect and the Dependency Ratios on changes in Y/Ngr
Source: Own calculations based on the econometric model estimates and the UN Medium Fertility Scenario
However, these latter results describe an expected scenario for Africa without applying any policy action. In this regard, the situation could be improved if the region applied not only those economic policy actions oriented towards maximizing the gain from a demographic gift, but also demographic policies directed towards improving and accelerating the opening and widening of the window. Precisely, Stage 2 focuses on identifying which are the most relevant policies by geographic areas by performing several alternative estimations including a policy proxy and an interaction term between each policy proxy and the Child Dependency Ratio. The statistical significance and the magnitude of the parameter will indicate the relevance or not of the policy. The results obtained are described as follows (Table 2):
For the socio-economic variables, those policies that appear to be most relevant are those related to human capital, labour market, and gender (whereas the proxies regarding openness to trade and access to water were not statistically significant); on the other hand, for the demographic variables, the policies that stand out are those directly related to the opening of the demographic window of opportunity (the total fertility and infant mortality rates), while the variables on migration and urbanization are not statistically significant.
Asia is the region that appears to have fared well on both accounts – the demographic and socio-economic –, with the contribution of the economic factors being greater than the demographic ones. More specifically, the highest values of the coefficients for the front-runners has been found in the Total Unemployment, Female Education, and Human Capital.
Africa, conversely, has obtained statistically significant results for the parameters of the variables related to demographic policies with regards to its front-runners. However, on the socio-economic domain, there is certain confidence owing to the significant parameters for the gender policies concerning Female Labour Force Participation and the
Female Education proxies. It is also important to point out that the variable for the prevalence of HIV/AIDS is statistically significant for the African region only, probably due to the high prevalence of the disease in the continent, which can be clear indication of the relationship between the existence of this epidemic and lesser gains from a demographic dividend.
Table 2: Estimated coefficients for the variable D1 (log of the child dependency ratio) in the regressions that include the policy proxies and its interaction term.
Note: The asterisks indicate the results obtained in the Wald Test, where * denotes 10% significance; ** denotes 5% significance; and *** denotes 1% significance.
Indeed, the statistical significance from the econometric model has provided the guideline signalling what elements are most relevant for each geographic area. Whereas Asia has had a general success in almost all the policy proxies, Africa is still far behind. In fact, the demographic factors in most of Africa not only hinder from gaining from a demographic bonus or gift, but affect the previous step which is the opening of a real window of opportunity. Various of reasons that justify this delay are: 1) the region is at an incipient state of its demographic transition; and 2) the existence of a high ideal family size in Sub-Saharan Africa (since children are still viewed as labour source and as insurance against old age). On the other hand, the statistical evidence with regards to the importance of the epidemic of HIV/AIDS in the region cannot be omitted. The relevance of this issue with regards to the demographic dividend is because the disease attacks people of the working age, thus leaving orphans and elderly without support. Thus, because the region starts from worse conditions in terms of the process of demographic transition, a proper understanding of the successful policies that have permitted to reap from a demographic dividend becomes imperative. In this sense, gender equality in the labour force and the skills set (achieved through better
-1,855 -6,824 *** 55,077 -5,931 -1,328 -7,530 *** 22,286 -3,878 1,101 -7,388 *** 6,293 -7,268 * -1,952 -6,866 *** 19,899 -7,046 * -1,691 -4,202 0,700 -2,373 ** -6,587 * -11,127 *** -1,463 -3,111 -5,890 ** -9,644 *** 69,234 -10,508 -0,084 -5,799 * 2,358 -5,059 -6,496 ** -10,659 *** 20,638 -7,120 ** -16,314 * -5,700 0,965 -7,141 *
Laggards Front-runners Laggards Front-runners
ASIA AFRICA SOC IO-ECO N OMIC PRO X IE S LABOUR MARKET Total Unemployment
Human Capital (Average years of total schooling)
GENDER
Female Unemployment
Female Education (Average years of total schooling) Female Labour Force Participation
D EMOGRA PHIC PRO X IE S FERTILITY Adolescent Fertility Contraceptive Prevalence
Total Fertility Rate
MORTALITY Infant Mortality
education) can become a critical asset in terms of amplifying a demographic dividend and reducing poverty in the region, as well as providing enough employment for all the population, both men and women included.
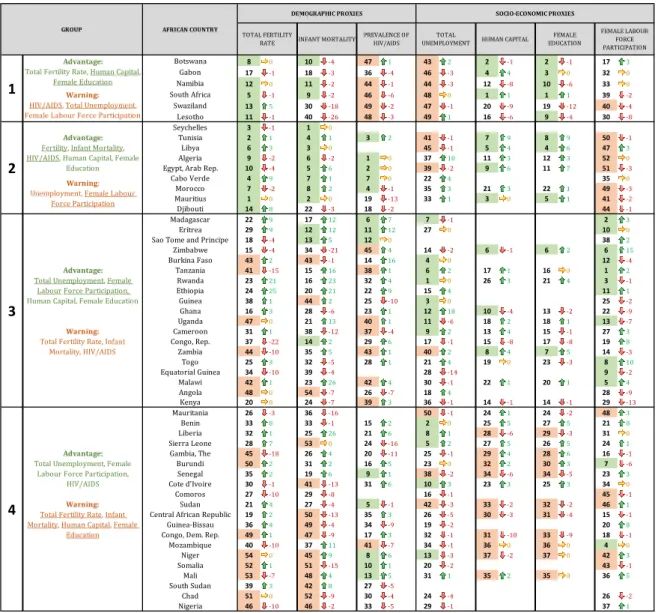
Nevertheless, in order to gain a more appropriate and better picture of what has been happening in Africa and how to improve its future scenario, it becomes imperative to acknowledge the prevailing heterogeneity in the region. Not all African countries are following the same pattern in terms of the speed of the demographic transition and the socio-economic performance. Hence, identifying key policies and directing a strategic action targeted to where it is really needed can be a great asset. Therefore, in Stage 3 the countries have been classified and ranked depending on their performance according to the policy proxies identified as relevant in the regression analysis. The resulting outcome has been twofold: 1) the identification of front-runners and laggards on the individual level (each country individually); and 2) the organization of all these countries into four different groups that share similarities in terms of the policy prioritization. In more detail, when this latter clustering is combined with the timing and speed of each country’s demographic window of opportunity, provided by the descriptive analysis, the following groups of countries with similar policy strategies can be highlighted:
GROUP 1. Success is on the near horizon, but you face two problems: HIV/AIDS and total unemployment.[All Southern Africa + Gabon]
These countries have had a relatively early opening of their windows of opportunity, although improvements are needed in their mortality rates (both infant and, especially adult). In fact, their greatest challenges are related to the hindrance of having amongst the highest mean
prevalence of HIV/AIDS in the world, as well as suffering from equally high rates of total unemployment. On the positive side, they are succeeding on the human capital and female education fronts. Given their low total dependency ratios at the end of their windows, real
and beneficial gains from a demographic dividend could be obtained. However, such an opportunity could be lost if they wait for too long in applying these measures.
GROUP 2. Very limited timing, focus on the labour market and, especially, in employing your female population. [Mainly Northern Africa + the islands + Djibouti] These states are particularly struggling on increasing their female labour force
participation. Nevertheless, this is the group that is thriving in the demographic domain,
having the lowest averages in the total fertility rate, infant mortality rate, and prevalence
of HIV/AIDS (except Djibouti). Additionally, on the educational sphere most of these
countries are amongst the better educated in the total rankings. Although Morocco, Tunisia, Mauritius, and Seychelles have already closed their windows of opportunity (or are about to
do so), the remaining ones are still in time to introduce modifications in their policy strategy (correct the gender issue in the labour market), as the returns from the demographic dividend would be immediate.
GROUP 3. Speed up the timing of the demographic window, you have good socio-economic tools in place. [Mostly Eastern Africa + a few Western/Middle region countries] This is the set of countries who are front-runners in the labour market. The group has the lowest average total unemployment rate and the highest female labour force
participation. Likewise, the level of education is relatively good for most, with a few being at
the top of the ranking. However, the majority of these nations are laggards in terms of the demographic proxies (especially the total fertility rate). Therefore, the priorities in the policy implementation should be demographic related, working towards opening a real window of opportunity by decreasing the total fertility and infant mortality rates, as well as monitoring the HIV/AIDS epidemic. If such measures are not applied, it cannot be guaranteed that most of these countries will properly capitalize on the demographic dividend (given the forecasted high dependency ratios at the end of their windows).
GROUP 4. Watch out! Urgent action is required in three spheres: fertility, infant mortality and education. [Mostly Western/Eastern Africa + some in Middle Africa + Sudan] Unfortunately, this is the group that will have to tackle more obstacles in order to secure a future demographic dividend. They are the weakest in terms of the demographic proxies (except for the prevalence of HIV/AIDS), sharing the highest total fertility and infant
mortality rates. Moreover, the least educated citizens are in this group, as all the main
laggards in terms of human capital and female education are located in this cluster. Essentially these countries’ only advantages are labour market related (total unemployment rate and average female labour force participation). They will all have to apply greater efforts so as to further decrease their total dependency ratios and transform their current window projections in order to obtain fruitful benefits from a demographic dividend.
All in all, some countries (within each cluster group) are already headed in the right direction, with various degrees of improvement and speed, thus being expected to increase their chances of succeeding in materializing a demographic dividend: Botswana (Group 1); Algeria, Cape Verde, Morocco, Libya, and Sao Tome and Principe (Group 2); Madagascar, Rwanda, Ethiopia, Tanzania, Uganda, Republic of the Congo, and Malawi (Group 3); and finally, Eritrea, Liberia, Benin, and Sierra Leone (Group 4).
Table 3: Classification of countries according to the K-means clustering results, combined with the current positions and arrows of each policy proxy
Source: Own calculations from the United Nations World Population Prospects (2012), and the World Bank (2015)
Advantage: Botswana 8 0 10 -4 47 1 43 2 2 -1 2 -1 17 3
Gabon 17 -1 18 -3 36 -4 46 -3 4 4 3 0 32 0
Namibia 12 0 11 -2 44 -1 44 -3 12 -8 10 -6 33 0
Warning: South Africa 5 -1 9 -2 46 -6 48 0 1 1 1 1 39 -2
Swaziland 13 5 30 -18 49 -2 47 -1 20 -9 19 -12 40 -4 Lesotho 11 -1 40 -26 48 -3 49 1 16 -6 9 -4 30 -8 Seychelles 3 -1 1 0 Advantage: Tunisia 2 1 4 1 3 2 41 -1 7 9 8 9 50 -1 Libya 6 3 3 0 45 -1 5 4 4 6 47 3 Algeria 9 -2 6 -2 1 0 37 10 11 3 12 3 52 0
Egypt, Arab Rep. 10 -4 5 6 2 0 39 -2 9 6 11 7 51 -3
Cabo Verde 4 9 7 1 7 0 22 4 35 0 Morocco 7 -2 8 2 4 -1 35 3 21 3 22 1 49 -3 Mauritius 1 0 2 0 19 -13 33 1 3 0 5 1 41 -2 Djibouti 14 8 22 -3 18 -2 44 -1 Madagascar 22 9 17 12 6 7 7 -1 2 3 Eritrea 29 9 12 12 11 12 27 0 10 0
Sao Tome and Principe 18 -4 13 5 12 0 38 2
Zimbabwe 15 -4 34 -21 45 4 14 -2 6 -1 6 2 6 15 Burkina Faso 43 2 43 -1 14 16 4 0 12 -4 Advantage: Tanzania 41 -15 15 16 38 1 6 2 17 1 16 0 1 2 Rwanda 23 21 16 23 32 4 1 0 26 3 21 4 3 -1 Ethiopia 24 25 20 21 22 9 15 4 11 1 Guinea 38 1 44 2 25 -10 3 0 25 -2 Ghana 16 3 28 -6 23 1 12 18 10 -4 13 -2 22 -9 Uganda 47 0 21 13 40 1 11 -6 18 2 18 1 13 -7 Warning: Cameroon 31 1 38 -12 37 -4 9 2 13 4 15 -1 27 3 Congo, Rep. 37 -22 14 2 29 6 17 -1 15 -8 17 -8 19 8 Zambia 44 -10 35 5 43 1 40 2 8 4 7 5 14 -3 Togo 25 3 32 -5 28 1 21 4 19 0 23 -3 8 10 Equatorial Guinea 34 -10 39 -4 28 -14 9 -2 Malawi 42 1 23 26 42 4 30 -1 22 1 20 1 5 4 Angola 48 0 54 -7 26 -7 18 4 28 -9 Kenya 20 0 24 -7 39 3 36 -1 14 -1 14 -1 29 -13 Mauritania 26 -3 36 -16 50 -1 24 1 24 -2 48 3 Benin 33 8 33 -1 15 2 2 0 25 5 27 5 21 8 Liberia 32 1 25 26 21 6 8 1 28 -6 29 -3 31 0 Sierra Leone 28 7 53 0 24 -16 5 2 27 5 26 5 24 1
Advantage: Gambia, The 45 -18 26 4 20 -11 25 -1 29 4 28 6 16 -1
Burundi 50 2 31 2 16 5 23 0 32 2 30 3 7 -6
Senegal 35 2 19 6 9 1 38 -2 34 -6 34 -5 23 3
Cote d'Ivoire 30 -1 41 -13 31 6 10 3 23 3 25 3 34 0
Comoros 27 -10 29 -8 16 -1 45 -1
Warning: Sudan 21 4 27 -4 5 -1 42 -3 33 -2 32 -2 46 1
Central African Republic 19 2 50 -13 35 3 26 -5 30 -3 31 -4 15 -1
Guinea-Bissau 36 4 49 -4 34 -9 19 -2 20 8
Congo, Dem. Rep. 49 1 47 -9 17 3 32 -1 31 -10 33 -9 18 -1
Mozambique 40 -10 37 11 41 -7 34 -1 36 0 36 0 4 0 Niger 54 0 45 9 8 6 13 -3 37 -2 37 0 42 3 Somalia 52 1 51 -15 10 1 20 -2 43 -1 Mali 53 -7 48 4 13 5 31 1 35 2 35 0 36 5 South Sudan 39 3 42 8 27 -5 Chad 51 0 52 -9 30 -4 24 -4 26 -2 Nigeria 46 -10 46 -2 33 -5 29 -1 37 1
Fertility, Infant Mortality, HIV/AIDS, Human Capital, Female
Education
Warning:
Unemployment, Female Labour Force Participation
AFRICAN COUNTRY
DEMOGRAPHIC PROXIES SOCIO-ECONOMIC PROXIES
3 4 1 2 HUMAN CAPITAL GROUP
Total Fertility Rate, Human Capital, Female Education HIV/AIDS, Total Unemployment, Female Labour Force Participation
Total Fertility Rate, Infant Mortality, Human Capital, Female
Education Total Unemployment, Female
Labour Force Participation, Human Capital, Female Education
Total Fertility Rate, Infant Mortality, HIV/AIDS
TOTAL FERTILITY
RATE INFANT MORTALITY
PREVALENCE OF HIV/AIDS TOTAL UNEMPLOYMENT FEMALE EDUCATION FEMALE LABOUR FORCE PARTICIPATION
Total Unemployment, Female Labour Force Participation,
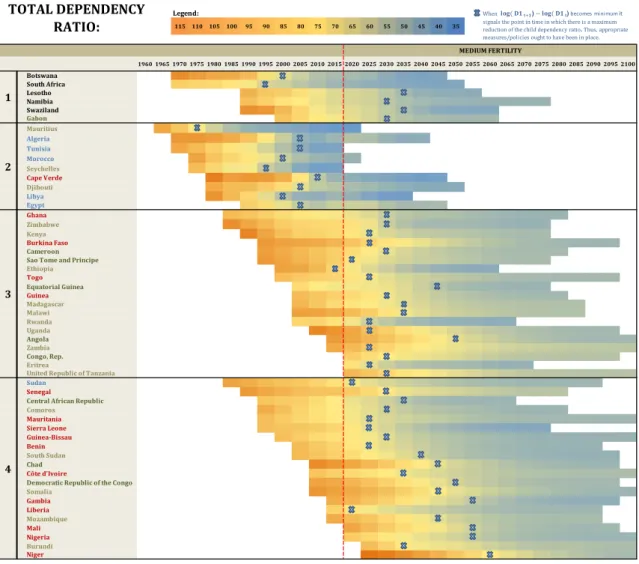
Figure 4: African Demographic Windows of Opportunity according to the Total Dependency Ratios by the previous cluster groups
Note: The opening of the window of opportunity has been established as the moment after the highest peak in the total dependency ratio that is leading towards a declining trend, whereas the closing of the window is the period in which the dependency reaches its minimum and is forecasted to increase. The colours highlighted in each country reflect the geographical region they belong to: blue is Northern Africa, black is Southern Africa, brown is Eastern Africa, green is Middle Africa, and red is Western Africa. Additionally, for each group cluster, the countries are organized from the earliest opening of their respective windows to the latest.
Source: Own calculations from the United Nations World Population Prospects (2015), and the World Bank (2015)
Legend: When 115 110 105 100 95 90 85 80 75 70 65 60 55 50 45 40 35 1960 1965 1970 1975 1980 1985 1990 1995 2000 2005 2010 2015 2020 2025 2030 2035 2040 2045 2050 2055 2060 2065 2070 2075 2080 2085 2090 2095 2100 Botswana South Africa Lesotho Namibia Swaziland Gabon Mauritius Algeria Tunisia Morocco Seychelles Cape Verde Djibouti Libya Egypt Ghana Zimbabwe Kenya Burkina Faso Cameroon Sao Tome and Principe
Ethiopia Togo Equatorial Guinea Guinea Madagascar Malawi Rwanda Uganda Angola Zambia Congo, Rep. Eritrea
United Republic of Tanzania
Sudan Senegal
Central African Republic
Comoros Mauritania Sierra Leone Guinea-Bissau Benin South Sudan Chad Côte d'Ivoire
Democratic Republic of the Congo
Somalia Gambia Liberia Mozambique Mali Nigeria Burundi Niger 4 TOTAL DEPENDENCY
RATIO: signals the point in time in which there is a maximum
reduction of the child dependency ratio. Thus, appropriate measures/policies ought to have been in place.
1
MEDIUM FERTILITY
2
3
4. Policy implications and recommendations
According to the results obtained in the present investigation in terms of the specific policies that guarantee to take advantage from the benefits of a demographic gift, Africa’s key challenges that merit special attention are the following:
1) Its High Fertility is a serious obstacle, markedly because the equally high infant mortality demands more children so as to guarantee a major number of survivors; thus, policies oriented towards the acceleration of the demographic transition (particularly the fertility decline) are required, which include improving the survival of infants, delaying the age at first union and at first birth (mainly reducing adolescent fertility), and major investments in family planning programs (with greater political commitment in providing modern methods) since unmet need for contraception is higher in Africa than elsewhere;
2) the region needs to improve its Human Capital and Employment necessities, given its shortage in terms of qualified and skilled labour, so increasing the educational level of African citizens and favouring job creation on a massive scale is rather urgent, with a special attention to gender equity;
3) a positive advantage is the Role of Women in Africa since the female labour force participation is relatively high, therefore, strengthening and maximizing women’s participation in more qualified and better jobs, as well as keeping girls in schools, becomes imperative in order to avoid their inclusion in the dependent group, alongside children and the elderly;
4) all previous policy accomplishments could become futile if no action is done in the battle
against HIV/AIDS, especially in the most affected countries in Sub-Saharan Africa, as it
mostly threatens the working age population; henceforth, efforts in reducing Adult Mortality are a prerequisite, namely through a better control of the three big killers in Africa (malaria, HIV/AIDS, and tuberculosis), and avoiding as much as possible debilitating wars that destroy the foundation that the demographic gift offers;
5) it should be acknowledged that not all countries are expected to have a fatalist outcome (being front-runners in various demographic or socio-economic domains), which calls for
strategic policy action through resources allocation adapted to each country’s context and
characteristics;
6) It is crucial to recognize the Heterogeneity within countries in terms of socioeconomic factors since the leading groups will benefit more than the laggards, that is, the poor people with less access to information and job opportunities will not be able to gain as much from the demographic dividend than those that are better off.
Although all these measures would facilitate to increment the gains from a potential demographic dividend in Africa and, thus, boost its development, not all of them have the same priority according to each individual country. In this sense, given the great heterogeneity existent in the African continent, the policy recommendations are classified in these four groups of countries, each with specific implications.
GROUP 1. Success is on the near horizon, but you face two problems: HIV/AIDS and total unemployment.
Countries: Botswana, Namibia, South Africa, Swaziland, Lesotho (Southern Africa); and Gabon (Middle
Africa)
POLICY RECOMMENDATION
:
Their priorities in terms of urgent policy action should be focused mainly on the AIDS epidemic and the total unemployment. To a lower extent, additional measures to further reduce infant mortality ought to be considered as well.
Regarding the timing available to apply all these policy measures:
Botswana and South Africa should have already done their homework given that their blue crosses in Figure 12 are located in the late 90’s. In this sense, Botswana has already been slowly improving on these particular policy areas, yet greater efforts should be made in order to fully maximize the gains from the demographic dividend.
Whereas, the remaining countries (Gabon, Namibia, Swaziland, and Lesotho) should apply all these critical policies before the year 2030-35 and, so far, as observed in Table 10, they are faring negatively. Thus, if the right measures are not implemented, the opportunity from a demographic gift will be most definitely lost.
GROUP 2. Very limited timing, focus on the labour market and employing your female population immediately.
Countries: Tunisia, Libya, Algeria, Egypt, Morocco (North of Africa); Djibouti, and the islands of
Seychelles, Mauritius (in Eastern Africa), and Cape Verde (Western Africa).
POLICY RECOMMENDATION:
The main problem these countries are facing is related to the participation of women in the labour market, as well the high total unemployment rate. Thus, the strategy in terms of policymaking should be focused on implementing greater efforts in this particular domain.
Limited timing to capitalize on the demographic dividend:
Some countries have already closed or are immediately about to close their demographic windows of opportunity (Tunisia, Seychelles, Mauritius, and Morocco).
Regarding the remaining countries:
They should have already introduced modifications in their policy strategy during the decade of the 2000’s so as to maximize the reaping from the demographic gift (see blue crosses in Figure 12).
However, since their total dependency ratios are on the low side, they can still take some advantage but it is imperative to quickly correct the gender issue concerning their labour market, as the returns from the dividend would be immediate.
On this regard, some countries in this group are slowly headed towards this direction in terms of total unemployment (Algeria and Cape Verde), however, the picture for female labour force participation is somewhat worrisome (with the exception of Libya).
GROUP 3. Speed up the timing of the demographic window, you have good socio-economic tools in place.
Countries: Madagascar, Zimbabwe, Tanzania, Rwanda, Ethiopia, Uganda, Zambia, Malawi, Eritrea, Kenya
(Eastern Africa); Burkina Faso, Guinea, Ghana, Togo (Western Africa); Angola, Cameroon, Congo Rep., Equatorial Guinea, and Sao Tome and Principe (Middle Africa).
POLICY RECOMMENDATION
:
Taking into account that these countries fare well in the socio-economic proxies, their priorities in the policy implementation should be demographic related. In other words, they ought to actually work towards speeding up and procuring a real window of demographic opportunity by decreasing both the total fertility rate and the infant mortality rates, as well properly monitoring the HIV/AIDS epidemic. In this sense (see arrows in Table 10):
Some countries are already headed towards this direction:
Eritrea, Madagascar, Rwanda, and Ethiopia have been impressively improving their positions in the rankings on both the fertility and infant mortality proxies;
Also, Tanzania, Uganda, and Malawi have succeeded in lowering their infant mortality rates specifically;
However, Equatorial Guinea has been worsening on both the total fertility and the infant mortality rates; whereas Tanzania, Republic of Congo, and Zambia have dropped many positions of the fertility area yet have been improving on lowering their infant mortality.
Since the socio-economic proxies are in their favour, a large capitalization of the demographic dividend is foreseeable if even greater improvements are achieved in this particular area. Given that the maximum gain from a dividend is expected to be reached on the decade of 2020’s in the majority of these countries (see blue crosses in Figure 12), the timing to apply any policy strategy ought to be before this time period.
5. Research parameters
In order to provide empirical evidence on the subject matter, the present investigation has employed the econometric analysis provided by the so called Harvard Framework. There has been a great amount of debate on the empirical assessment of the economic consequences of rapid population growth (see Kelley & Schmidt, 2005). Yet the emergence in the 90’s of the theoretical framework provided by Barro (Barro 1991, 1996; Barro & Lee 1994) enriched the analysis on the demographic dividend, as it incorporated demography into the convergence models (Eq. 1), showing a negative relationship between population and economic growth (which was in line with the arguments provided by Malthus (1798)). However, the Harvard framework (Bloom & Williamson 1997, 1998; Bloom & Canning 2001, 2003; Radelet et al. 2001; Bloom et al. 2000) set up the pathway for further conventional econometrics analysis
GROUP 4. Watch out! Urgent action is required in three spheres: fertility, infant mortality and education.
Countries: Benin, Liberia, Sierra Leone, The Gambia, Senegal, Cote d’Ivoire, Guinea-Bissau, Niger, Mali,
Mauritania, Nigeria (Western Africa); Burundi, Comoros, Mozambique, Somalia, South Sudan (Eastern Africa); Central African Republic, Chad, Democratic Republic of Congo (Middle Africa); and Sudan
(Northern Africa).
POLICY RECOMMENDATION:
These countries ought to immediately implement measures directed towards increasing their level of human capital, with greater efforts in providing further education to the female population. Thus, it will allow to trigger and complement other important policy actions regarding the fight against infant mortality as well as the decrease of the total fertility rate. In a more detailed note (see Table 10):
On the positive side, three countries have been improving their positions in both the educational front and the demographic domain (Benin, Sierra Leone, and Burundi);
On the negative side:
A group of countries have dropped several positions in the education proxies (Democratic Republic of the Congo, Liberia, Senegal, and to a lower extent, Sudan, Central African Republic, and Niger);
Regarding the demographic proxies, a few countries have lost positions in both fertility and infant mortality indicators (Mauritania, Comoros, Côte d’Ivoire, and Nigeria); whereas others only in infant mortality (Somalia and Central African Republic); while others only in the fertility proxy (the Gambia and Mozambique).
Concerning the timing necessary to apply all these strategic policy actions, this particular cluster presents more heterogeneity in terms of the year projected to achieve maximum gains of the dividend (blue crosses in Figure 12). In any case, it is possible to observe two different schedules.
A first group should not wait longer than the threshold years between 2020-2035 to apply their policy implementations;
A second group have slightly more time under the current projections (until 2040-2055); however, if major improvements were achieved on the demographic transition the process should then be able to accelerate, thus providing greater gains in a potentially conceivable dividend.
by focusing on population impacts due to imbalanced age-structure changes over the Demographic Transition (Kelley & Schmidt 2005), indicating that population, concretely the working age population, is actually positively related.
In Figure 2, the theoretical development that supports the econometric analysis from the Harvard framework is described. Thus, the per capita GDP is explained from the expression (Y/N) = (Y/L) * (L/N) in which, given the difficulties in obtaining credible and available labour data (L) in some countries, the empirical work uses the working age population (WA) as a proxy, assuming that participation and unemployment rates are constant over time (Eastwood & Lipton, 2011). If expressed in logarithms, and by computing its difference in two distinctive moments in time Eq.2 is obtained, which explains the factors that influence the GDP per capita by distinguishing between two components: the productivity (Y/WAgr) and arithmetic effect or translations component (WA/Ngr). The latter, in turn, combines two effects (Eq.3): how an increase in WA (relative to N) represents a fall in the dependency ratio, and thus an increase in the GDP per capita growth; while also measuring the “capital dilution” (a distribution among a higher number of people). Substituting Eq.1, in the expression of Eq.3 we obtain the econometric model specification of Eq.4, where the parameters b1 and b2 allow the impact of the demographic component on economic growth to be quantified (Crenshaw et al. 1997; Bloom & Williamson 1998).
Consequently, in order to isolate from the mathematical effect the influence of demography in productivity, Kelley & Schmidt (2005) incorporated additional demographic variables (Xd) along with the economic ones (Xe), which influence the productivity in the steady-state level (Eq.5). Thus, the demographic impacts are directly measured through the parameters associated to the population’s age structure (b3), modelled by the Child Dependency Ratio (D1=population aged 0-14/population aged 15-64), the Old Age Dependency Ratio (D2=population aged 65+/population aged 15-64), the Population Density (people per sq. km of land area), and the Size of the Population. This econometric modelling allows to split the effect of each dependent population, where D1 represents a negative impact for economic growth, while D2 presents a mixed effect: on the one hand, as it occurs with children (D1), the spending allocated to this segment of the population augments; yet on the other hand, it can have a positive impact to the extent that the greater savings of the elder dependents could further boost the productivity component.
Eq. (1) (𝑊𝐴𝑌) 𝑔𝑟= 𝑋 𝛽 𝑐 ∗ 𝑙𝑜𝑔 ( 𝑌 𝑊𝐴) Eq. (2) (𝑁𝑌) 𝑔𝑟= ( 𝑌 𝑊𝐴)𝑔𝑟+ ( 𝑊𝐴 𝑁)𝑔𝑟 Eq. (3) ( 𝑌 𝑁)𝑔𝑟= ( 𝑌 𝑊𝐴)𝑔𝑟+ (𝑊𝐴𝑔𝑟 𝑁𝑔𝑟) Eq. (4) (𝑌𝑁) 𝑔𝑟= 𝑋𝑒 𝛽 𝑐 ∗ 𝑙𝑜𝑔 ( 𝑌 𝑊𝐴) + 𝑏1𝑊𝐴𝑔𝑟 𝑏2𝑁𝑔𝑟+ 𝑢 Eq. (5) (𝑌𝑁) 𝑔𝑟= 𝑋𝑒 𝛽 + 𝑏3𝑋𝑑 𝑐 ∗ 𝑙𝑜𝑔 ( 𝑌 𝑊𝐴) + 𝑊𝐴𝑔𝑟 𝑁𝑔𝑟+ 𝑢
In order to show the importance of distinguishing all these implicit effects on the relationship between population and economic growth, the first stage of the investigation sought to empirically demonstrate the benefits of the latter specification (Eq. 5 vs. Eq.4) and quantify the existence of a demographic dividend. The estimations were done for the years 1960-2014, for a sample of 132 countries (including only those with more than one million people), with the total sample of observations (742) being aggregated into five-year periods. In this regard, the estimations were first carried out using the Ordinary Least Square (OLS) method for panel data with country fixed effects. However due to the existence of endogeneity between population and economic growth, a Two Stage Least Square (2SLS) estimation method was applied, using as instrumental variables the lags in the demographic variables. All the regression estimates were performed separately for the Total sample, and by regions. The data was collected from various sources of information: 1) the United Nations World Population Prospects 2015, for the population variables; 2) the Penn World Tables (version 8.1), for the variable on real GDP data (at constant 2005 national prices in mil. 2005 US$); 3) the Barro & Lee 2013 database, for education; 4) country ratings by Freedom House (2015) for the Political Rights; and, 5) the World Development Indicators 2015 (World Bank database), for the remaining socioeconomic explanatory variables: Gross Capital formation (% of GDP), Life Expectancy at Birth, Inflation (annual percentage), Sectoral Change (weight of Agriculture on the GDP, in %), Government Consumption (% of GDP), and Gross Savings (% of GDP).
On the other hand, the second stage of the investigation aimed to identify the policy actions necessary to apply in those African countries that are yet to initiate their demographic window of opportunity, or are at a preliminary state. In order to obtain this statistical evidence, a new variable (policy proxy) and an interaction term between this policy proxy and the Child Dependency Ratio (being the latter the most relevant demographic variable for quantifying the first dividend) was added in the econometric model. In fact, all the policy proxies were dichotomized into laggards and front-runners so as to correctly interpret the interaction term and its sign.
Regarding these policy proxies, its selection was obtained through proofreading the existing literature on the demographic dividend (worldwide and in Asia), as well as taking into account the contextual and general knowledge on poverty issues in Africa. These were later classified in terms of being either Demographic (allowing the demographic transition process to speed up, and reach levels in the dependency rates that are low enough to facilitate the opening of a demographic window of opportunity), or Socio-Economic (which permit to increase or maximize the benefits from the demographic dividend once it arrives):
Demographic Policies: Total Fertility Rate, Infant Mortality, Prevalence of HIV/AIDS,
Contraceptive Prevalence, Adolescent Fertility, Malnutrition, Migration, and Urbanization.
Socio-Economic Policies: Human Capital, Total Unemployment, Openness to Trade; Access
to Water, Female Labour Force Participation, Female Unemployment, and Female Education.
Nevertheless, one cannot omit the reality that in Africa there is a great deal of heterogeneity. In this sense, the third stage of the of the analysis was dedicated to targeting, in a strategic manner, policy recommendations for African countries depending on their shared similarities in terms of demographic and socio-economic performance. Once the main key policy proxies were identified, various rankings of African countries were carried out. By doing so, two outcomes were produced: 1) Individual rankings distinguishing between laggards and front-runners; and 2) Classification into four groups of African countries (employing the K-Means Clustering technique) so as to specify a concrete course of policy action designed for each cluster.
References
Barro, R. (1991). Economic Growth in Cross-Section Countries. Quarterly Journal of Economics, Vol. 106(2), 407-443.
Barro, R. J. (1996). Determinants of Economic Growth: A Cross-Country Empirical Study. (No. w5698), National Bureau of Economic Research. Bloom D.E., Williamson J.G. (1997): “Demographic Change and Human Resource Development” in Emerging Asia: Changes and
Challenges. Asian Development Bank, Manila, 141–197.
Barro, R. J., & Lee, J. (1994).Sources of Economic Growth.Carnegie-Rochester Conference Series
on Public Policy, Vol. 40.Pp. 1-46. North-Holland.
Barro, R. J., & Lee, J. W. (2013). A New Data Set of Educational Attainment in the World, 1950– 2010. Journal of Development Economics, 104, 184-198.
Bloom, D. E., & Canning, D. (2001).Cumulative Causality, Economic Growth, and the Demographic Transition. In Birdsall, N., Kelley, A. C., & Sinding, S. (2001). Population Matters:
Demographic Change, Economic Growth, and Poverty in the Developing World (Pp.
165-197).OUP Oxford.
Bloom, D. E., & Canning, D. (2011).Demographics and Development Policy. Development
Outreach, 13(1), 77-81.
Bloom, D. E., Canning, D., &Malaney, P. N. (2000).Population Dynamics and Economic Growth in Asia. Population and Development Review, 26, 257-290.
Bloom, D. E., Sachs, J. D., Collier, P., &Udry, C. (1998).Geography, Demography, and Economic Growth in Africa. Brookings Papers on Economic Activity, 1998(2), 207-295.
Bloom, D. E., & Williamson, J. G. (1997).Demographic Change and Human Resource Development.Emerging Asia: Changes and Challenges. Manila: Asian Development Bank.
Bloom, D. E., & Williamson, J. G. (1998).Demographic Transitions and Economic Miracles in Emerging Asia. The World Bank Economic Review, 12(3), 419-455.
Bloom, D., & Canning, D. (2003).From Demographic Lift to Economic Liftoff: The Case of Egypt.
Applied Population and Policy, 1(1), 15-24.
Bloom, D., Canning, D., &Sevilla, J. (2003).The Demographic Dividend: A New Perspective on the
Economic Consequences of Population Change. Rand Corporation.
Eastwood, R., & Lipton, M. (2011). Demographic Transition in Sub-Saharan Africa: How big will the Economic Dividend be? Population Studies, 65(1), 9-35.
Feenstra, R. C., Inklaar, R., &Timmer, M. P. (2015).Penn World Table 8.1. "The Next Generation of the Penn World Table"forthcoming American Economic Review, available for download at www.ggdc.net/pwt
Freedom House (2015).Freedom in the World 2015: The Annual Survey of Political Rights and
Kelley, A. C., & Schmidt, R. M. (2005). Evolution of Recent Economic-Demographic Modeling: A Synthesis. Journal of Population Economics, 18(2), 275-300.
Malthus, T. (1798). An Essay on the Principle of Population, as it Affects the Future Improvement of Society with Remarks on the Speculations of Mr. Godwin, M. Condorcet, and other Writers. London, printed for J. Johnson, in St. Paul's church-yard, 1798. St. Paul’s
Church-Yard, London,
Mason, A. (2005). Demographic Transition and Demographic Dividends in Developed and Developing Countries.United Nations Expert Group Meeting on Social and Economic Implications
of Changing Population Age Structures, 31.
Radelet, S. Lee (2001). The Determinants and Prospects of Economics Growth in Asia.International Economic Journal, 15(3), 1-29.
Ross, J. (2004). Understanding the Demographic Dividend. Policy Projekt [Online], 8
The World Bank.(2015). World Development Indicators.WDIDatabank (Excel).TheWorld Bank Group.
United Nations. (2015). World Population Prospects: The 2015 Revision. Comprehensive dataset
Scientific Coordinator : Xavier Oudin (oudin@ird.pdr.fr) Project Manager : Delia Visan (delia.visan@ird.fr)
Find more on www.nopoor.eu Visit us on Facebook, Twitter and LinkedIn