Étude paléomagnétique des sédiments holocènes
de la Fosse du
Mackenzie, mer de Beaufort
Mémoire présentée
dans le cadre du programme de maîtrise en Océanographie en vue de l'obtention du grade de maître ès sciences
PAR © Elissa Barris
UNIVERSITÉ DU QUÉBEC À RlMOUSKI Service de la bibliothèque
Avertissement
La diffusion de ce mémoire ou de cette thèse se fait dans le respect des droits de son auteur, qui a signé le formulaire
«
Autorisation de reproduire et de diffuser un rapport, un mémoire ou une thèse». En signant ce formulaire, l'auteur concède à l'Université du Québec à Rimouski une licence non exclusive d'utilisation et de publication de la totalité ou d'une partie importante de son travail de recherche pour des fins pédagogiques et non commerciales. Plus précisément, l'auteur autorise l'Université du Québec à Rimouski à reproduire, diffuser, prêter, distribuer ou vendre des copies de son travail de recherche à des fins non commerciales sur quelque support que ce soit, y compris l'Internet. Cette licence et cette autorisation n'entraînent pas une renonciation de la part de l'auteur à ses droits moraux ni à ses droits de propriété intellectuelle. Sauf entente contraire, l'auteur conserve la liberté de diffuser et de commercialiser ou non ce travail dont il possède un exemplaire.Composition du jury :
Jean-Carlos Montero Serrano, président du jury, Université du Québec à Rimouski Guillaume St-Onge, directeur de recherche, Université du Québec à Rimouski André Rochon, codirecteur de recherche, Université du Québec à Rimouski
Stefanie Brachfeld, examinateur externe, MontcIair State University
"The ocean is a desert with its life underground and the perfect disguise above." - Dewey Bunnell
REMERCIEMENTS
Je remercie sincèrement Guillaume St-Onge pour la direction de cette maîtrise, pour sa disponibilité pour la discussion, et pour son encouragement au cours des dernières deux années. En plus, je suis reconnaissante pour les opportunités intéressantes et enrichissantes d'aider sur le terrain et pour les divers congrès et cours spécialisés auxquels j'ai eu la chance de participer. Je remercie aussi André Rochon pour ses conseils qui ont été nécessaires à la réalisation et la réussite de ce projet. Je remercie également Jean-Carlos Montero-Serrano et Stefanie Brachfeld pour avoir accepté d'évaluer mon mémoire.
Je dois aussi des remerciements au capitaine, à l'équipage et aux scientifiques à bord du NGCC Amundsen pendant la mission d'échantillonnage du projet Malina en 2009. Merci aussi au GEOTOP pour la bourse d'études supérieures de 2013, et à l'UQAR pour les bourses d'exemption des droits de scolarité supplémentaires exigés des étudiants étrangers qui ont grandement facilité mes travaux à Rimouski.
J'adresse un très grand merci à Jacques Labrie pour son aide avec les obstacles qui ont été rencontrés au cours du sous-échantillonnage, des mesures aux divers instruments au laboratoire, et avec des logiciels qui ont facilité l'analyse de mes données. Je remercie également Marie-Pier St-Onge pour sa disponibilité constante à mes questions techniques et pour les discussions théorétiques. Merci aussi à Sylvain Leblanc pour les analyses granulométriques et à Guillaume Massé pour les âges radiocarbones supplémentaires.
Finalement, je tiens à remercier tous mes camarades de laboratoire pour toutes les bonnes conversations sur la géologie et le paléomagnétisme qui ont inspirés des idées et soutenus l'intérêt au cours de l'analyse des données et lors de la rédaction du mémoire, aussi bien que pour leur appui moral et les nombreux cafés et bières partagés!
RÉSUMÉ
Les études paléomagnétiques à haute résolution sont d'importance en magnétostratigraphie et géomagnétisme, particulièrement dans l'Arctique en raison de l'inaccessibilité et des faibles vitesses de sédimentation dans plusieurs secteurs. Deux carottes sédimentaires représentant l'Holocène récent ont été récoltées dans la Fosse du Mackenzie, une région avec des vitesses de sédimentation relativement élevées. Une carotte boîte et un Calypso square core ont été prélevés à deux sites (690 et 680). Les propriétés physiques et magnétiques et la granulométrie ont été mesurées, ainsi que les aimantations remanentes naturelle, anhystérétique, isothermale et isothermale saturée (NRM, ARM, IRM et SIRM). L'hystérésis magnétique indique une forte concentration de magnétite de type pseudo-single domain, un porteur idéal de rémanence, alors que les mesures de la susceptibilité magnétique suggèrent une concentration uniforme. Les valeurs de déviation angulaire maximale (MAD) et du champ médian destructif (MDF) indiquent des données de direction d'excellente qualité et une coercivité typique de la magnétite, respectivement. Finalement, dans la carotte 690 et la partie intermédiaire de la 680, l'inclinaison vane autour des valeurs d'un dipôle axial géocentrique (GAD) pour la latitude des sites, renforçant la fiabilité du signal paléomagnétique. Finalement, des proxies de la paléointensité relative ont été construits pour les carottes 690 et 680 en normalisant la NRM par l'IRM et l'ARM, respectivement.
Vingt-et-une coquilles de pélécypodes réparties dans les deux carottes ont été récoltées pour construire un modèle d'âge au radiocarbone à chaque site, une tâche nécessaire pour la mise en contexte d'un enregistrement paléomagnétique, mais souvent difficile dans l'Arctique. En utilisant ces modèles d'âge, les enregistrements paléomagnétiques ont été comparés avec d'autres provenant du bas-Arctique et des moyennes latitudes, soulignant leur potentiel pour des études magnétostratigraphiques
régionales et soutenant l'hypothèse que le cylindre tangentiel n'influence que le comportement du champ géomagnétique dans le Haut Arctique. De plus, des cycles quasi-périodiques ont été retrouvés dans les enregistrements de la susceptibilité magnétique et pourraient refléter l'influence du cycle solaire de Suess sur les oscillations Arctique et Pacifique décennale. Finalement, les mesures granulométriques indiquent une différence de provenance entre les deux sites, spécifiquement une source additionnelle de sédiments côtiers plus grossiers au site distal.
Mots clés: fosse du Mackenzie, mer de Beaufort, Arctique, Holocène, paléointensité relative, variations paléomagnétiques séculaires, variations solaires, osci Ilation Pacifique décennale
ABSTRACT
High-resolution paleomagnetic studies are of great importance to magnetostratigraphy and geomagnetism, especially in the Arctic due to the inaccessibility and slow sedimentation rates observed in many regions. Two sediment cores representing the late Holocene were sampled in the Mackenzie Trough, a site of relatively high sedimentation rates. One box core and one Calypso square core were recovered at each site (690 and 680). Physical and magnetic properties and grain size were measured, as weil as natural, anhysteretic, isothermal and saturated remanent magnetizations (NRM, ARM, IRM and SIRM). Magnetic hysteresis parameters indicate a high concentration of pseudo-single do main magnetite, an ideal remanence carrier, while magnetic susceptibility and remanence measurements suggest a uniform concentration of these grains. Additionally, the maximum angular deviation (MAD) and median destructive field (MDF) values indicate excellent quality directional data and a coercivity typical of magnetite, respectively. In the entirety of core 690 and the middle section of core 680, inclination varies around the local geocentric axial dipole (GAD), supporting the reliability of the paleomagnetic signal. Relative paleointensity (RPI) proxies were successfully constructed for core 690 and 680 by normalizing the NRM by IRM and ARM, respectively.
A total of 21 pelecypod shells, distributed throughout both cores, were co\lected for the construction of radiocarbon-based age models at each site. This task is necessary for the placement of paleomagnetic records in their appropriate temporal contexts, though often challenging in the Arctic. Using their respective age models, the full-vector paleomagnetic records were compared with other low Arctic and mid-latitude records, highlighting their potential in regional magnetostratigraphic studies and furthermore supporting the hypothesis that the influence of the tangent cylinder on magnetic field behavior is limited to the High Arctic. Additionally, quasi-periodic cycles were found in the magnetic susceptibility records and could reflect the influence of the Suess solar cycle on the Arctic
and Pacific Decadal Oscillations. Finally, grain size measurements suggest a difference in provenance between the two sites, specifically a possible additional supply of larger-grained, coastal sediments to the more distal site.
Key words: Mackenzie Trough, Beaufort Sea, Arctic, Holocene, relative paleointensity, paleomagnetic secular variation, solar variations, Pacific Decadal Oscillation
TABLE DES MATIÈRES
REMERCIEMENTS ...... IX RÉSUMÉ ... XI
ABSTRACT ... XIVv
TABLE DES MATIÈRES ... XVII
LISTE DES TABLEAUX ... XIX
LISTE DES FIGURES ... XXI
INTRODUCTION GENERALE ... 26 - /
PALEOMAGNETIC STUDY OF HOLOCENE SEDIMENTS FROM THE
MACKENZIE RIVER TROUGH, BEAUFORT SEA ... 35
CONCLUSION ... 85
LISTE DES TABLEAUX
Tableau l : Core locations ... 43 Tableau 2 : Radiocarbon dates from cores 690 and 680 ... .45
LISTE DES FIGURES
Figure 1: Location of cores 690 (green) and 680 (red) in the Mackenzie Trough, Beaufort Sea ... 42 Figure 2: Subsampling of u-channels from an open CASQ core on the deck of the CCGS Amundsen; u-channels in core 680 were overlapped by at least 10 cm in order to avoid the loss of paleomagnetic data due to the 4.5 cm smoothing function of the magnetometer ... 47
Figure 3A: CT-scan images, average grain size and sorting, and percentages of clay and silt core 690 ... 50 Figure 3B: CT-scan images, average grain size and sorting, and percentages of clay, silt and sand for core 680 ... 51 Figure 4: Examples of the correlation of physical properties, L *, a*, and Ti content,
between the CASQ cores and their associated box cores for A) core 690 and B) core 680 ... 52 Figure 5: Demagnetization of NRM, ARM, IRM, and SIRM for A) core 690 and B) core 680 ... 53
Figure 6A: Orthogonal projections (Zijderveld diagrams) of demagnetization at various depths in core 690, with open diamonds representing the vertical projection of the magnetization vector and closed diamonds the horizontal projection. Also shown are AF demagnetization plots with the MDF indicated ... 54
Figure 6B: Orthogonal projections (Zijderveld diagrams) of demagnetization at various depths in core 680, with open diamonds representing the vertical projection of the magnetization vector and closed diamonds the horizontal projection. Aiso shown are AF demagnetization plots with the MDF indicated ... 55
Figure 7: Measured inclination shown with the geocentric axial dipole (GAD), relative declination, maximum angular deviation (MAD), median destructive field (MDF), and IRMlOmT/SIRM10mT (pseudo S-ratio) for A) core 690 and B) core 680. Unreliable intervals in core 680 are shaded in gray and correspond to the upper and lower sections of the core (see text for details) ... 57 Figure 8: Magnetic hysteresis measurements (corrected to rem ove the paramagnetic component) from the top, near middle, and bottom of A) core 690 and B) core 680, with the raw measurement shown by the dashed curve. These examples are representative ofhysteresis properties measured throughout the cores ... 58 Figure 9: Day plot visualizing hysteresis parameters for core 690 (green) and core 680 (red), delimiting the single domain (SD), pseudo-single domain (PSD), and multi domain (MD) particle size ranges ... 59
Figure 10: NRM, ARM, IRM and SIRM over the characteristic range (20-60 mT), median destructive field (MDF), low-field magnetic susceptibility (kLF) , and grain size parameters SIRM30-50mT/kLF and kARM/kLF for A) core 690 and B) core 680 ... 61 Figure Il: Age models, with A) three linked linear fits for core 690 and B) a 4th order
polynomial fit for core 680, with open points representing excluded ages (see text for details) ... 63
Figure 12: Inclination of core 690 and core 680 shown with the CALS3k.4 geomagnetic field model output at station 690, as weil as cores 5JPC and 6JPC from the Chukchi Sea, core 803PC from the Beaufort Sea, core 006PC from the Northwest Passage, and a core from Mara Lake in British Columbia. Also shown is the Western U.S. PSVL record ... 66
Figure 13: Relative declination of core 690 and core 680 shown with the CALS3k.4 geomagnetic field model output at station 690, as weil as cores 5JPC and 6JPC from the Chukchi Sea, core 803PC from the Beaufort Sea, core 006PC from the Northwest Passage, a core from Mara Lake in British Columbia, and the Western U.S. PSVL record ... 67
Figure 14: Demagnetization curves showing magnetization normalized by maximum magnetization for NRM, ARM, IRM, and SIRM versus the applied field ... 69
Figure 15: Coherence of different RPr calculations with their respective normalizers for A) core 690, B) core 680, and C) the middle section of core 680. The gray lines mark a confidence level of 95% ... 70
Figure 16: RPr of core 690 and core 680 shown with the CALS3k.4 geomagnetic field model output at station 690, as weil as cores 5JPC and 6JPC from the Chukchi Sea, and core 803PC from the Beaufort Sea ... 71
Figure 17: NRM, MDF, kLF, and kARM/kLF versus age for A) core 690 and B) core 680. Possible high-frequency variations are visible in the kLF record, especially for core 690; corresponding bands of higher magnetic susceptibility between the two cores are suggested by shaded intervals ... 75
Figure 18: Wavelet analysis of A) unsmoothed and B) smoothed (sf = 3) kLF in core 690 ... 76
Figure 20: Cross-wavelet coherence between core 690 and core 680 for A) unsmoothed and B) smoothed (sf= 3) kLF ... 78
Figure 21: Comparison of kLF with 8180 records from New Mexico and Colorado, and a precipitation reconstruction [rom Washington ... 81
INTRODUCTION GÉNÉRALE
Ce projet de maîtrise se concentre sur l'étude paléomagnétique, paléoclimatique et océanographique des sédiments marins de l'ouest de l'Arctique, près de la côte des Territoires du Nord-Ouest et du Yukon dans le mer de Beaufort. Deux carottes sédimentaires ont été échantillonnées dans la Fosse du Mackenzie, un secteur où les vitesses de sédimentation sont exceptionnellement élevées et qui incise la partie ouest de la
marge continentale du bassin Beaufort-Mackenzie. Le projet se divise en deux objectifs
principaux : 1) reconstruire l'évolution récente du champ magnétique terrestre dans
l'Arctique de l'ouest, et 2) reconstituer l'histoire climatique et environnementale de
l'Arctique de l'ouest au cours de l'Holocène récent.
Échantillonnage et mesures
Afin de répondre à ces deux objectifs principaux, Jeux sites ont été sélectionnés dans
la Fosse du Mackenzie, à environ 150 km de l'embouchure du fleuve. Les sites ont été choisis en raison des vitesses de sédimentation élevées dans la fosse (e.g., Hill et al., 1991;
Macdonald et al., 1998; Bringué et Rochon, 2012). Les échantillons utilisés proviennent de
deux carottes boîtes et deux carottes de type Calypso square core (CASQ). Le CASQ, un
carottier à gravité de grand volume, a l'avantage de permettre la récolte d'une grande quantité de sédiment peu perturbé et de préserver l'interface eau-sédiment qui est
habituellement détruite par le carottage à piston. Une carotte CASQ et une carotte boîte ont
été prélevées à chaque site.
Les analyses de laboratoire comportant des mesures physiques et magnétiques ont été effectuées sur les u-channels prélevés dans les carottes CASQ et boîte. Dans un premier temps, les observations visuelles ainsi que la mesure de la composition chimique
par fluorescence X (XRF), la réflectance (spectrophotométrie) et la susceptibilité magnétique ont été effectuées à chaque centimètre. Suite à l'analyse de ces propriétés physiques, l'aimantation rémanente naturelle (NRM) a été mesurée et démagnétisée à l'aide d'un champ magnétique alternatif afin de déterminer le spectre de coercivité des minéraux magnétiques et d'isoler l'aimantation caractéristique. Le même processus a été répété avec les aimantations induites artificiellement, dont l'aimantation rémanente anhystérétique (ARM), isothermale (IRM), et isothermale saturée (SIRM). Des analyses tomographiques au CA T-scan ont également été effectuées pour visualiser les structures sédimentaires et obtenir une mesure de densité. Finalement, les u-channels ont été sous-échantillonnés à des intervalles de 5 cm pour les analyses granulométriques alors que d'autres échantillons ponctuels ont été prélevés aux limites de sections pour les mesures de l'hystérésis magnétique qui fournit de l'information sur la granulométrie et la minéralogie magnétique.
L'étude paléomagnétique
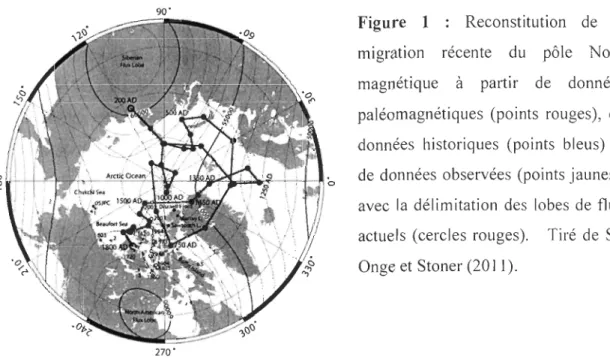
Les enregistrements paléomagnétiques à haute résolution sont nécessaires dans la compréhension des variations paléomagnétiques séculaires et des changements de paléointensité à haute fréquence. Néanmoins, ils restent particulièrement rares dans l'Arctique où des vitesses de sédimentation assez élevées pour révéler les traits géomagnétiques aux échelles millénaires et séculaires sont plus difficiles à trouver. Une connaissance plus développée de ces variations est exigée particulièrement aux hautes latitudes pour la mise en contexte des événements récents observés dans le champ magnétique dont, par exemple, la migration rapide du pôle Nord magnétique du Canada vers la Sibérie (e.g., Jackson et al., 2000; Olsen et Mandea, 2007; St-Onge et Stoner,
2011). Les variations spatiales, telle que l'évolution des lobes de flux (Figure 1), des régions de flux magnétique plus intense également situées sous le Canada et la Sibérie, peuvent être mieux comprises par l'inter-comparaison avec d'autres enregistrements environnants (e.g., Bloxham et Gubbins, 1985; Jackson et al., 2000; Stoner et al., 2013).
90'
270'
Figure 1 : Reconstitution de la
migration récente du pôle Nord magnétique à partir de données
paléomagnétiques (points rouges), de
données historiques (points bleus) et de données observées (points jaunes),
avec la délimitation des lobes de flux
actuels (cercles rouges). Tiré de St
-Onge et Stoner (2011).
Les enregistrements de résolution temporelle élevée sont aussI nécessaires pour
contribuer à la magnétostratigraphie et potentiellement servir à dater les enregistrements sédimentaires arctiques. La chronostratigraphie est une partie essentielle de toute étude
temporelle, qu'elle soit paléomagnétique ou environnementale. Cependant, les méthodes de
datation conventionnelles pour établir un modèle d'âge dans les études holocènes,
notamment la datation à l'aide du 14C, peut parfois représenter un défi de taille. Cette problématique est particulièrement commune dans l'Arctique, alors que les matériaux
datables sont généralement rares en raison d'une dissolution du matériel carbonaté plus
rapide dans les eaux froides (Jutterstrom et Anderson, 2005). De plus, le temps de
résidence du carbone inorganique dissous dans l'eau, qui rend le matériel daté plus ancien,
contrôle le degré auquel les âges mesurés doivent être corrigés et peut varier
significativement entre différentes régions des océans. Le manque de mesures précises de cet effet réservoir dans l'Arctique produit une fiabilité limitée de la calibration des âges 14C au cours de l'Holocène. Dans ce contexte, la magnétostratigraphie à haute résolution est particulièrement utile dans l'Arctique. En effet, cette technique propose une façon
alternative pour déterminer l'âge relatif d'un enregistrement récent en le corrélant avec
-Pronovost et aL, 2009; Barletta et aL, 2010; St-Onge et Stoner, 20] 1; Olafsd6ttir et aL, 2013). Cette technique permet la vérification des modèles d'âge existant et peut également aider à l'établissement de marqueurs chronostratigraphiques régionaux additionnels pour une utilisation conjointe avec les dates du radiocarbone.
L'emplacement des carottes a également une valeur potentielle pour les modèles géomagnétiques. Actuellement, les modèles du champ magnétique sont basés sur des données obtenues en majorité dans l'hémisphère nord, mais principalement au sud de 60°
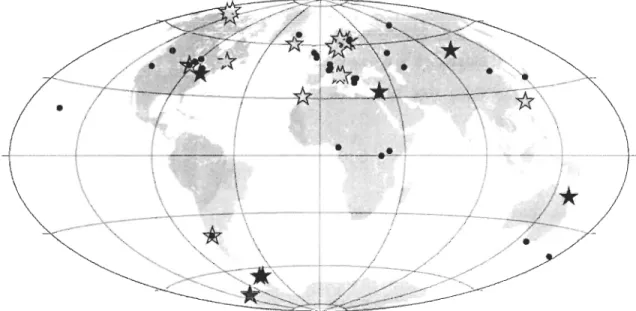
latitude (e.g., Stoner et al., 2007; Barletta et aL, 2008; Lisé-Pronovost et aL, 2009; Olafsd6ttir et aL, 2013; Korte et aL, 2011; Figure 2). Cette lacune de données paléomagnétiques dans les hautes latitudes doit être comblée afin de vérifier le niveau de précision des modèles existants dans les régions telle que l'Arctique qui sont éloignées des sources de données. Les enregistrements fiables à haute résolution ont aussi le potentiel de contribuer à la calibration et à la contrainte des futurs modèles géomagnétiques.
•
---i---
r---::---o----I--/
~
- - /
Figure 2 : Carte illustrant le manque de données aux latitudes supérieures à 600
N dans le dernier modèle géomagnétique CALS3k.4 (Korte et aL, 2011). Les données de direction sont représentées par les étoiles jaunes, les données d'intensité par les étoiles rouges et les étoiles jaunes avec le. contour rouge, alors que les données provenant des modèles géomagnétiques antérieurs sont illustrées par les points bleus. Tiré de Korte et al. (20 Il).
peu documenté. Or, il y présente un comportement différent au niveau des pôles
magnétiques contrairement aux latitudes plus basses. En raison des caractéristiques de
convection dans le noyau externe qui génère le champ magnétique, une région avec un
comportement différent existe potentiellement au sein du cylindre tangentiel, un régime
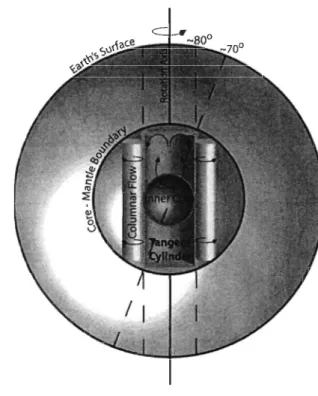
cylindrique hypothétique tangent au noyau interne et parallèle à l'axe de rotation (Figure 3). Ce régime est supposé être représenté à la surface de la Terre à environ 69.5°N, mais plus d'enregistrements à haute résolution doivent être étudiés afin de savoir si des différences se manifestent au niveau de la surface et de comprendre d'autres caractéristiques tels que les lobes de flux et la migration des pôles magnétiques (St-Onge et Stoner, 20 Il).
Figure 3 : Schéma représentant les régimes
de convection dans le noyau externe
soulignant la différence de comportement
au sein du cylindre tangentiel et montrant l'intersection du cylindre avec la surface.
Tiré de Lawrence et al. (2009).
Ainsi, dans ce mémoire de maîtrise,
deux nouveaux enregistrements des changements de direction et d'intensité du
champ géomagnétique pendant l'Holocène récent seront présentés dans l'optique de:
• développer l'utilité de la magnétostratigraphie régionale dans l'ouest de l'Arctique; • vérifier les modèles géomagnétiques dans une région sous-représentée pars les
données ;
À cette fin, les enregistrements géomagnétiques seront comparés avec d'autres
enregistrements voisins ainsi qu'avec les résultats du dernier modèle de Korte et al. (2011) afin de tester leur intérêt en magnétostratigraphie et de déterminer l'étendue de l'influence du cylindre tangentiel et des lobes du flux dans le bas-Arctique.
L'étude environnementale
Le deuxième objectif du projet est d'analyser l'histoire climatique, environnementale,
et océanographique de la région lors de l'Holocène récent, particulièrement les derniers ::::;
2500 ans, en utilisant les mesures magnétiques, physiques et granulométriques des carottes. En raison des vitesses de sédimentation élevées des sites d'échantillonnage,
mesurées entre 220 et 320 cm/ka dans une étude récente au même emplacement mené par
Durantou et al. (2012), cette étude présente des archives climatiques et océanographiques
de résolution temporelle exceptionnelle en comparaison avec les autres régions de l'Arctique. Comme c'est le cas pour le paléomagnétisme, une résolution temporelle élevée est nécessaire pour investiguer les variations environnementales qui ont lieu à des échelles
de temps plus courtes ou lors des processus cycliques séculaires à décennaux.
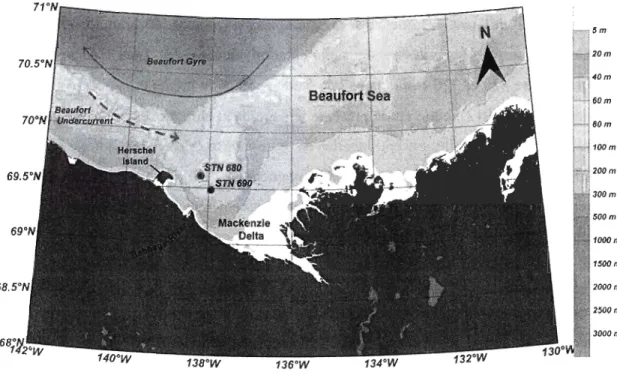
L'emplacement des deux carottes promet une perspective intéressante concernant les processus océanographiques de la région puisque ce secteur n'est pas uniquement sous l'influence du fleuve Mackenzie, mais également des courants marins profonds et de surface (Figure 4). La carotte la plus au large du delta présente un intérêt particulier car cette zone est connue pour être affectée par le courant profond de Beaufort. Ce courant originaire de l'océan Pacifique par l'intermédiaire du détroit de Béring s'écoule typiquement vers l'est le long de la marge continentale de Beaufort (Aagaard, 1984;
Carmack et Macdonald, 2002; Pickart, 2004). De plus, la sédimentation du site le plus
profond est potentiellement sensible à certains traits de la circulation de surface,
notamment le tourbillon cyclonique de Beaufort dominant dans la région (e.g., Pickart,
2004). En revanche, le site moins profond est plus influencé par des courants de surface poussés par le vent. Il y a ainsi deux régimes distincts, le premier s'écoulant vers le nord-est en suivant la côte et le second orienté vers l'ouest en direction du delta et de la Fosse du
Le panache (plume) de sédiment créé à l'embouchure du fleuve n'occupe que la partie
sommitale de la colonne d'eau (les 2-3 premiers mètres). Ce dernier est ensuite poussée vers l'est par les courants de surface provenant du remplissage préférentiel dans la partie est de la fosse (e.g., Doraxan et al., 2012). Un des objectifs de ce projet de maîtrise est donc d'étudier les diverses caractéristiques océanographiques et hydrographiques relatives aux deux sites et d'évaluer ainsi l'impoliance des variations de profondeur et de distance à
la côte.
1500m 2000m 2500m 3000m
Figure 4 : Localisation de la carotte 690 (vert) et 680 (rouge) dans la fosse du Mackenzie, mer de Beaufort.
Les deux carottes présentent également l'opportunité d'investiguer la présence des
différents régimes d'accumulations sédimentaires. La sédimentation est principalement dominée par les apports silteux et argileux du fleuve Mackenzie, mais d'autres sources de sédiment sont potentiellement présentes plus au large dans le delta. Les deux sources les
provenant de j'île Herschel, connue pour accumuler des sédiments plus grossiers d'origine continentale (Hill et al., 1991; Lantuit et Pollard, 2008). Ces sources additionnelles pourraient constituer des différences dans le triage et la granulométrie entre les deux archives et de plus révéler le rôle des courants marins et atmosphériques dans le transport de sédiments dans la fosse. De tels assemblages apporteront ainsi des précisions sur l'histoire hydrologique et l'évolution côtière de la région.
D'autres études menées dans l'Arctique ont mis en évidence dans des séquences sédimentaires des cycles climatiques telles que l'oscillation Pacifique décennale, l'oscillation Arctique et l'oscillation nord-Atlantique (e.g., Bringué et Rochon, 2012; Durantou et al., 2012). Des archives enregistrant des cycles solaires existent également et peuvent indirectement influencer les divers processus environnementaux en raison de leurs impacts sur les cycles atmosphériques et océaniques (e.g., Bond et al., 2001; Hu et al., 2003; Bringué et Rochon, 2012). Un dernier objectif important de ce projet de maîtrise est de déterminer si de tels oscillations sont observables dans l'enregistrement sédimentaire de la Fosse du Mackenzie, et dans le cas présent, de les replacer dans le contexte climatique de tout l'ouest de l'Arctique pour évaluer les limites spatiales des différentes oscillations atmosphériques et investiguer les possibles interactions entre plusieurs de ces processus.
Objectifs et organisation du mémoire
Pour mieux comprendre le comportement du champ magnétique terrestre, il est nécessaire d'avoir accès à des enregistrements paléomagnétiques continus, de haute résolution temporelle, et surtout provenant de régions polaires pour évaluer la dynamique du champ près du cylindre tangentiel. De tels enregistrements présentent également un intérêt particulier en magnétostratigraphie. Cette méthode est souvent exigée en conjonction avec, ou en remplacement de, la datation au radiocarbone dans les sédiments arctiques difficiles à dater. Finalement, différencier les divers sources de sédiments, déterminer les différents processus contrôlant la sédimentation, et extraire les signaux naturels et anthropogéniques font partie des plus grands défis se présentant dans le domaine de la paléoclimatologie. Les régimes océaniques et systèmes hydrologiques de
naturelle des variations, notamment dans les cycles solaires et atmosphériques, les précipitations et les réponses hydrologiques, est une partie essentielle pour la
compréhension des changements environnementaux actuellement observés dans l'Arctique. Ce mémoire est présenté sous forme d'un article scientifique, rédigé en anglais avec
l'intention de le soumettre à une revue internationale (à déterminer). II cherche d'une part à
reconstruire les variations du champ géomagnétique à haute résolution, mais aussi à évaluer les processus climatiques, environnementaux et océanographiques qui influencent la sédimentation dans la Fosse du Mackenzie. Je suis l'auteure principale, rédigeant sous la supervision des professeurs Guillaume St-Onge et André Rochon de l'ISMER. Je suis aussi responsable de la majeure partie des travaux de laboratoire, excluant la granulométrie qui a été réalisée par Sylvain Leblanc (lSMER) et la datation au radiocarbone qui a été effectuée
à l'Université Laval (Québec, Canada), l'Université de Géorgie (Athens, É.U.) et à
l'Université de Californie à lrvine (Irvine, É.U.). Quatre âges au radiocarbone additionnels ont été obtenus au Commissariat de l'énergie atomique et aux énergies alternatives (Saclay, France) et fournies par le professeur Guillaume Massé (Takuvik). J'ai effectué
l'interprétation de toutes les données et créé les figures présentées dans l'article avec l'aide technique de Jacques Labrie et Marie-Pier St-Onge (ISMER). L'échantillonnage a été
menée en août 2009 dans le cadre du projet intemational N!alina à bord le brise-glace NGCC Amundsen.
PALEOMAGNETIC STUDY OF HOLOCENE SEDIMENTS FROM THE
MACKENZIE RIVER TROUGH, BEAUFORT SEA
ELISSA BARRIS1,2, GUILLAUME ST-ONGE 1,2,3, ANDRÉ ROCHON 1,3
IInstitut des sciences de la mer de Rimouski (ISMER)
2Chaire de recherche du Canada en géologie marine/Canada Research Chair in Marine Geology
30EOTOP
ABSTRACT
High-resolution paleomagnetic studies are of great importance to magnetostratigraphy and geomagnetism, especially in the Arctic due to the inaccessibility
and slow sedimentation rates observed in many regions. Two sediment cores representing
the late Holocene were sampled in the Mackenzie Trough, a site of relatively high sedimentation rates. One box core and one Calypso square core were recovered at each site
(690 and 680). Physical and magnetic properties and grain size were measured, as weil as natural, anhysteretic, isothermal and saturated remanent magnetizations (NRM, ARM, IRM and SIRM). Magnetic hysteresis parameters indicate a high concentration of pseudo-single domain magnetite, an ideal remanence carrier, while magnetic susceptibility and remanence measurements suggest a uniform concentration of these grains. Additionally,
the maximum angular deviation (MAD) and median destructive field (MDF) values
indicate excellent quality directional data and a coercivity typical of magnetite,
respectively. In the entirety of core 690 and the middle section of core 680, inclination
varies around the local geocentric axial dipole (GAD), supporting the reliability of the paleomagnetic signal. Relative paleointensity (RPI) proxies were successfully constructed for core 690 and 680 by normalizing the NRM by JRM and ARM, respectively.
A total of 2] pelecypod shells, distributed throughout both cores, were collected for
the construction of radiocarbon-based age models at each site. This task is necessary for
paleomagnetic records were compared with other low Arctic and mid-latitude records, highlighting their potential in regional magnetostratigraphic studies and furthermore
supporting the hypothesis that the influence of the tangent cylinder on magnetic field behavior is limited to the High Arctic. Additionally, quasi-periodic cycles were found in the magnetic susceptibility records and could reflect the influence ofthe Suess solar cycle
on the Arctic and Pacific Decadal Oscillations. Finally, grain size measurements suggest a
difference in provenance between the two sites, specifically a possible additional supply of
larger-grained, coastal sediments to the more distal site.
Key words: Mackenzie Trough, Beaufort Sea, Arctic, Holocene, relative paleointensity,
paleomagnetic secular variation, solar variations, Pacific Decadal Oscillation
1. Introduction
High-resolution (centennial- to millennial-scale) paleomagnetic records offer
valuable insight on short-term variations of the Earth's magnetic field, and are additionally
useful as a regional stratigraphic tool. Many continuous, sedimentary paleomagnetic records representing the Holocene have been developed in recent decades, contributing to a
more complete understanding of geomagnetic field variability (e.g. Turner and Tompson, 1981; Creer and Tucholka, 1982; Lund and Banerjee, 1985; Verosub et al., 1986; Lund, 1996; Brachfeld et al., 2000; Gogorza et al., 2000; St-Onge et al., 2003; Snowball et al.,
2007; Barletta et al., 2010b). Paleomagnetic records, derived from generally continuous, high-resolution lacustrine and marine sedimentary sequences (e.g., Turner and Thompson, 1981; Verosub et al., 1986; Barletta et al., 2008; Lisé-Pronovost et al., 2009), among absolute paleomagnetic data from archeomagnetic and volcanic studies (e.g., Gallet et al., 2002; Hagstrum and Champion, 2002), have enabled the calibration of global geomagnetic
field models such as CALS3K4, CALS7K2, and CALSIOKlb (Korte et al., 2005; Korte
and Constable, 2005; Korte and Constable, 2011; Korte et al., 2011). These models have so far been demonstrated to generally reproduce the centennial- and millennial-scale
al., 201 Oa; Haberzettl et al., 2012). However, more paleomagnetic data from sparsely
stlldied regions, sllch as the Northern high latitudes (i.e. > 60° N), are needed to provide
additional constraints on the aforementioned models, so as to redllce regional biases on
global estimates of direction and intensity (Snowball et aL, 2007; Genevey et al., 2008; Knudsen et aL, 2008; Sagnotti et aL, 2011; Korte and Muscheler et al., 2012). In this study,
two high-latitude, high-resolution, full-vector paleomagnetic records are developed from the Mackenzie Trough, offshore of the Mackenzie River delta on the Beaufort Sea Shelf (North west and Yukon Territories, Canada). Recent, i.e. Late Holocene, datasets such as
these offer a means of testing the accuracy of, as weil as potentially better constraining,
geomagnetic field models over regions underrepresented by real data. They may also give
valuable insight on high-Iatitude geomagnetic field behavior, which is key to further
developing geodynamo theory. Studies such as this specifically address the "tangent cylinder" feature of the geodynamo, a probable convection regime in the outer core
theorized to lie tangent to the inner core along the Earth's rotational axis, and projected to intersect the Earth's surface at approximately 69.5° N and S (e.g., Kono and Roberts, 2003;
St-Onge and Stoner, 20 Il). Tt is thought that differences in outer core convection within this regime could be manifested in geomagnetic field behavior at high latitudes, which would additionally have important implications for magnetic pole migration and magnetic flux lobe evolution, though more paleomagnetic data from both the High and Low Arctic are needed to support this hypothesis (e.g., Bloxham and Gubbins, 1985; Kono and Roberts, 2003; St-Onge and Stoner, 2011).
Continuous paleomagnetic records can also aid in developing relative chronologies
using magnetostratigraphy, in which paleomagnetic secular variations and sometimes
relative paleointensity features of proximal sediment records are synchronized with one another in order to establish regional chronostratigraphic markers (e.g., Stoner and
St-Onge, 2007; Stoner et aL, 2007; Roberts et aL, 2013). Directional correlation between sites can be more powerful in the Arctic than at lower latitudes, since high-Iatitude records, by nature of their proximity to the North magnetic pole, have the potential to exhibit higher
amplitude variations in inclination and declination (Lisé-Pronovost et aL, 2009; Barletta et
aL, 201 Oa). Furthermore, Holocene radiocarbon-based chronostratigraphy can be more
paleoclimatic or paleomagnetic stlldy, making magnetostratigraphy vital as a means of
independently supporting radiocarbon-based chronologies, especially where datable
material is sparser than desired or calibration accounting for the reservoir effect is qllestionable (e.g., Lisé-Pronovost et al., 2009; Barletta et al., 201 Oa; St -Onge and Stoner,
2011; Olafsd6ttir et al., 2013). However, due to the inaccessibility and low sedimentation rates of man y Arctic marine locations, high-resolution Holocene paleomagnetic records
representing the northern high latitudes (> 60° N) are also sparse (e.g., Andrews and Jennings, 1990; Snowball and Sandgren, 2002; Geiss and Banerjee, 2003; Snowball and Sandgren, 2004; Snowball et al., 2007; Stoner et al., 2007; Barletta et al., 2008; Lisé-Pronovost et al., 2009; Barletta et al., 201 Ob; Sagnotti et al., 20 Il; Olafsd6ttir et al., 2013). Thus the continental shelves and slopes of Arctic marginal seas, many of which, such as the Beaufort Sea, have relatively high sedimentation rates (Darby, 2006), present promising sampling realms for the investigation of centennial- and millennial-scale variability of the high latitude geomagnetic field.
High-resolution sediment records play a similarly valliable role in the study of Arctic paleoenvironments. The magnetic and physical properties of Arctic sediments (i.e. magnetic sllsceptibility, grain size, and mineralogy) can be interpreted as signais of variations in the regional environl11ent as weil as possible cl imatic processes (e.g., Liu et
al., 2012; Simon et al., 2013; St-Onge and St-Onge, in press). Recent marine records from the Arctic provide insight on late Holocene regional environmental changes, sllch as variations in sediment output, precipitation and rllnoff(e.g., Dean, 1997; Lisé-Pronovost et al., 2009; Haberzettl et al., 2010; Durantoll et al., 2012). They can also shed light on periodic or quasi-periodic atmospheric processes occurring on decadal, centennial, and millennial scales (Zachos et al., 2001; Bringué and Rochon, 20]2; Boyer-Villemaire et al., 2013). Multi-annual to multi-decadal cycles such as the Arctic Oscillation, closely related to the North Atlantic Oscillation, play a strong role in controlling Arctic surface currents (including intake from the Pacific Ocean through the Bering Strait), as weil as precipitation
and continental runoff (Niebauer and Day, 1989; Thompson and Wallace, 1998; Ambaum
et al., 2001; Déry and Wood, 2004; Macdonald et al., 2005). The importance of the Arctic
demonstrated by prevlOus high-resolution paleoceanography studies in the Mackenzie
Trough and nearby sites in the southern Beaufort Sea (e.g., Bringué and Rochon, 2012;
Ourantou et al., 2012). Additionally, the interrelated Pacific Oecadal Oscillation, Aleutian
Low, and El Nino Southern Oscillation have also been proposed to influence the Western
Arctic in particular (Niebauer and Day, 1989; Overland et al., 1999; Macdonald et al.,
2005; Carmack et al., 2006). Impacts of the Pacific Oecadal Oscillation were identified in a
previous study at the same site as this one over the last ::::: 150 yrs, which linked positive
phases of the oscillation to relatively warm, high-salinity periods governed by increased
supplies ofPacific waters to the Beaufort Shelf(Durantou et al., 2012).
Finally, the relationship between solar activity and climate is also an important
subject of investigation; whether and how sedimentary records may indirectly record solar
cycles could provide key insights on their influence over regional climate variability (Bond
et al., 2001; Shindell et al., 2001; Hu et al., 2003; Wiles et al., 2004). Evidence for a
possible link between paleoceanography records and solar activity in the Beaufort region has been previously proposed: for example, Bringué and Rochon (2012) identified several
cool periods in a core from the southern Beaufort Sea, near the Mackenzie Trough. The
most recent of these periods could be correlated to the Little Ice Age, which, is thought to
be related to the consecutive Wolf, Sporer, and Maunder solar minima (e.g., Lean and
Rind, 1999; Bond et al., 2001; Wiles et al., 2004; Koch et al., 2007). The two records of
magnetic and physical properties evaluated here were obtained at exceptionally high
resolutions relative to many Arctic sediment records, and they not only present important
information to high latitude geomagnetic and magnetostratigraphic studies, but may also
provide further evidence of the influence of solar or atmospheric cycles on regional
climate.
2. Regional Geologie Setting
2.1. Sedimentology
The continental seas and marginal shelves of the Western Arctic are ideal locations
largest Arctic river in terms of freshwater discharge (Iargest in the North American Arctic),
is the largest single source of sediment to the Arctic and dominates sedimentation on the Beaufoli Shelf, carrying an annual load of::::; 125 Mt of sediment (Hill et al., 1991; Carson
et al., 1998; Macdonald et al., 1998). The Mackenzie Trough itselfexhibits the highest rate of sediment accumulation in the region, often reaching a few millimeters per year (e.g.,
Hill et al., 1991; Macdonald et al., 1998; Richerol et al., 2008; Scott et al., 2009; Bringué and Rochon, 2012; Durantou et al., 2012), making the feature an attractive candidate for recent, high-resolution studies such as this, as compared to many other Arctic regions having generally lower sedimentation rates (e.g., Rochon and de Vernal, 1994; Ledu et al.,
2008). In fact, rates ranging from 220 to 320 cm/ka through the late Holocene were recently measured at the location of this study (Durantou et al., 2012). The trough holds between 30 and 50 m of Holocene sediment overlying late Pleistocene deglacial deposits (Blasco et al., 1990; Hill et al., 1991; Batchelor et al., 2013). High-resolution seismic reflection data reveal the continuous, parallel, and low-amplitude internai reflectors of this uppermost sequence, suggesting deposition primarily from the vertical accretion of sediments out of suspension (Elverh0i et al., 1980; Dowdeswell et al., 1997; Kleiber et al.,
2000; Batchelor et al., 2013). Signs of gentle progradation are also apparent, and support previous suggestions by Hill et al. (1991, 1996) of a preferential eastward infilling of the trough (Batchelor et al., 2013).
The postglacial sediment load of the Mackenzie River consists primarily of silt and
some clay with a minimal percentage of fine sand, in contrast to the significantly sandier
sediments of the Mackenzie Shelf (Blasco et al., 1990; Carson et al., 1998; Hill et al., 1996, 200 J; Barletta et al., 2008; Scott et al., 2009). Sedimentation offshore of the delta,
i.e. at depths greater than ::::; 10 m, occurs principally through the deposition of fine pat"ticles
out of suspension (Hill et al., 1991), and cores at these depths reveal sediment facies
consisting almost entirely of fine, bioturbated mud, breaking down into a silt/clay ratio of::::; 2 (e.g., Vilks et al., 1979; Pelletier, 1984; Hill et al., 2001; Richerol et al., 2008; Scott et al., 2009; Jerosch et al., 2012; Durantou et al., 2012). In general, postglacial sedimentation on much of the North American Arctic continental margin is dom inated by fine-grained,
magnetic remanence carriers such as magnetite and titanomagnetite (Bischof and Darby,
1997, 1999; Darby, 2003; Darby and Bischof, 2004; Stoner and St-Onge, 2007; Barletta et
al.,2008).
The Mackenzie River accounts for ;:::: 95% of sedimentation on the Beaufort Shelf,
though other significant contributions are derived from coastal erosion and several Yukon
ri vers (Hill et aL, 1991). Two features in particular, the highly erosive Herschel Island and
the Babbage River in northern Yukon, could provide minor additional sources of sediment
to the study area, and are especially close to site 680. Coastal erosion, though a sm ail
contribution to ove rail sedimentation by volume, accounts for the majority of sand and
gravel found on the Beaufort Shelf, and is also known to be the source of larger-grained
deposits on Herschel Island (Hill et aL, 1991; Lantuit and Pollard, 2008).
2.2. Hydrology and oceanography
The Mackenzie Delta is a vast, complex system of distributary channels extending
about 210 km from the mouth of the river and spanning a width of about 87 km (Lewis,
1988). It forms a shallow shelfroughly 120 km wide and 530 km long, with the Mackenzie
Trough carved along its western side (Carmack et al., 2004). The head of the Mackenzie
Trough lies about 80 km farther to the northwest form the lower delta plain, converging
gradually with the long pro-delta slope. The high rates of freshwater discharge (ranging
from 249 to 333 km3 annually), which fluctuate strong1y seasonally, contribute strongly to
the highly variable quality of surface circulation patterns near the delta (Macdonald et aL,
1998; Hill et al., 200]; Dittmar and Kattner, 2003). However, offshore of the delta other
Arctic circulation patterns play an increasingly dominant role. One of the more prominent
features in surface circulation in the Western Arctic is the Beaufort Oyre, an anticyclonic
gyre (dominated by westward flow) along the nOlihern edge of the Mackenzie and
Beaufort shelves (Pickart, 2004). Beneath the Beaufort Oyre, halocline waters flow a10ng
the continental margin from the Pacific Ocean in Beaufort Undercurrent, which is
generally cyclonic (dominated by eastward flow) but known to reverse its direction
(Carmack and Macdonald, 2002; Pickart, 2004). Sedimentation on the continental shelf
largely occurs through the transport of fine particles in suspension in the Mackenzie
along-shore east-northeastward flow and another by a westward flow toward the
Mackenzie Trough (Harper and Penland, 1982; Hill et al., 1991; Carmack and Macdonald,
2002; Macdonald et al., 2002; Doraxan et al., 2012). These currents grow weaker with depth, but on the outer shelf, i.e. at depths > 60 m, a stronger current regime is again observed due to the added influence of another easterly current, possibly an extension of
the Beaufort Undercurrent from the Alaskan shelf (Aagaard, 1984; Hill et al., 1991;
Pickart, 2004). This contribution, along with that of wind-driven surface currents tlowing
in the same direction, results in a net eastward drift of the Mackenzie River's plume of
suspended sediment, and therefore a preferential eastward infilling of sediment in the
Trough (Hill et al., 1991, 1996, 2001; Carmack and Macdonald, 2002). These deposition
patterns are readily apparent in the bathymetry of the area, with the Trough axis visibly
curving from northwest to north (Figure 1).
3. Materials and Methods 3.1 Coring sites
Calypso square (CASQ) sediment cores, large gravit y cores with a 25 x 25 cm
cross-section, along with corresponding box cores, were recovered from two sites, STN 690 and STN 680, in the Mackenzie River Trough (Figure 1). Sampling was conducted in August 2009 aboard the Canadian research ice-breaker the CCGS Amundsen during a leg of the international Malina project. Two nearby coring sites were selected based on previous
studies demonstrating the high rates of sedimentation in the Mackenzie Trough (e.g., Hill
et al., 1991; Macdonald et al., 1998; Rochon et al., 2003). Core 690 was located at 69.490
N, 137.940
W, about 100 km from the mouth of the Mackenzie River in a water depth of
54 m, and was 3.60 m long. Core 680, at 69.610
N, l38.21 0 W, was located about 17 km
farther down the trough in a water depth of 122 m, and was 5.06 m long (Table 1, Figure
1). The Calypso square (CASQ) corers are advantageous for recent studies such as this
one, as they result in minimal sediment perturbation and are designed to preserve the
sediment-water interface, permitting the comparison of results with historical and
observational records.
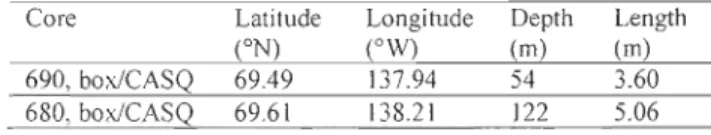
Table 1: Core locations.
Core Latitude Longitude Depth Length
(ON) (OW) (m) (m)
690, boxiCASQ 69.49 \37.94 54 3.60
680, boxiCASQ 69.6\ 138.21 \22 5.06
3.2 Physical Analysis
U-channels (u-shaped plastic liners of 2 x 2 cm cross-section) were subsampled from
the upper 4.00 m of the station 680 CASQ core on deck. The lowermost section of the
CASQ was unrecoverable due to implosion of the CASQ liner. U-channels were also sampled from push cores sampled at sea in both companion box cores. In the Paleo and Environmental Magnetism Laboratory at the Institut des sciences de la mer de Rimouski
(ISMER), u-channels were subsampled from the individual sections of the station 690 CASQ core, except for the top 10 cm which were too soupy.
Ail u-channels were analyzed at 1 cm intervals with a GEOTEK Multi-Sensor Core Logger (MS CL) at ISMER enabling the continuous and simultaneous measurement of
X-ray fluorescence using an Innov-X XRF spectrometer, diffuse spectral reflectance using a Konika Minolta model here color spectrophotometer, and low-field volumetrie magnetic
susceptibility using a Barlington MS2E point sensor (e.g., St-Onge et al., 2007). X-ray fluorescence measures the bulk concentration of individual elements, some of which,
namely iron and titanium, can reflect variations in the overall magnetic mineralogy of the sediment. Even though the XRF results are presented as ppm, only relative changes are
used as an absolute calibration of the sediment was not performed. Diffuse spectral
reflectance can also offer insight on changes in mineralogy, with redness in particular
evidencing the presence of hematite. It is recorded in the CIE 1979 (L *, a*, b*) color space, where the parameter L
*
represents a scale from black (0) to diffuse whiteCl 00)
, a* from green (-) to red (+), and b* from blue (-) to yellow (+) (e.g. St-Onge et al., 2007).Finally, low-field magnetic susceptibility (kLF) primarily reflects changes in the
concentration of ferrimagnetic minerais, as weil as to a lesser degree the size of magnetic
grains, with larger grains resulting in a greater kLF (e.g., Stoner and St-Onge, 2007). U-channels were also photographed by a high-resolution digital camera mounted on the MSCL. Some MSCL data measured from core 680 should be treated with caution, as many
thin cracks occurred in the sediment due to drying, sorne large enough to produce gaps in discrete measurements su ch as kLF and color.
In order to identify sedimentary structures and check for signs of possible core
deformation, all the u-channels were then passed through a Computerized Axial Tomography Scan (CAT -scan) at the Institut national de la recherche scientifique, Centre
Eau Terre Environnement (INRS-ETE) in Québec City, Canada. This allows imaging at a
cross-sectional resolution of 0.23 mm and an axial resolution of 0.6 mm. Additionally, the
computed tomography (CT) numbers, which serve as a measure of bulk density (St-Onge et al., 2007; Fortin et al., 2003), were extracted from the images at 1 mm intervals.
3.3 Radiocarbon Analysis
On board, 8 pelecypod shells or shell fragments and three mixed benthic-planktonic foraminifera sampi es were collected from the station 680 CASQ core for radiocarbon
analysis. The samples were sent to the Center for Applied Isotope Studies at the University of Georgia in Athens, Georgia and the Radiochronology Laboratory, Centre d'études
nordiques at Université Laval in Quebec City, Quebec for Accelerator Mass Spectroscopy (AMS) radiocarbon dating (Table 2).
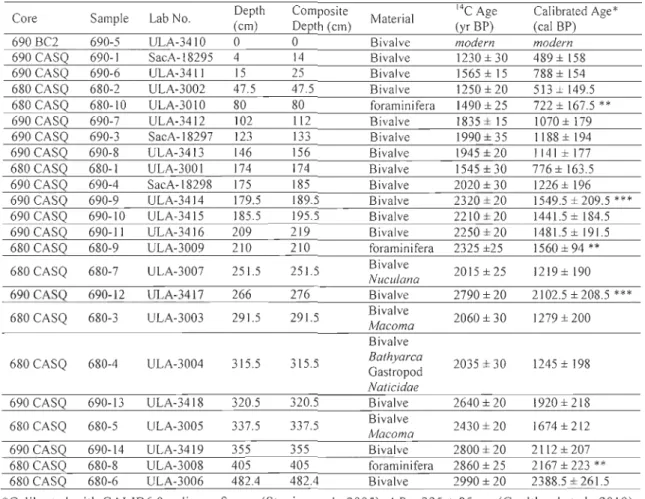
Table 2: Radiocarbon dates from cores 690 and 680.
Core Sample Lab No. Depth Composite Material 14C Age Calibrated Age*
(cm) DeQth (cm) (yr BP) (cal BP)
690 BC2 690-5 ULA-341O 0 0 Bivalve modern modern
690 CASQ 690-1 SacA-18295 4 14 Bivalve 1230 ± 30 489 ± 158
690 CASQ 690-6 ULA-3411 15 25 Bivalve 1565±15 788 ± 154
680 CASQ 680-2 ULA-3002 47.5 47.5 Bivalve 1250 ± 20 513 ± 149.5 680 CASQ 680-10 ULA-3010 80 80 foraminifera 1490 ± 25 722 ± 167.5 ** 690 CASQ 690-7 ULA-3412 102 112 Bivalve 1835± 15 1070 ± 179
690 CASQ 690-3 SacA-18297 123 133 Bivalve 1990±35 1188 ± 194
690 CASQ 690-8 ULA-3413 146 156 Bivalve 1945 ± 20 1141±177
680 CASQ 680-1 ULA-3001 174 174 Bivalve 1545 ± 30 776 ± 163.5
690 CASQ 690-4 SacA-18298 175 185 Bivalve 2020 ± 30 1226 ± 196 690 CASQ 690-9 ULA-3414 179.5 189.5 Bivalve 2320 ± 20 1549.5±209.5 ***
690 CASQ 690-10 ULA-3415 185.5 195.5 Bivalve 2210 ± 20 1441.5 ± 184.5
690 CASQ 690-11 ULA-3416 209 219 Bivalve 2250 ± 20 1481.5 ± 191.5
680 CASQ 680-9 ULA-3009 210 210 foraminifera 2325 ±25 1560±94** 680 CASQ 680-7 ULA-3007 251.5 251.5 Bivalve Nuculana 2015 ± 25 1219± 190
690 CASg 690-12 ULA-3417 266 276 Bivalve 2790 ± 20 2102.5 ± 208.5 *** 680 CASQ 680-3 ULA-3003 291.5 291.5 Bivalve 2060 ± 30 1279± 200
Macoma
Bivalve
680 CASQ 680-4 ULA-3004 315.5 315.5 Bathyarca 2035 ± 30 1245 ± 198 Gastropod
Naticidae
690 CASQ 690-13 ULA-3418 320.5 320.5 Bivalve 2640 ± 20 1920 ± 218 680 CASQ 680-5 ULA-3005 337.5 337.5 Bivalve 2430 ±20 1674±212
Macoma
690 CASQ 690-14 ULA-3419 355 355 Bivalve 2800 ± 20 2112 ± 207 680 CASQ 680-8 ULA-3008 405 405 foraminifera 2860 ± 25 2167 ± 223 **
680 CASQ 680-6 ULA-3006 482.4 482.4 Bivalve 2990 ± 20 2388.5 ± 261.5 *Calibrated with CALTB6.0 online software (Stuvier et al., 2005), !'J.R = 335 ± 85 yrs (Coulthard et al., 2010). **Mixed foram ages excluded from the final age model (see text for details).
***Bivalve ages excluded from the final age model (see text for details).
In the laboratory, during the sampling of u-channels from the station 690 core, 9
pelecypod shells were collected and analyzed at the KECK Carbon Cycle AMS Facility at
the University of California in Trvine, California and once again the Radiochronology Laboratory at Université Laval (Table 2). One shell collected from the surface of the station 690 box core was confirmed to be modern (i.e., containing bomb 14C), and the top
u-channels, subsampled on deck from the station 690 CASQ core by Guillaume Massé
(Laboratoire d'océanographie et du climat à Paris) in collaboration with the Malina project, and analyzed at the Laboratoire de Mesure du Carbone 14, Commissariat à l'énergie atomique et aux énergies alternatives (CEA) in Saclay, France (Table 2).
Radiocarbon analyses were conducted using Libby's half life (i.e. 5568 yrs) and corrected for isotopic fractionation after the convention established by Stuiver and Polach
(1977). All dates were reported initially in conventional radiocarbon age (14C yrs BP), and
converted to calibrated years (cal BP) using the online calibration software CALIB6.0
developed by Stuiver et al. (2005) with the Marine09.14c dataset. A !1R value of335
+
85yrs was used for calibration, based on a regional marine reservoir offset measured for the
nearby Northwest Canadian Arctic archipelago by Coulthard et al. (2010).
3.4 Rock Magnetic and Paleomagnetic Analysis
Paleomagnetic data were measured along all u-channels at ISMER USlllg a 2G
Enterprises cryogenic magnetometer. Because of the edge effect associated with the
response function of the cryogenic magnetometer pick-up coils (Weeks et al., 1993), the upper and lowermost 5 cm of data from each u-channel were excluded from the ends of
u-channels at section breaks to eliminate the edge effects effectuated by this response
function, except for cases where on-deck sampling allowed for overlap, as for the bulk of core 680 (Figure 2). In addition, because of this edge effect, the thin cracks seen in core 680 did not cause a problem in the magnetic measurements as they did in the MSCL
measurements. Data were omitted due to edge effects in core 690 from 157 to 166 cm and from 260 to 269 cm. The first 15 cm of box core data were merged with the CASQ record to account for the fact that the top 10 cm of the CASQ was too soupy to effectively sample. The only data which had to be excluded due to edge effect in core 680 are from 8 to 17 cm, since other u-channels were overlapped by 10 cm during sampling.
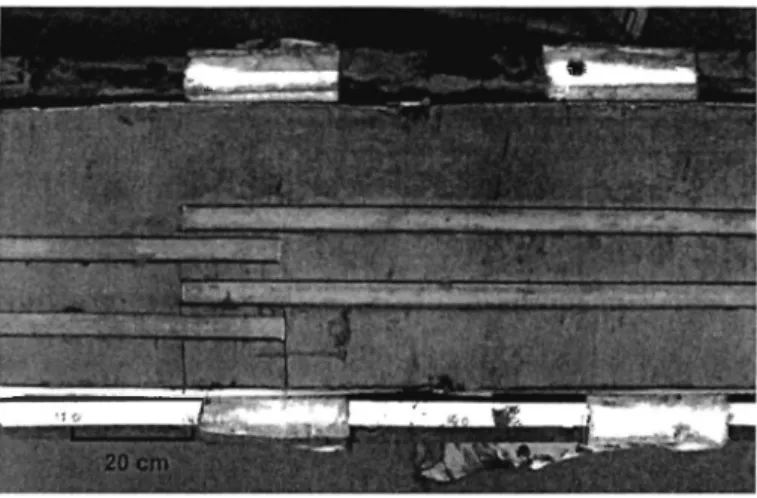
Figure 2: Subsampling of u-channels
from an open CASQ core on the deck of
the CCGS Amundsen; u-channels in core
680 were overlapped by at least 10 cm in
order to avoid the 1055 of paleomagnetic
data due to the 4.5 cm smoothing
function of the magnetometer.
The natural remanent magnetization (NRM) was determined by applying stepwise alternating field (AF) demagnetization at peak fields increasing [rom 0 to 80 mT in 5 mT increments and measuring after each step. Data for demagnetization steps between 20 and 60 mT were selected to represent the characteristic remanent magnetization (ChRM), excluding components representing any possible viscous remanent magnetization (VRM). Incl ination and declination were calculated over the characteristic range, as weIl as maximum angular deviation (MAD), a measure of the precision of the magnetization vector at any one step relative to the geometry of the overall magnetization, using the Mazaud (2005) software, which employs a principal component analysis (PCA) routine using a least-square line fitting technique (Kirschvink, 1980). Also computed is the median destructive field (MDF), the demagnetizing peak field needed to reduce the initial magnetic remanence by half.
After measuring the NRM, an anhysteretic remanent magnetization (ARM) was induced using a peak AF of 100 mT and a 0.05 mT direct current (DC) biasing field, and
subsequently stepwise demagnetized and measured following the same procedure as for the NRM. Next, an isothermal remanent magnetization (lRM) was imparted using a pulse magnetizer module to induce a 0.3 T DC pulse field. After demagnetization and
measurement, again along the same increments as the NRM and ARM, a saturated
isothermal remanent magnetization (SIRM) was imparted by a 0.95 T DC pulse field. The SIRM was demagnetized and measured at 0, 10, 30, and 50 mT.
granulometry, were measured under a field (and equal back-field) applied in 10 mT increments to a maximum of 1 T using a Princeton Measurements Corp alternating gradient force magnetometer (AGM) at ISMER. Sediment for these measurements was sampled from the section breaks of each core (at the top or bottom of each u-channel), yielding 10 measurements for core 690 and 8 measurements for core 680, including box core samples. Magnetic hysteresis parameters, saturation magnetization (Ms), saturation remanence (Mrs), coercivity (He), and coercivity of remanence (Her), were derived from the measured hysteresis and IRM backfield curves.
The NRM acquired by the sediment as weil as the various laboratory-induced magnetizations are, like magnetic susceptibility, strongly dependent upon the concentration of magnetic minerais present. However, different types of magnetization activate different assemblages of magnetic grains, and can therefore be normalized by other magnetic parameters to characterize magnetic grain size and mineralogy (e.g., King et al., 1982; Thompson and Oldfield, 1986; Brachfeld and Banerjee, 2000; Maher et al. 1999; Stoner and St-Onge, 2007). When normalized by a concentration-dependent magnetic parameter, commonly a laboratory-induced magnetization (ARM, IRM, or SIRM), the NRM can be regarded as a proxy of relative paleointensity (RPI) independent of changes in the concentration of magnelic grains duwncore (e.g., Tauxe, 1993; Valet, 2003; Stoner and St -Onge, 2007). The stability of the NRM can be ascertained by \ow MAD values; values < 5° are generally considered to represent a high precision directional record (Stoner and S t-Onge, 2007). Variations in magnetic grain size can be deduced by normalizing SIRM by kLF , which is inversely proportional to the size of the remanence carrying grains and most
sensitive among particles > 10 )..lm (Thompson and Oldfield, 1986). Anhysteretic susceptibility (kARM : the ARM divided by the intensity of the DC biasing field applied during magnetization) normalized by kLF also varies inversely with magnetic grain size if the magnetic assemblage consists predominantly of magnetite; this ratio is more sensitive to particles between 1 and 10 )..lm (King et al., 1982). Information about magnetic mineralogy can be obtained by normalizing IRM by SIRM (the pseudo S-ratio); values close to 1 indicate primarily low-coercivity remanence carriers su ch as magnetite (e.g., St -Onge et aL, 2003). The MDF is also dependent on mean coercivity, with values between ;::::;
20 and 40 mT corresponding to magnetite (Dankers, 1981). In cases of uniform mineralogy, variations in MDF are inversely proportional to magnetic grain size as
coercivity decreases for coarser grains (Dankers, 1981).
3.5 Grain Size Analysis
Ail u-channels were sampled at 5 cm intervals for physical grain slze analysis,
wh ich, together with magnetic grain size, can offer information on the consistency of river discharge and wh ether multiple sediment sources or currents influencing deposition are at play. Samples were added to a Calgon® electrolytic solution, sodium hexametaphosphate, and mixed for about 3 hours using an in-house rotator, prior to being disaggregated in an ultrasonic bath for 90 seconds in preparation for analysis. Sieving was not necessary for
any samples, since the sediment was visibly composed of fine silt with minimal amounts of
very fine sand, ail particles being smaller than 2 mm in diameter. Grain size and sorting
measurements were conducted on the disaggregated samples using a Beckman-Coulter
LS-13320 laser diffractometer (0.04-2000 !lm). The grain size data were processed using the
GRADISTA T software for analyzing sediment parameters (Blott and Pye, 2001).
4. Results
4.1 Lithology and Stratigraphy
Both cores consist almost entirely of homogeneous fine-grained mud, uniformly
gray-brown to olive-gray c1ayey silt. Using the geometric method of moments function in the GRADISTAT software, the sediment in both cores was c1assified as muddy fine silt,
and was poorly sorted for the majority of both cores (2
:s
cr:s
4) (Blott and Pye, 2001).Noticeably poorer sOl1ing is observed throughout core 680, with average values of cr
=
3.32, as compared to the core 690 average of cr
=
2.82. Core 680 also had a slightly largeraverage grain size, while core 690 exhibits uniformly fine sediment throughout the core,
with the exception of the 20 cm mark, where a significant proportion of silt and a very small am ou nt of sand are also observed (Figure 3). In core 690 a uniform, dark gray color
dark gray (2.5Y 311), to gray (2.5Y 511), and finally returning to dark gray (2.5Y 4/1) near the base of the core. No distinct boundaries or rapid changes are visually observable, and furthermore the minor variations could be attributable to dried and altered condition of the
core 680 u-channels, which made the judgment of color challenging. The overall uniformity of color in both cores is supported by spectrophotometry profiles. For example, changes in L
*
vary between ::::; 2S and 4S for both cores, with the exception of large and small outlying values representing anomalous features such as shell fragments and cracksin the record. Traces ofbiotrubation are apparent regularly throughout both cores. No well-defined lithologic unit boundaries are apparent in either core (Figure 3). These color, grain size, and sorting characteristics are typical of Arctic postglacial shelf deposits (e.g., Syvitski, 1991; Darby et al., 2006; Keigwin et al., 2006), and the lithology is consistent
with other post-glacial sediment cores sampled in the southern Beaufort Sea (e.g., Rochon et al., 2003; Barletta et al., 2008; Lisé-Pronovost et al., 2009; Bringué et al., 2012; Durantou et al., 2012).
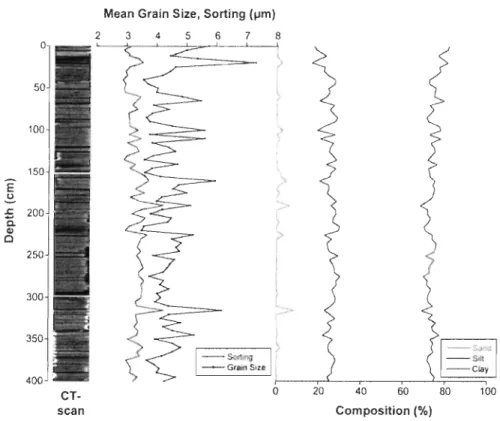
A)
50 100 E 150 ~ .r:: Q. ~ 200 0 250 300 350 CT-scanMean Grain Size, Sorting (~m) 2 3 4 5 6 7 8
- Sorting
- Mean Grain Size
o 20
~
~-clay
40 60 80 100
Composition (%)