Science Arts & Métiers (SAM)
is an open access repository that collects the work of Arts et Métiers Institute of Technology researchers and makes it freely available over the web where possible.
This is an author-deposited version published in: https://sam.ensam.eu Handle ID: .http://hdl.handle.net/10985/15787
To cite this version :
Shahin EBRAHIMI, Elsa ANGELINI, Laurent GAJNY, Wafa SKALLI - Lumbar spine posterior corner detection in X-rays using Haar-based features - In: 2016 IEEE 13th International Symposium on Biomedical Imaging (ISBI), République tchèque, 2016-04-13 - 2016 IEEE 13th International Symposium on Biomedical Imaging (ISBI) - 2016
Any correspondence concerning this service should be sent to the repository Administrator : [email protected]
LUMBAR SPINE POSTERIOR CORNER DETECTION IN X-RAYS USING
HAAR-BASED FEATURES
Shahin Ebrahimi
1, Elsa Angelini
1,2,3, Laurent Gajny
1, Wafa Skalli
11 Arts et Métiers ParisTech, LBM/Institut de Biomécanique Humaine Georges Charpak, France 2 LTCI, CNRS, Telecom ParisTech, Université Paris-Saclay, France
3 Department of Biomedical Engineering, Columbia University, New York, NY, USA
ABSTRACT
3D reconstruction of the spine using biplanar X-rays remains approximate and requires human-machine interactions to adjust the position of important features such as vertebral corners and endplates. The purpose of this study is to develop a method to extract automatically the accurate position of lumbar vertebrae posterior corners. In the proposed method we select corner point candidates from an initial edge map. A dedicated pipeline is designed to discard unwanted candidates, involving polyline simplification, curvature thresholding and multiscale Haar filtering. Ultimately, we use a priori knowledge derived from an initial 3D spine model to define search areas and select the final corner points. The framework was tested on 21 biplanar X-rays from scoliotic children. Corner positions are compared with manual selections by two experts. The results report a localization accuracy between 0.7 and 1.6 mm, comparable to manual expert variability.
Index Terms— Spine, 3D reconstruction, Biplanar X-rays, Haar filtering, Corner detection, Vertebrae
segmentation
1. INTRODUCTION
An accurate 3D modeling of the vertebral column is a prerequisite for numerous diagnostic and therapeutic orthopedic procedures. In the case of moderate scoliosis of young patients for instance, minor errors in determining the geometric parameters calculated from a 3D model of the spine might change the diagnosis and associated treatment strategy.
These days, MRI, CT, and biplanar X-ray imaging can be used to image the spine. Biplanar X-ray is the modality of reference to study children with scoliosis due to its unique capability to image the patient in weight-bearing standing position and its significant low radiation dose. There are various methods that provide solutions to generate a 3D model of the spine from two orthogonal radiographic planes [1], [2]. These methods are robust to the limited image quality of low-dose X-rays. Nevertheless, because of image noise and occlusions, the accuracy of the reconstruction is not optimal and requires manual adjustment. As post processing, localized image analysis and keypoint detection could help the final adjustment of such model.
Keypoint identification and object detection in medical imaging are active fields of research for applications such as early diagnosis of disease, computational anatomy or registration of shape models. The literature on vertebrae detection and segmentation is also very rich. Various approaches have used the Generalized Hough Transform (GHT) [3], [4] as a vertebrae detection tool due to its robustness to noise and occlusion. Zheng et al. [5] applied the GHT on digital fluoroscopy sequences of patients suffering from low back pain to localize and track the spine in motion. Klinder et al. [6] utilized GHT for vertebra detection in CT images. Zhang et al. [2] developed a deformation tolerant GHT for 3D reconstruction of the spine from biplanar radiographs. However, processing biplanar X-rays of pathological cases remains challenging. Machine learning approaches based on adaptive boosting (AdaBoost) have also been developed, such as in the work of Huang et al. [7] in which an
improved AdaBoost learning algorithm was designed for vertebrae detection in MR images. Major et al. [8] used Haar-based features, image derivatives and histograms to coarsely detect and identify the intervertebral disks from CT images. Although AdaBoost is a strong tool for object detection, its performance could be affected by occlusions and object deformities in 2D X-ray planes.
Regarding spine keypoint detection, Al-Arif et al. [9] developed a Hough Forest-based corner detection method for cervical spine X-rays, which was reported to be sensitive to target shape variations. To initialize a shape model, Benjelloun et al. [10] introduced a method to extract the anterior corners of cervical spine from sagittal X-rays based on Harris corner detectors. Harris corner detectors are known to be sensitive to image resolution, noise, and involve parameters complex to adjust. To localize cervical vertebrae in sagittal radiographs, Lecron et al. [11] applied a support vector machine (SVM) classifier to learn SIFT features [12], which is difficult to extend to pathological subjects.
Among this rich literature, very few work validated their framework on pathological cases [2], [6], [8], [9] and none on pathological lumbar vertebrae, which are more challenging than cervical ones, due to the presence of more overlying tissues.
In this work we are interested in detecting posterior corner points of lumbar vertebrae on sagittal X-rays. These posterior corners provide practical information regarding the spinal curve, intervertebral spaces, alongside the vertebral body heights and orientations. We avoid supervised learning on normal shapes as we target scoliotic cases. We also target robustness to noise, genericity of parameters and control of the type of corner being selected as illustrated in Fig. 2-E.
To this end, a corner extraction algorithm is designed which benefits from geometrical features of a corner as well as the intensity information of its neighboring region. We assume that we have a 3D model initially fitted on the sagittal image but with imprecise positioning of the posterior vertebrae corners.
2. MATERIAL AND METHOD
The proposed method can be broken down into three main steps: (1) preprocessing to obtain a selective edge map within the region of interest; (2) Multiscale Haar filtering to select a limited number of candidate corner points; and (3) exploitation of a priori knowledge obtained from the initially reconstructed shape model to finely identify individual posterior vertebrae corners.
Biplanar sagittal images were acquired with the EOS© micro-dose X-ray system (EOS Imaging, Paris, France), with a pixel size of 0.1794×0.1794 mm.
2.1. Image enhancement and edge detection
In the proposed algorithm, points of interest are first selected among points of an edge map obtained with a Canny edge filter. Some image enhancement is required prior to edge map computation to limit the number of candidate points. First, the original image (Fig. 3-A) is downsampled by a factor of two. To reduce image noise, limit image dynamic range, and fill some boundary gaps along the desired vertebrae endplates, 5×5 Wiener and median filters are applied successively. Overall, these steps are useful in reducing the complexity of the edge map, and consequently limiting the number of candidate points. Finally, Contrast Limited Adaptive Histogram Equalization (CLAHE) [13] is applied to improve the local contrast (Fig. 3-B). In our work the CLAHE tiles (20×28 pixels) are empirically sized to be proportional to one third of the lumbar vertebra average size in the filtered images. Canny edge detection is applied on the enhanced sagittal X-rays (Fig. 3-C).
2.2. Candidate point extraction
Potential corner point candidates are sought among edge map points. To this end, after tracing the object boundaries and converting the edge map into sets of connected edge segments (Fig. 3-D) we perform the following processing exploiting both geometrical and intensity properties of the candidate points and their surrounding area:
2.2.1. Polyline simplification
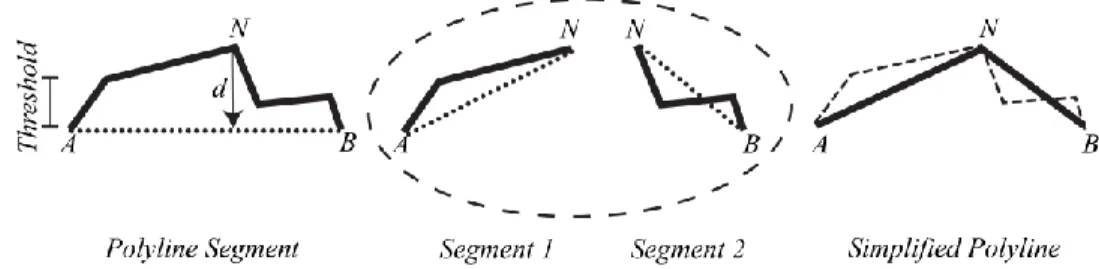
Polyline simplification [14] is used to eliminate small variations along segments and reduce the number of points following the principle illustrated in Fig. 1.
Fig. 1. Polyline simplification of the initial set of segments.
In this work we choose a distance threshold 𝑇 = 1 pixel for the distance d. We could significantly reduce the number of contour elements with a higher threshold value, but by choosing 𝑇 = 1 the original number of contour points is almost reduced by half, while preserving corner points, as illustrated in Fig. 3-D.
2.2.2. Curvature filtering
To specifically reduce the number of candidate corner points, we compute the analytical curvature [15] 𝑘 of the edge segments at each point. Points with a normalized curvature 𝑘 outside the empirical range 0.01 < 𝑘 < 0.25 are discarded. This way we are able to preserve candidates even in rounded corners where 𝑘 is small, while discarding many of the unwanted candidates (Fig. 3-E).
2.2.3. Corner detection using Haar-based features
To make our final selection among corner candidate points, we propose to use Haar-based features illustrated in Fig. 2-A and Fig. 2-C. Haar response values 𝑅 are computed on each of the remaining corner candidates, calculating three local intensity differences. As the Haar filters are robust to a range of rotations between 0° and 25°, we used two sets of Haar configurations to cover all 2D orientations of corner patterns. Response values for each of the six Haar filters are detailed in Equation (1):
𝑅𝑋1= 𝐵1− 𝐴1 𝑅𝑌1= 𝐷1− 𝐶1 𝑅𝑍1 = (𝐸1+ 𝐹1) − (𝐺1+ 𝐻1) 𝑅𝑋2 = 𝐵2− 𝐴2 𝑅𝑌2= 𝐷2− 𝐶2 𝑅𝑍2= (𝐸2+ 𝐹2) − (𝐺2+ 𝐻2) (1)
We use the product of the three filtering outputs as indicator of the presence of a corner: 𝑅𝑋𝑌𝑍𝑖 = 𝑅𝑋𝑖× 𝑅𝑌𝑖×
𝑅𝑍𝑖 (𝑖 = 1,2). The sign of this product reveals if we are dealing with a concave or a convex corner as they always
Fig. 2. Haar filtering on corners. Haar filters in (A) target the 0° corner orientation in (B) and Haar filters in (C) target the 45° corner orientation of (D). (E) Concave and convex corner types.
To handle the large variety of vertebral contour shapes, we apply the Haar filters at multiple scales. The final values 𝑅𝑋𝑌𝑍1 and 𝑅𝑋𝑌𝑍2 are the maximum of the responses over all scales. Normalization is done by dividing the
responses by the maximum over all scales and candidates. Points are considered true corners according to two selection criteria: if both 𝑅𝑋𝑌𝑍𝑖 responses are positive, then the candidate is kept if the maximum is above
𝑇𝐻𝑋𝑌𝑍𝑖 = 0.07; if the two responses have opposite signs (i.e. more ambiguity in orientation), then the candidate is
preserved if the positive response is above 𝑇𝐻𝑋𝑌𝑍𝑖 = 0.33 and the sum of 𝑅𝑋𝑌𝑍𝑖 responses is positive.
Thresholding is applied separately on the two rotation configurations (0° and 45°). Three scales are used in this work, with doubling of the filter size at each scale. The final filter size is set to twice the average size of the intervertebral space in filtered images (~18 pixels), so that centering the filter on a posterior corner would not lead to an overlap with the neighboring corners territories.
In Fig. 3-G we illustrate the output of the proposed multiscale Haar filtering and thresholding. The yellow points come from the thresholding of the 𝑅𝑋𝑌𝑍1 (0° rotation) and the black points come from the thresholding of
the 𝑅𝑋𝑌𝑍2 (45° rotation). Corners with an orientation between 0° and 45° or in visually complex areas can be
selected by both sets of filters.
The results indicate that most of the unwanted points inside and outside the vertebrae are eliminated and that true corner points are well preserved on the posterior side. Candidate corners on the anterior side are mostly removed after thresholding, and would require a different thresholding setup.
Fig. 3. Processing pipeline: (A) original image; (B) enhanced image of the lumbar area; (C) canny edge map; (D. up) the original edge map of L3; (D. down) after polyline simplification with T=1 pixel; (E) remaining corner candidate points after curvature thresholding; (F) candidate corner points from curvature filtering (magenta) and final corner points selected via Haar-filtering,
and thresholding from 0o (yellow) and 45° (black) orientations of the filters; (G) final candidate corner points only; (H) final posterior corner points (red) and the input points (blue).
2.3. Final selection with a priori anatomical knowledge
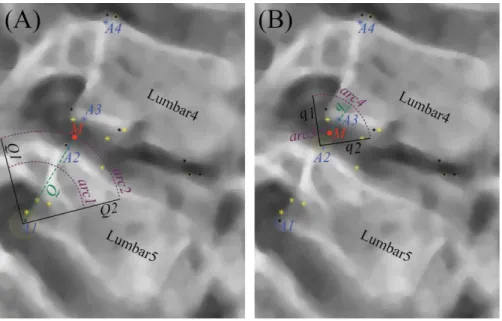
To pick the final posterior corners, we use a priori knowledge given by the initial 3D model. For each vertebra, we are able to back-project the midpoint of the posterior wall at the level of the lower and upper endplates, defining the set of input points {Ai} illustrated in Fig. 4. We define search areas around these input points and make our final selection as follows.
2.3.1. Defining the search areas
As illustrated in Fig. 4, we start from vertebra L5 and the input point A1 that has the particularity to have been manually defined by the user to generate the initial 3D shape model and is therefore assumed to be the correct lower posterior corner of L5. Segments Q1 and Q2 define a 90° sector around the segment Q connecting the input points A1 and A2 of L5. The search area for the L5 upper posterior corner is defined between two arcs denoted
arc1 and arc2. The radius of arc1 is set to 0.75 × 𝑑𝑖𝑠𝑡(A1,A2) so that it is smaller than the approximate height of the vertebra; The radius of arc2 is equal to the distance 𝑑𝑖𝑠𝑡(A1,M) where M is the approximate midpoint of intervertebral space. The point M is detected as the midpoint of the segment along the profile A2-A3 that connects the points with intensity 𝐼 = 1.25 × 𝐼𝑚 where 𝐼𝑚 is the minimum image intensity along the profile.
Fig. 4. Defining the search areas around initial corner points.
Moving upward, search areas are built iteratively for lower and upper posterior corners of L4 to L1 using segments Q that connect the current posterior corner to the next input point Ai above it as illustrated in Fig. 4-B.
2.3.2. Final corner selection
After defining search areas for each initial posterior corner points, we update their position applying the following strategy: First, if the search area contains multiple candidates, we keep the two having the highest 𝑅𝑋𝑌𝑍1 or 𝑅𝑋𝑌𝑍2
response values. In this case to increase our chance of selecting the best corner position, we compute the response value of the midpoint between the two candidates and select as the final corner, the one that has the highest response value. Second, if there is no corner candidate within the search area, we select the final corner point based on a priori knowledge regarding the approximate height and orientation of the corresponding vertebra or intervertebral space and replicate this information from the last updated corner point. Results of the overall iterative corner selection process are illustrated in Fig. 3-H.
2.4. Data and measures
We evaluated our method on EOS© biplanar X-ray images from 21 scoliotic children (between 9 and 16 years old, average=12.7) having a Cobb angle between 11° to 28° (average=16.7°). This dataset was acquired within a protocol approved by an ethical committee with written consent from participants. Focusing on the lumbar spine we processed 105 vertebrae. All tests were carried out with the same parameters and no patient-specific tuning was performed. We compare our results with manual corner detection obtained by two different operators familiar with the X-ray manual processing. Operators were asked to repeat the task three times for the 21 test images. We evaluate the precision of corner positions in coordinates X and Y separately. For each coordinate we measure the reproducibility deviation 𝑆𝑅 (See [16]) as √𝑆𝑟2+ 𝑆𝐿2 where 𝑆𝑟2 and 𝑆𝐿2 are inter and intra operator variances
respectively.
3. RESULTS
Fig. 5 illustrates the reproducibility graph of manual measures for the Y-coordinate of the L3 inferior posterior corners. The mean corresponds to the average of the 6 manual measures and the black stars indicate the measures provided by our method.
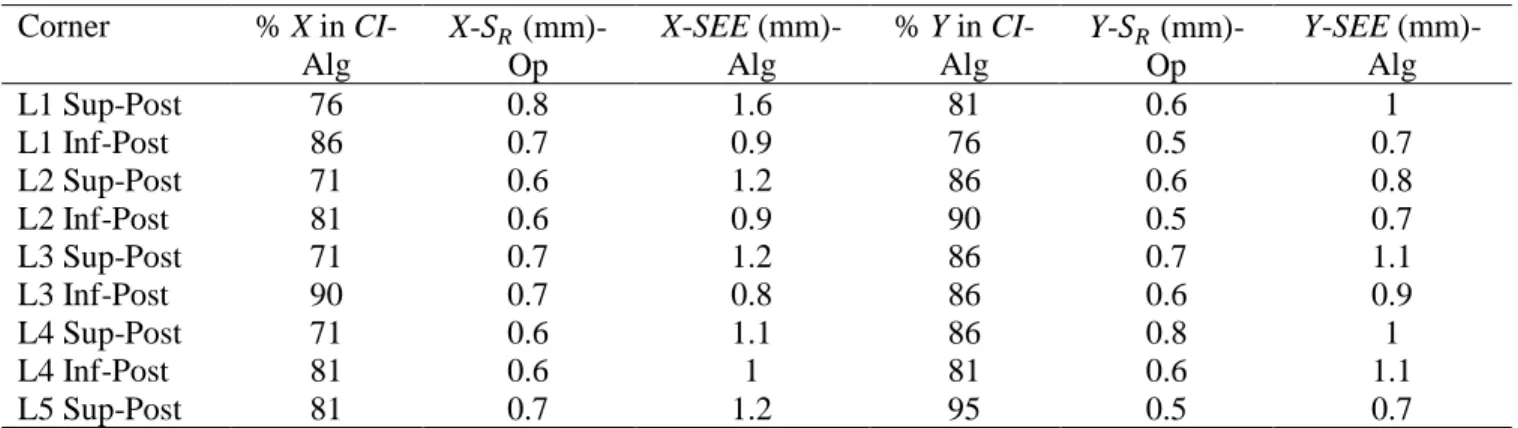
Few subjects generated outlier measures that have a deviation larger than the confidence interval (CI) width defined as: 𝑚𝑒𝑎𝑛 ± 2 × 𝑆𝑅 (the blue lines in the graph). Table 1 gives an overview on the automated corner
localization performance on the 9 posterior corner positions being updated. Additionally, we computed the standard error of the estimate (SEE) of the measures from our method as an indication of the accuracy of the proposed algorithm. The results show a SEE ranging from 0.7 mm to 1.6 mm for X and Y. The reproducibility graphs indicate that the outliers remain very close to the desired points. Outliers are encountered on most pathological cases and positions with strong occlusions at the corner of interest.
Among the literature that focus on cervical spine corner detection, only Al-Arif et al. [9] included pathological cases and analyzed the accuracy of their corner localization. They report average median and mean errors of 3.05 mm and 4.45 mm respectively, and identified anatomical variations as the main source of errors.
Fig. 5. Y-coordinate deviation from the mean for the L3 inferior posterior corners for each of the 21 subjects. The outcome from the algorithm is also reported with black stars.
4. CONCLUSION
We proposed an approach for posterior corner detection on X-ray images of the lumbar spine, where the structures of interest are subject to image noise, scale variations and rotation. The proposed approach exploits geometrical features of a corner point, and local intensity information to discriminate corners from initial edge point candidates. Two thresholds over the Haar filter response values are the only parameters that need to be fixed. It was set empirically in this study to detect posterior vertebrae corners, and will need to be adjusted to handle anterior corners as well. We demonstrated that our approach reaches a higher precision for corner point positioning than state of the art found in the literature for cervical vertebrae. In addition we demonstrated the robustness of our approach to handle scoliotic cases.
5. ACKNOWLEDGMENTS
The authors are grateful to the ParisTech BiomecAM chair program on subject-specific musculoskeletal modelling for funding, and particularly Société Générale and COVEA.
6. REFERENCES
[1] L. Humbert, J. A. De Guise, B. Aubert, B. Godbout, and W. Skalli, "3D reconstruction of the spine from biplanar X-rays using parametric models based on transversal and longitudinal inferences," Med. Eng. Phys., vol. 31, no. 6, pp. 681–687, 2009.
[2] J. Zhang et al., "3-D Reconstruction of the Spine From Biplanar Radiographs Based on Contour Matching Using the Hough Transform," IEEE Trans. Biomed. Eng., vol. 60, no. 7, pp. 1954-1964, 2013.
[3] D. H. Ballard, "Generalizing the Hough transform to detect arbitrary shapes," Pattern Recognition, vol. 13, pp. 111-122, 1981.
[4] A. S. Aguado, M. S. Nixon, and E. M. Montiel, "Parameterizing arbitrary shapes via Fourier descriptors for evidence-gathering extraction," Comput. Vision Image Understanding, vol. 69, No. 2, pp. 202-221, 1998. [5] Y. Zheng, M. S. Nixon, and R. Allen, "Automated Segmentation of Lumbar Vertebrae in Digital
Videofluoroscopic Images," IEEE Trans. Med. Imag., vol. 23, no. 1, pp. 45-52, 2004.
[6] T. Klinder et al., "Automated model-based vertebra detection, identification, and segmentation in CT
Table 1: Percentage (%) of the outcomes within the confidence interval (CI), reproducibility standard deviation of manual measurements (𝑺𝑹) and standard error of estimate (SEE) for X-Y coordinates on posterior corner points. (Alg=Algorithm
outcome; Op=Manual measurement).
Corner % X in CI-Alg X-𝑆𝑅 (mm)-Op X-SEE (mm)-Alg % Y in CI-Alg Y-𝑆𝑅 (mm)-Op Y-SEE (mm)-Alg L1 Sup-Post 76 0.8 1.6 81 0.6 1 L1 Inf-Post 86 0.7 0.9 76 0.5 0.7 L2 Sup-Post 71 0.6 1.2 86 0.6 0.8 L2 Inf-Post 81 0.6 0.9 90 0.5 0.7 L3 Sup-Post 71 0.7 1.2 86 0.7 1.1 L3 Inf-Post 90 0.7 0.8 86 0.6 0.9 L4 Sup-Post 71 0.6 1.1 86 0.8 1 L4 Inf-Post 81 0.6 1 81 0.6 1.1 L5 Sup-Post 81 0.7 1.2 95 0.5 0.7
images," Med. Image Anal., vol. 13, no. 3, pp. 471-482, 2009.
[7] S. H. Huang, Y. H. Chu, S. H. Lai, and C. L. Novak, "Learning-Based Vertebra Detection and Iterative Normalized-Cut Segmentation for Spinal MRI," IEEE Trans. Med. Imag., vol. 28, no. 10, pp. 1595-1605, 2009.
[8] D. Major, J. Hladůvka, F. Schulze, and K. Bühler, "Automated landmarking and labeling of fully and partially scanned spinal columns in CT images," Med. Image Anal., vol. 17, no. 8, pp. 1151–1163, 2013. [9] S. M. Al-Arif, M. Asad, K. Knapp, M. Gundry, and G. G. Slabaugh, "Hough Forest-based Corner Detection
for Cervical Spine Radiographs," in Proceedings of the 19th Conference on Medical Image Understanding
and Analysis, Lincoln, 2015, pp. 183-188.
[10] M. Benjelloun, S. Mahmoudi, and F. Lecron, "A Framework of Vertebra Segmentation Using the Active Shape Model-Based Approach," Int. J. Biomed. Imaging, vol. 2011, p. 14 pages, 2011.
[11] F. Lecron, M. Benjelloun, and S. Mahmoudi, "Fully Automatic Vertebra Detection in X-Ray Images Based on Multi-Class SVM," in Proceedings of the SPIE medical imag., vol. 8314, San Diego, 2012.
[12] D. G. Lowe, "Distinctive Image Features from Scale-Invarient Keypoints," Int. J. Comput. Vision, vol. 60, no. 2, pp. 91-110, 2004.
[13] K. Zuiderveld, "Contrast Limited Adaptive Histogram Equalization," in Graphic Gems IV. San Diego, CA, USA: Academic Press Professional, 1994, pp. 474-485.
[14] D. H. Douglas and T. K. Peucker, "Algorithms for the reduction of the number of points required to represent a digitized line or its caricature," Cartographica: The International Journal for Geographic Information and
Geovisualization, vol. 10, no. 2, pp. 112-122, 1973.
[15] M. Marji, "On the Detection of Dominant Points on Digital Planar Curves," Graduate School, Wayne State University, Michigan, Detroit, USA, PhD thesis 2003.