Technology researchers and makes it freely available over the web where possible.
This is an author-deposited version published in: https://sam.ensam.eu Handle ID: .http://hdl.handle.net/10985/9662
To cite this version :
Yasmine BOUMENIR, Abdelmajid KADRI, Nadège SUIRE, Corinne MURY, Evelyne KLINGER -Impact of simulated low vision on perception and action - International Journal of Child Health and Human Development (IJCHD) - Vol. 7, n°4, p.441-450 - 2014
Any correspondence concerning this service should be sent to the repository Administrator : [email protected]
.
Impact of simulated low vision on perception and action
Yasmine Boumenir, PhD
1,
Abdelmajid Kadri, PhD
1,
Nadège Suire, OT
2,
Corinne Mury, CO
2,
and Evelyne Klinger, Eng, PhD
∗11Arts et Métiers ParisTech – LAMPA EA1427, Angers-Laval, France
2Institut des Hauts Thébaudières, Vertou, France
∗ Correspondance: Dr Evelyne Klinger, Arts et Métiers
ParisTech, 4 rue de l’ermitage, 53000 Laval, France. E- mail: [email protected].
Abstract
Most of us do not know how a visually impaired person perceives and acts within the environment in everyday life. In this context, an experimental study was conducted using a virtual reality simulation in which sighted people were immersed in low vision situations: blurred vision, tunnel vision, and central scotoma. After a brief familiarization procedure with a virtual reality tool called “SENSIVISE”, which includes a virtual apartment, 24 adults had to explore two rooms through low vision simulation or full vision (as a control group) to identify their location, and then were instructed to find particular targets. Perception and actions performances were measured in terms of time needed to answer questions related to visual perception, and distances between the participants’ body and the screen. The results show that low vision simulation impairs perception among sighted people. It was expressed by a statistically significant effect of lower times needed to execute tasks compared to the control condition. Consequently, the sighted individuals realized how it is difficult to perceive and move when vision is limited.
Keywords: Visual impairment, perception, behavioral
assessment, virtual reality, simulation
Introduction
According to the World Health Organization, visual impairment affects nearly 246 million worldwide, including 1.7 million in France with congenital or late visual deficiency (1). With an aging population, the number of visually impaired people is growing rapidly due to multiple visual affections such as Age- related Macular Degeneration (AMD), glaucoma, or cataract. AMD often results in vision loss to the central 15–20 deg of the visual field (i.e. central scotoma) with more or less blurred peripheral vision, and frequently afflicts both eyes (2). Loss in central vision due to central scotoma prevents vision of details, colors, contrasts, relief. Peripheral field loss (tunnel vision), that may results from glaucoma, is a severe constriction of the peripheral field leaving only
the central 5-10 deg of the field functional with more or less blurred central vision. People have a fragmented view of their environment and must take the time to scan with their eyes to redial the space around them. People can not anticipate obstacles, judge distances, or collect information from different sources at the same time. However, when people do not present such central or peripheral loss, reduction of visual acuity most often results from blurred vision, often in a bilateral way. Several studies have shown that these forms of low vision can present in varying degrees, in which the available visual field (central vs. peripheral visual-field loss), residual visual acuity, and level of contrast sensitivity are all factors that play a role in influencing cognitive performance (3) and behavior in daily life. For example, AMD is associated with decreased quality of life (4) and depression (5).
Indeed, when visually impaired people cannot control their daily interactions with the surrounding world, disruption within the family, social and professional networks can occur. If we know that visually impaired persons are unable to watch the television from a normal viewing distance due to their blurred vision (requiring them to watch from a closer distance), then most important information about their difficulties and needs may remain unclear. And therefore, providing them assistance represents a challenge to family or sighted individuals who may lack knowledge about their relative’s visual impairment and the impact of visual acuity and central or peripheral vision on functional abilities. But this lack of knowledge may lead the family members to overprotect (6). Conversely, when family members understand the nature of the vision impairment and its consequences, the independence of their visually impaired relatives can be enhanced (7). In addition, studies on teachers’ attitudes towards students with disabilities showed a significant impact on the educational experience (8).
The use of Virtual Reality (VR) for rehabilitation and learning in the public health domain had already given positive results (9, 10), notably in the field of visual impairment (11, 12). These studies have focused on spatial perception and orientation among blind people, in order to evaluate and improve their performances. VR has also been used to enhance
awareness of educators or caregivers about difficulties met by people with disabilities in daily life (13-15).
In this global context we developed the SENSIVISE VR-based tool that proposes the simulation of three graduated visual impairments (central scotoma, blurred and tunnel vision) whose levels have been defined by professionals in low vision at the Institut des Hauts Thébaudières. The tool allows sighted users to navigate and interact within a virtual environment (VE) that includes an apartment with several rooms, and to experiment whilst experiencing the difficulties of visually impaired people during activities of daily life. The SENSIVISE tool proposes adaptations of the virtual environment (VE) in order to facilitate the understanding of the space and of the tasks.
The objectives of this study were to examine: 1) the impact of visual impairment simulation on perceptions in a VE; 2) the relevance of the adaptations of the VE to improve perception.
Methods
This study involved 24 sighted participants (12 M and 12F); all are volunteers recruited by a call for volunteers posted to schools and the university library of Laval, France. Their ages ranged between 18 and 74 years (35 ± 13.8). The study was conducted in accordance with the tenet of the Declaration of Helsinki and all participants signed a consent form.
Material
SENSIVISE is a VR-based application which was designed to inform and raise awareness about low vision. It simulates the entrance of a building and an apartment with a living room, a bedroom, a bathroom and a kitchen with a laundry room. All rooms are equipped with 3D objects and furniture, as in a real apartment. Using shaders (i.e. a computer program used to calculate rendering effects on graphics hardware), SENSIVISE implements the simulation of three visual impairments (scotoma, blurred and tubular vision) which were chosen by the professionals of the Institute of Hauts Thébaudières according to their expertise in low vision. They also
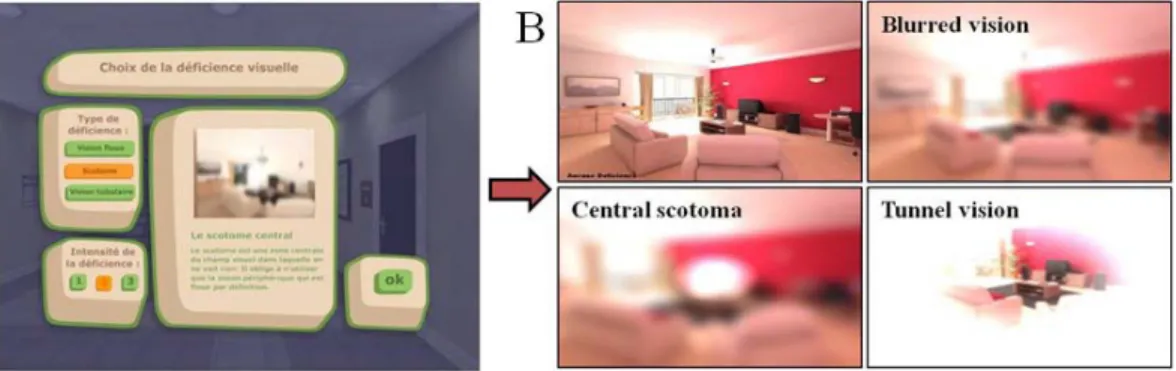
defined three levels of difficulty for each impairment: increasing the blurred aspect, decreasing the size of the tunnel, increasing the size of the scotoma (see Figure 1). In order to improve perception of places and objects, SENSIVISE also allows environmental adaptation options such as contrast (e.g. between the walls and the bath), light (e.g. dim light in the bedroom), objects choice (wrong versus right alarm clock in the bedroom) (see Figure 2). Finally, SENSIVISE introduces games such as finding items and putting them in a correct order. During this VR-
based game, participants are asked to collect pair of objects. The purpose is to show that putting the objects at the right place is very important for visually impaired people, and that looking for objects can become a difficult activity.
When participants interact with SENSIVISE, at first they choose the type and the level of low vision simulation from a menu (Fig. 1a). They thenenter the virtual world using the keyboard and the mouse, and interact with the objects using the mouse.
Figure 1. A snapshot of the virtual environment fonctionalities. (A) Through a menu, users can choose form and intensity of low vision displayed (on the left); and concurrently inform about the selected form (on the right); (B) results of the simulations; Control condition and Blurred vision on the left and right top respectively; central Scotoma and Tunnel vision down left and right respectively.
Figure 2. A snapshot of rooms before and after adaptations; light adjustment in the bedroom; right top; and contrast in the bathroom, middle; alarm clock adaptation, right down.
Experimental design
In order to reach our objectives, four groups were tested corresponding to the control and the three low vision simulated conditions: blurred vision, central scotoma and tunnel vision. Two-rooms, the bedroom and bathroom, were chosen for the tests according to a predefined scenario. Participants had to follow three steps: 1) a pre-test, 2) a test and 3) a post-test. In the first step, participants had to answer to a brief questionnaire (Q1) about how they rated themselves as users of computer (keyboard and mouse) according
to the following definitions: “beginner”, “expert” and “intermediate”; and if they had prior knowledge about low vision. Then they had to carry out a familiarization procedure with the tool, without any low vision simulation. The testing phase involved the execution of the scenario in each room, through one of the low vision conditions, and was followed by a short questionnaire (Q2). The experiment was completed by a third questionnaire (Q3 post-test) related to self-assessment on the use of the VR-based tool “SENSIVISE” (see Table 1).
Table 1. The experimental design: P: Participant; Questionnaires (Q1, Q2, Q3); Low vision conditions (LV1, LV2)
Pre-test Test Post-test
P : Q1 Scenario 1 P : Q2 Scenario 2 P : Q2 P : Q3
Landing Room1 Room2
LV1 LV2
Procedure
SENSIVISE application was displayed on a 22 inch screen which was located at 35 cm from the edge of the desk. The participants sat on a chair in front of the screen, with a mouse and a keyboard on the desk. The evaluator sat behind the participant with a keyboard and a mouse also connected to the application in order to select conditions and adaptations during the test. In addition, the evaluator used a laptop in order to fill out an online questionnaire created for this experiment.
18 participants (out of 24) experiment with each of the three visually impaired conditions in both the bedroom and the bathroom. Tests were alternated between the participants in order to obtain six individuals in each condition at the end of the experiment. The six remaining participants followed the same scenario but in a control condition without any simulation of visual impairment. The test took one hour and each participant was tested individually and only once.
The experiment started with the familiarization step (pre-test) at the first floor of the VE in order to get familiar with the use of the keyboard to navigate and of the mouse to look up, down and around (i.e. head movements). Then the test step took place in the apartment, at the entrance of each room (bedroom and bathroom) in a visual impaired condition. The
participant had to follow the predefined scenario which was explained by the evaluator: visual exploration followed by exploration through action while moving inside the room. During the course of the test, participants had to answer to some questions.
In the visual exploration step, participants had 15 seconds to indicate which room they were in (Question 1) by exploring the space with head movements. If beyond that time participants did not give a right answer, the evaluator activated adaptations: lighting at first, substituted by contrast if the answer was still incorrect, and finally both together.
In the exploration through action step, participants had 60 seconds to perform the requested task while moving inside the room. In the bedroom, participants had to find the alarm clock that was on a shelf near the bed (Question 2). Once in front of it, they were asked to read the time (Question 3). If participants were unable to read the time displayed on the alarm clock, two adaptations were tested: change in lighting and then another type of alarm clock. In the bathroom, participants had to navigate to reach the table near the sink and to list all the objects that they perceived on it (Question 2). Adaptations were activated when participants were unable to see all the objects: color contrasts. Then a game was performed, without time-limitation or adaptations, in which the
participants had to put in order identical objects by clicking on the objects with the mouse (Question 3).
At the end of each tested room, participants were asked to answer the post-test questionnaire (Q3) about how they perceived the VE, how they interacted, their feeling about low vision and more generally about SENSIVISE.
Data analysis
Visual and interactive explorations were performed to assess: 1) the impact of visual impairment simulation on perception; 2) the relevance of the adaptations on perception improvement.
The impact of visual impairment simulation on perception was determined by comparing qualitative and quantitative parameters between low vision conditions and the control condition. These parameters include: responses to questions, time of response, or behavior assessed by the distance between the participant and the screen. Except for the game, response time was collected only for the good answers (less than or equal to 15 seconds for the visual exploration and60 seconds for exploration through action). The time of response was the time elapsed between the end of the formulated question by the assessor and the response made by the participant. The statistical analyses were done using a non-parametric method of Kruskal-Wallis and the significant difference between conditions was analyzed using the Wilcoxon test.
Results
Results presented in this section were collected among 24 subjects, 6 in each of the tested conditions. Data from the two sessions for each low vision condition were compared to the control condition. As visual exploration is common to both test rooms, data were analyzed together. Data from exploration through action are presented separately for the bedroom and for the bathroom.
According to Questionnaire 1,75% of the participants consider themselves as expert users of computer (keyboard and mouse) and 50% declared to be familiar with low vision in a general way.
Impact of visual impairment simulation
on perception
Visual exploration
Individual performance was documented by the number of good answers and the times needed by the participants to answer questions related to the visual exploration session. These data were recorded and analyzed for each study group (Table 2). In the bedroom, all participants of the four groups were able to give the right answer. Participants from the tunnel vision group were the longest to answer. In the bathroom, only three subjects of the blurred vision group gave good answers against 6 in the other groups.
The Kruskal Wallis test comparisons between the control condition with each of the low vision conditions revealed a statistically significant effects (Pvalue = 0.012). A post-hoc analysis realized by the Wilcoxon test revealed that this statistically significant effect concern only the participants from the tunnel vision group (T) in the bedroom (W= 3, Pvalue= 0.009) and participants from the blurred (W= 0, Pvalue= 0.016) and tunnel vision (W= 0,
Pvalue= 0.003) groups in the bathroom (see Table 2). The distance between the participant and the screen was also analyzed (Figure 3, in the bathroom). Compared to the participants from the control condition, participants from blurred vision and central scotoma condition were closer to the screen. The Wilcoxon test revealed a significant difference between participants from the control and blurred vision conditions (W=33, Pvalue= 0.013).
Exploration through action
In the bedroom: Participants were asked to reach the
alarm clock by walking through the VE in one of the selected conditions. All participants from the control and blurred vision condition reach the alarm clock, against five participants from the central scotoma and tunnel vision groups (Table 3). The Wilcoxon test revealed significant differences between participants from the control and the blurred groups and between the control and the central scotoma groups. Participants from the blurred vision and central scotoma group took longest to reach the alarm clock compared to the other groups.
Table 2. Performances in the visual exploration step. Means, Standard deviations, and test of Wilcoxon values (w and p) on the recorded data for participants in low vision simulated conditions and controls 6 individuals in each condition Control
condition (C) Blurred vision (B) Central scotoma (S) Tunnel vision (T) Bedroom Age 29.3±8.3 36.2±11.6 45.2±7.8 32.8±21.1
Time duration (Sec.) Significant difference
1±0 1.8±1.2 1.8±1.2 7.3±5.2
Pvalue= 0.009*
Bathroom Age 29.3±8.3 42.2±20.5 30.5 ±13.3 41.5±6.1
Number of good answers 6/6 3/6 6/6 6/6
Time duration (Sec.) Significant difference
1.1±0.4 10.6±5.1
Pvalue = 0.016*
1.8±2.0 8.5±5.2
Pvalue= 0.003* *P<0.05, significant difference between the control and the low vision group, using the non parametric Wilcoxon test.
Figure 3. Distances to the screen (Mean and standard deviations) reported for each group on the visual exploration step in the bathroom. Control condition (C), Blurred vision (B), central Scotoma (S), Tunnel vision (T).
In order to perform the next step of the procedure, the two participants who failed to reach the alarm clock belonging to the central scotoma and the tunnel vision groups were placed in front of the alarm clock after 60 seconds. All participants were asked to read the time on the clock. The results showed that, in case of low vision condition, only two participants, belonging to the tunnel vision group, were able to tell the exact time displayed on the alarm clock.
In the bathroom : Participants were asked to
reach the table near the sink to list all the objects they perceived. Participants had to list nine objects, perceived by the control group. Results show that none of the participants from the low vision groups was able to list them in full (Table 4). Comparisons between the control group and each low vision group revealed a statistical significant with Wilcoxon test (W= 36, Pvalue= 0.002*).
Table 3. Performances in the exploration through action, reach the alarm clock in the bedroom. Number of good answers and Mean times (seconds) with the Wilcoxon values
In the Bedroom Control condition
(C) Blurred vision (B) Central scotoma (S) Tunnel vision (T)
Number of good answers 6/6 6/6 5/6 5/6
Time duration (Sec.) Significant difference 8.3±3.67 27.3±22.1 Pvalue = 0.046* 50.8±13.1 Pvalue = 0.0068* 21.6±21.14
*P<0.05, significant difference between the control and the low vision group, using the non parametric Wilcoxon test.
Table 4. Performances in the exploration through action, list all the objects perceived in the bathroom. Mean number of items found and standard deviation
In the Bathroom Control condition
(C) Blurred vision (B) Central scotoma (S) Tunnel vision (T)
Number of items found 9.0±0.0 3.8±1.47 3.3±2.25 4.6±1.21
The game
During this step in the bathroom, participants had to put in order 5 pairs of identical objects by clicking on the objects with the mouse. Data from the game performed by each participant from the low vision conditions were compared to the control condition.
The Wilcoxon test gives significant differences between the control group and each low vision group
(see Table 5). All participants from the three low vision groups took more time to find and arrange the objects than participants from control group, especially participants from the blurred group and from the tunnel group. The distribution of these times duration is shown on figure 4.
Table 5. Performances in the game, putting in order 5 pairs of identical objects scattered in the bathroomMean time and standard deviation, recorded from the game in each test condition. Wilcoxon values
In the Bathroom Control condition
(C) Blurred vision (B) Central scotoma (S) Tunnel vision (T)
Time duration (Seconds) Significant difference 62.33±32.18 239.66±146.34 Pvalue = 0.004* 195±87.28 Pvalue = 0.006* 343±90.48 Pvalue = 0.002*
Figure 4. The game performance: Distribution of time duration to answer in each group: Control condition (C), Blurred vision (B), central Scotoma (S), Tunnel vision (T).
Relevance of adaptations
In order to attempt to improve perception, adaptations of the VE were presented to the participants who failed to give good answers. The adaptations were introduced one by one and then combined. During visual exploration, a reduction in the VE was sufficient to help the three participants from the blurred group who failed to give good answers when they had to recognize the bathroom.
During exploration through action, in the bedroom scene, with a dim light or a digital clock no participant was able to read the time in blurred vision or central scotoma. Conversely, 3 out of the 4 participants who were not able to read the time, succeeded after changing the clock. And then, the combination of the two adaptations helped the only person who failed in the group to read time. In the
bathroom scene, adding contrast helped two participants from the blurred vision group and one participant from each central scotoma and tunnel vision groups to find all items. In addition, light and contrast together allowed two participants from the tunnel vision group to list all the items.
Perception and navigation in SENSIVISE
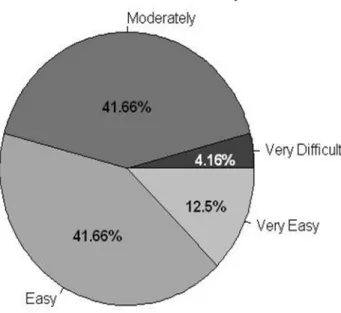
During the post-test, each participant had to evaluate on a graduated scale how he perceived the VE for each low vision condition. Except for the control condition group, all participants reported a very bad perception in the two rooms tested. And finally, on another graduated scale they rated how the navigation in the SENSIVISE application. The results are presented in Figure 5.Figure 5. Usability assessment of the SENSIVISE application for all participants.
Discussion
According to the study results, perceiving a VE in low vision condition is not easy. Although almost all participants answered correctly the questions about visual exploration, times were longer for participants in the low vision conditions compared to control condition. It seems that in the case of a global view,
when vision is blurred or when the peripheral visual field is limited, as in a tunnel vision, the observation times are longer and participants tend to be closer to the screen in particular with blurred vision. Moreover, when the task requires vision for detail, times are longer with central scotoma vision compared to the other groups. Studies in this direction have shown that
persons with central field loss have reduced acuity and contrast sensitivity, and read quite slowly (16).
The questionnaires chosen for this test were related to the SENSIVISE environment but also to the real needs of people with low vision in terms of lighting and contrast. Indeed, contrast sensitivity is crucial to many human visual activities including reading, object recognition and mobility. Studies have shown that reductions in contrast sensitivity (rather than visual acuity) are related to instability and falls in the elderly (17-20). In addition, contrast adaptation studies using both behavioral and neurophysiological methods support the view that the adaptation produces a functional benefit: Each of us perceives colors and contrasts differently, and in the context of visual impairment, this difference will increase based on the vision loss, that is to say that playing on the contrast of the environment can improve perception of contrasts (21).
The adjustments of light and contrast proposed in our study helped some participants from low vision conditions to give correct answers. Moreover, the digital clock as presented here in SENSIVISE only helped people with tunnel vision. Many models of alarm clock exist in SENSIVISE, but to compare our results with another experiment that is underway, this alarm clock was chosen.
At the end of the test, all participants stated that they had great difficulty in distinguishing shapes and objects and thus to reach the requested objectives, and felt lucky to see much better without low vision simulation. For the usability aspect of SENSIVISE, 4.2% of those tested reported having trouble using the keyboard and mouse to navigate in the VE.
As a result, the impact of the visual impairment of perceptions in a VE was achieved. However, the relevance of adaptations was not huge in this test and is currently tested in the context of visual impairment with visually impaired persons.
Information collected through SENSIVISE about how low vision can affect our cognitive abilities and our reaction times may help the sighted people to adopt a best attitude towards the visually impaired persons. Our future aim is to provide the SENSIVISE application for educational institutions and free internet access to inform about low vision and therefore increase the well being of all.
Conclusion
SENSIVISE is a VR-based application that was created to raise awareness about low vision, by providing information on some forms of visual impairment and on their impact on everyday tasks. Through this study, all participants understood the effort of perception and the difficulties of action when their vision was impaired. This study allowed us also to know the limits of the proposed adaptations of the VE for certain forms of visual impairment simulation. In future work, we will try to find out if the behavior of visually impaired persons interacting with SENSIVISE (in normal vision condition) is similar to that of sighted people interacting in impaired vision condition.
Acknowledgments
This work was carried out with the financial support of Laval authorities (Laval Agglomération and Conseil Général de la Mayenne). Authors would also like to thank Dassault Systèmes for financial support (Passion for Innovation Programme), ENOZONE and EMISSIVE for development support, and all volunteers who gave their consent to carry out the experiments presented in this study.
References
[1] Sander MS, Bournot MC, Lelièvre F, Tallec A, Chambet C, Corbé C, Gilbert P, Peretti C, Zanlonghi X. Les personnes ayant un handicap visuel. Les apports de l'enquête Handicaps - Incapacités - Dépendance. Etudes et Résultats, DREES 2005;416:1-12.
[2] Cheung S, Legge G. Functional and cortical adaptations to central vision loss. VisNeurosci 2005;22(2):187-201. [3] Merabet LB, Rizzo JF, Amedi A, Somers DC, Pascual-
Leone A. What blindness can tell us about seeing again: Merging neuroplasticity and neuroprostheses. Nat Rev Neurosci 2005;6(1):71-7.
[4] Brown MM, Brown GC, Sharma S, Landy J, Bakal J. Quality of life with visual acuity loss from diabetic retinopathy and age-related macular degeneration. Arch Ophthalmol 2002;120:481-4.
[5] Rovner BW, Casten RJ. Activity loss and depression in age-related macular degeneration. Am J Geriatr Psychiatry 2002;10:305-10.
[6] Ponchillia PE. Family services: Role of the center-based [14] Passig D. The impact of Virtual Reality on educators’ teaching professional. J Visual Impair Blindness
awareness of the cognitive experiences of a dyslectic 1984;78(3):97-100. student. Teachers College Record 2011;113(1):181-204. [7] Cimarolli VR, Boerner K. Social support and well-being [15] Pivik J, McComas J, Macfarlane I, Laflamme M. Using in adults who are visually impaired. J Visual Impairm
virtual reality to teach disability awareness. J Educ Blindness 2005;99(9):521-534. Comput Res 2002;26(2):203-18.
[8] Kenny M, Shevlin M, eds. Diversity at school: [16] Legge GE, Ross JA, Isenberg LM, LoMoy JM. Disability. In: Lodge A, Lynch K, eds. Diversity at
Psychophysics of reading clinical predictors of low-school. Dublin: Inst Public Administration, 2004:77-91. vision reading speed. Invest Ophthalmol Visual Sci [9] Klinger E, Weiss PL, Joseph PA. Virtual reality for
1992;33(3):677-87.
learning and rehabilitation. In: Didier JP, Bigand E, eds. [17] Turano K, Rubin GS, Herdman SJ, Chee E, Fried LP. Rethinking physical and rehabilitation medicine. Paris:
Visual stabilization of posture in the elderly: Fallers vs. Springer, 2010:203-21. nonfallers. Optom Vis Sci 1994;71:761-9.
[10] Rizzo AA, Buckwalter JG, Neumann U, Kesselman C, [18] Buckley J, Heasley K, Twigg, Elliott D. The effects of Thiebaux M. Basic issues in the application of virtual
blurred vision on the mechanics of landing during reality for the assessment and rehabilitation of cognitive
stepping down by the elderly. Gait Posture impairments and functional disabilities. Cyberpsychol
2005;21(1):65-71.
Behav 1998;1(1):59-78. [19] Lord SR, Menz HB. Visual contributions to postural [11] Sanchez J, Zuniga M. Evaluating the interaction of
stability in older adults. Gerontology 2000;46:306-10.
blind learners with audio-based virtual environments. [20] Lord SR, Clark RD, Webster IW. Visual acuity and Ann Rev CyberTher Telemed 2006;4:167-73. contrast sensitivity in relation to falls in an elderly [12] Lahav O. Using virtual environment to improve spatial
population. Age Ageing 1991;20:175-81.
perception by people who are blind. Cyberpsychol [21] Gardner JL, Sun P, Waggoner RA, Ueno K, Tanaka K, Behav 2006;9(2):174-7. Cheng K. Contrast adaptation and representation in [13] Klinger E, Geslin E, Shirai A, Richir S. HandiSim: A
human early visual cortex. Neuron 2005;47:607-20.
VR-based manual wheelchair with visual feedback and
physical simulation. Proceedings Cybertherapy 12,
Washington DC, 2007. Submitted: July 15, 2013. Revised: August 25, 2013. Accepted: September 08, 2013.