HAL Id: hal-01823864
https://hal.archives-ouvertes.fr/hal-01823864
Submitted on 15 Oct 2018
HAL is a multi-disciplinary open access archive for the deposit and dissemination of sci-entific research documents, whether they are pub-lished or not. The documents may come from teaching and research institutions in France or abroad, or from public or private research centers.
L’archive ouverte pluridisciplinaire HAL, est destinée au dépôt et à la diffusion de documents scientifiques de niveau recherche, publiés ou non, émanant des établissements d’enseignement et de recherche français ou étrangers, des laboratoires publics ou privés.
Mechanical cell disruption of Parachlorella kessleri
microalgae: Impact on lipid fraction composition
E. Clavijo Rivera, V. Montalescot, M. Viau, D. Drouin, P. Bourseau, M.
Frappart, C. Monteux, Estelle Couallier
To cite this version:
E. Clavijo Rivera, V. Montalescot, M. Viau, D. Drouin, P. Bourseau, et al.. Mechanical cell disruption of Parachlorella kessleri microalgae: Impact on lipid fraction composition. Bioresource Technology, Elsevier, 2018, 256, pp.77 - 85. �10.1016/j.biortech.2018.01.148�. �hal-01823864�
MECHANICAL CELL DISRUPTION OF PARACHLORELLA KESSLERI
MICROALGAE: IMPACT ON LIPID FRACTION COMPOSITION
E. Clavijo Riveraa, V. Montalescota, M. Viaub, D. Drouina, P. Bourseaua, M. Frapparta,
C. Monteuxc, E. Coualliera, *
a
CNRS, GEPEA, UMR 6144, Université Bretagne Loire, CRTT - 37 boulevard de l’Université - BP 406 - 44602 SAINT NAZAIRE Cedex, France
b INRA, BIA, UR 1268, rue de la Géraudière - BP 71627 - 44 316 Nantes Cedex 3, France
c CNRS, PPMD – SIMM, UMR 7615, 10 rue Vauquelin - 75231 PARIS Cedex 05, France
* estelle.couallier@univ-nantes.fr Abstract Samples of nitrogen-starved Parachlorella kessleri containing intact cells (IC), cells ground by bead milling (BM), and cells subjected to high-pressure cell disruption (HPD), together with their supernatants after centrifugation, were compared for granulometry and lipid profiles. The effects of disruption on the lipid profile and organisation were evaluated. The quantity of lipids available for extraction increased with disruption, and up to 81% could be recovered in supernatants after centrifugation, but a marked reorganization occurred. The proportion of amphiphilic free fatty acids and lysophosphatidylcholine increased during disruption due to their release or owing to lipid degradation by enzymes or physical conditions. This effect was more marked in HPD than in BM. Lipids contained in the aqueous phase, after disruption and centrifugation, were enriched in unsaturated fatty acids, BM leading to larger droplets than HPD. The larger liquid lipid droplet would be easier to recover in the following downstream processing. Key words Microalgae, bead milling, high-pressure cell disruption, lipids Highlights Disruption increases the quantity of extractable lipids. A large proportion of lipids is recovered in supernatants. Bead milling yields larger droplets, easier to recover.
The proportion of free fatty acids increases with disruption. Cell disruption increases the release of amphiphilic substances. Graphical abstract Information for the editor: Colors are needed for figures 2 to 6. Online only. Declarations of interest: none
1. I
NTRODUCTIONMicroalgae oil is of interest for animal feed and human food industries because of its high content in essential fatty acids (omega-3 and omega-6), comparable to levels in fish oils (Ryckebosch et al., 2014). More recently, a new application has emerged: these microorganisms can produce and accumulate large quantities of triglycerides (TAGs) that can be transformed into biodiesel. However, the recovery of the valuable fractions produced by the microalgae through a low-cost wet pathway necessitates the development of new combined processes integrating culture, harvesting, and several biorefining steps, among which cell disruption, centrifugation and molecular separation through membrane processes or solvent extraction. Among the numerous microalgae strains studied, some are remarkable for their high oil productivity. For instance, Botryococcus braunii, Schizochytrium sp., Nannochloropsis sp. and Parachlorella kessleri have been reported to produce lipids in quantities in the ranges 25–75%, 50–77%, 31–68%, and 41–65% w/w of dry weight respectively (Bigogno et al., 2002; Chisti, 2008; Taleb et al., 2015). Extensive research has demonstrated that TAGs accumulate significantly when microalgae are cultured under stressing conditions (nitrogen starvation, light intensity). This is observed for P. kessleri and Chlamydomonas reinhardtii, which increased their TAG production up to 7-fold and 15-fold respectively in response to nitrogen deprivation (Siaut et al., 2011; Taleb et al., 2016). P. kessleri also has characteristics of interest for photobioreactor cultivation and cellular pre-treatment for lipid extraction (high growth rate and low levels of biofilm and aggregate formation) (Fernandes et al., 2013; Taleb et al., 2016). This microalga was therefore selected in the present study to analyze the impact of disruption on lipid profile.
1.1. M
ICROALGAL LIPIDS AND CELL DISRUPTION METHODSThe recovery of the lipids contained inside the cells through a low-cost wet pathway involves cell disruption, centrifugation and molecular separation in membrane processes or by solvent extraction. Cell disruption methods include chemical and enzymatic processes, subcritical water extraction, and physical methods such as freezing, osmotic shock, ultrasonication, microwave treatment, pulsed electric field treatment, bead milling (BM), and high pressure cell disruption (HPD) (Grimi et al., 2014; Halim et al., 2012; Lee et al., 2017). The mechanical methods such as BM and HPD do not involve the use or elimination of solvents, or expensive biomass drying stages, and have high cell disruption efficiencies (Günerken et al., 2015). They are consequently of particular interest for microalgae biorefineries designed for large-scale production. Although these two techniques are less selective than chemical or enzymatic methods, improvements can still be made by adapting operating conditions (Dong et al., 2016; Günerken et al., 2015; Shene et al., 2015).
The use of BM and HPD for cell disruption produces complex mixtures that are very different from the initial intracellular organisation: before disruption, neutral lipids are stored in the cytoplasm of the cell as droplets surrounded by a film of phospholipids, and stabilised by substances such as structural proteins and tocopherols (Jayasinghe and Gray, 2014). After disruption, cell wall fragments and non-soluble compounds (like lipids) remain suspended in the aqueous phase containing the soluble components (proteins, salts, nucleic acids, polysaccharides, etc). The characteristics of lipids in this mixture are not well known, but optimising the processes for oil recovery from these complex mixtures depends strongly on the composition and organisation of the target substances. Disruption processes will affect the composition of the recoverable lipids: not only will TAGs be released from cells, but also polar lipids contained in cell membranes. In addition, during the disruption process, lipids may be transformed or degraded owing to local physical conditions (temperature, cavitation, shear rate), or by released enzymes (Balduyck et al., 2017). At the same time, the size of oil bodies contained initially in the cells may increase by coalescence, or may be reduced and dispersed (lipid droplets stabilised by polar components) in the aqueous phase by the shear forces. It is also possible for substances with high melting points, such as saturated fatty acids, to form solid particles and separate into a solid phase. Evaluating changes in lipid composition and organisation due to disruption is therefore essential in the development of biorefining processes.
1.2. L
IPID PROFILES FROM MICROALGAEMicroalgal lipids have been characterised mainly on undisrupted microalgae (Huang et al., 2013; Jones et al., 2012; Kobayashi et al., 2013; Mansour et al., 2005; Siaut et al., 2011). Lipid composition depends on the microorganism, the growing phase and the culture conditions. These photosynthetic microorganisms produce both neutral lipids (free fatty acids, mono-, di- and triacylglycerols) and polar lipids (phospho- and glycolipids). Some examples of lipid composition reported in the literature for some strains of microalgae are shown in Appendix. Total lipid and total fatty acid profiles In general, microalgae produce lipids containing fatty acids with chains ranging from 12 to 22 carbons and up to 6 unsaturations (Ahlgren et al., 1992; Becker, 1993; Cohen, 1999; Gunstone et al., 2007; Roleda et al., 2013; Vidyashankar et al., 2015). Growth period and nutrient depletion induce different proportions of total lipids, and also impact the ratio of saturated fatty acids (SFAs), monounsaturated fatty acids (MUFAs) and polyunsaturated fatty acids (PUFAs) (Angles et al., 2017; Becker, 1993; Jayasinghe and Gray, 2014). Intact cells of P. kessleri produce mainly palmitic acid C16:0, oleic acid C18:1n-9c and linolenic acid C18:3n-3 during the exponential
phase, but when deprived of nitrogen, the main synthesized FA was linoleic acid C18:2n-6c, and the amount of C16:0 was lower (Internal research GEPEA). Kobayashi et al., 2013 with P. kessleri and Přibyl et al., 2012, for Chlorella vulgaris identified the same fatty acids, but in different proportions. Neutral lipids Neutral lipids are produced by microalgae as energy reserve substances. TAGs and free fatty acids (FFAs) compose this fraction. Other minor compounds may also be present, such as monoglycerides (MAGs) and diglycerides (DAGs). Neutral lipid contents have been reported for many microalga species along with their fatty acid profiles. They represent 30–90% w/w of total lipids (Bigogno et al., 2002; Chen et al., 2007; Huang et al., 2013; Siaut et al., 2011). Polar lipids Polar lipids are compounds found mainly in microalgae cell membranes. They are typically made up of glycerides with two fatty acids and a phosphate group (phospholipids) or a saccharide (glycolipids). The proportion of glyco- and phospholipids ranges widely across species (Alonso et al., 1998; Becker, 1993; Chen et al., 2007). Becker, 1993 reviewed the polar lipid contents of 8 microalgal species: their glyco- and phospholipid contents ranged from 6% to 59% and from 10% to 53% w/w of total lipids respectively. Řezanka and Podojil, 1989 found that glycolipids of Parachlorella kessleri (cultured under heterotrophic conditions) were mainly composed of monogalactosyldiglyceride (MGDG) with C16:3-C18:3 and C18:2-C18:3 as the main fatty acids; the main component of the phospholipid fraction was phosphatidylcholine (PC) with C16:0-C16:1 and C18:3-C18:3 fatty acids. Disrupted microalgae Research on disrupted microalgae has essentially focused on determining their total lipid content and total fatty acid profile, and on the influence of extraction methods or disruption conditions on the yield of recovered lipids (Angles et al., 2017; Meullemiestre et al., 2016; Montalescot et al., 2015; Taleb et al., 2016; Viswanathan et al., 2012). (Balduyck et al., 2017), were the first to study the impact of cell disruption and wet storage on lipid composition for two strains (Nannochloropsis oculata and T-Isochrysis lutea). They highlighted lipid degradation by enzymes released after cell disruption. To our best knowledge, the composition and organisation of lipids after disruption of nitrogen-starved P. kessleri cultures and centrifuging have not yet been studied. These data are fundamental for optimising downstream processing, and for integrating BM or HPD as cell disruption methods in the whole process of microalgal lipid production.
In what follows, the granulometry and oil fraction composition of non-disrupted and disrupted cells and their supernatants after centrifugation are described for P. kessleri. Detailed composition of lipids in terms of total fatty acids (FAs), main compounds and fatty acids contained in the different lipid classes, namely TAGs, other neutral lipids (ONLs), glycolipids (GLs), and phospholipids (PLs) was determined in the different fractions. The effects of disruption on the organisation and composition of the resulting lipid fraction is analyzed.
2. M
ATERIALS AND METHODS2.1. M
ICROALGA STRAIN AND CULTUREParachlorella kessleri (strain 2229 UTEX) used for this study was produced in batch mode in a flat panel airlift photobioreactor (PBR) (6 L) at 25 ± 0.5 °C. The culture was homogenized by sterile air injection at the bottom of the PBR. A pH/temperature probe (Mettler Toledo SG 3253 sensor) monitored by the acquisition software LabVIEW recorded pH and temperature. The pH was regulated at 7 with CO2 bubbling, and constant light was provided by a LED array panel. A progressive nitrogen starvation protocol was run: the 6 L PBR was inoculated with 300 mL of inoculum grown on a modified Bold’s Basal culture medium (Pruvost et al., 2009). The PBR was then completed up to 1 L with the same culture medium, and the incident photon flux density PFD was set at 50 µmole photons.m-2.s-1 for 2 days to avoid stress due to high light intensity. The light intensity was then increased to 160 µmol photons.m-2.s-1 for 3 days. At the end of the 5th day the PBR was completed up to 5.8 L with a free nitrogen modified Bold’s Basal culture medium, and the incident PFD was set at 250 µmole photons.m-2.s-1. The aeration rate is fixed with the outlet vane to ensure a good culture suspension. Harvesting took place 12–14 days after the accumulation of lipids had reached a steady state. The harvested culture was then directly treated (disruption and centrifugation processes) and analysed.
2.2. C
ELL DISRUPTION AND CENTRIFUGATIONTwo distinct mechanical methods of cell disruption were used: high-pressure disruption (HPD) and bead milling (BM) as described previously by (Montalescot et al., 2015). For HPD, a high-pressure cell disrupter (TS series 2.2kW from Constant Systems Limited, Daventry Northants, UK) was used. In this device, samples are forced through a small nozzle 180 µm in diameter (at pressures ranging from 50 to 270 MPa), forming a jet that hits a target on a thermoregulated exchange surface at 3 °C. For the present experiments, 85% of cell disruption was obtained with a single pass at 100 MPa (HPD85) and 100% of cell disruption with a pressure of 200 MPa (HPD100).
For bead milling (BM), a Dyno®-mill multi lab from Willy A Bachofen AG (Muttenz, Switzerland) was used. Experiments were run in pendulum mode (Kwade & Schwedes 2007). Samples were pumped from an agitated feed tank to a 600 mL grinding chamber containing the grinding medium (1.30 mm glass beads, filling ratio of grinding media fixed to 0.75) at a flow rate of 200 mL/min and a rotation speed of 8 m.s-1. At the end of the first passage the suspension was recovered in a second tank and transferred to the first agitated tank to be repumped. For the present experiments, two disrupted biomasses were produced, one at 85% of cell disruption obtained after 3 passes through the grinding chamber (BM85), and a second one at 100% of cell disruption after 5 passes (BM100). Samples were then collected at the outlet when steady state was reached (which can be assumed after the flow of a volume of fluid equal to 3 times that of the grinding chamber for constant flow rate, temperature, pressure and concentrations) (Montalescot et al., 2015). Suspension outlet temperature was maintained at 20 °C with a cold glycerol fluid circulating in the cooling jacket of the grinding chamber. To measure the extent of P. kessleri disruption (Middelberg, 1995; Spiden et al., 2013a, 2013b) cells (fixed with 20 µL of Lugol’s iodine solution per mL of sample) were counted using a Malassez-type counting chamber. All the tests were performed in triplicate. The percentage of disintegrated cells Des (%) was calculated as described previously by (Montalescot et al., 2015), using Equation 1. Des % = 1 −𝑁! 𝑁! · 100 Eq. 1 with Nx, the number of intact cells remaining after destruction at a given pressure on the HP disrupter or at the end of a given pass on the bead mill, and N0 the number of intact cells before disruption. To obtain a cell-free supernatant for lipid analysis, cell culture after disruption was centrifuged on a Sorvall RC 6 plus Thermo Electron Corporation centrifuge at 12,100g for 20 min at 20 °C.
2.3. A
NALYSED SAMPLESAnalysed samples were obtained from four different batches of P. kessleri (B1, B2, B3 and B4). Samples consisted of the whole mixture containing (i) intact cells before grinding (IC), (ii) culture disrupted by BM or HPD at 85% or 100% disintegrated cells, and (iii) supernatant of disrupted samples obtained by centrifugation (Sup.BM or Sup.HPD). Table 1 summarises the type of samples analysed for each batch. Samples were stored at −20 °C before freeze-drying.
2.4. G
RANULOMETRYSize distributions of particles contained in all microalgae suspensions were determined by laser granulometry using a Horiba LA 960 instrument equipped with two light sources (a 650 nm red laser diode and a 405 nm blue LED), and a silicon photo diode detector with detection limits of 0.01 μm and 5000 μm. A refractive index (RI) of 1.45 (corresponding to the RI of microalgal cells) was used for undisrupted samples, and 1.47 (corresponding to the RI of colza oil) for disrupted samples and their supernatants.
2.5. C
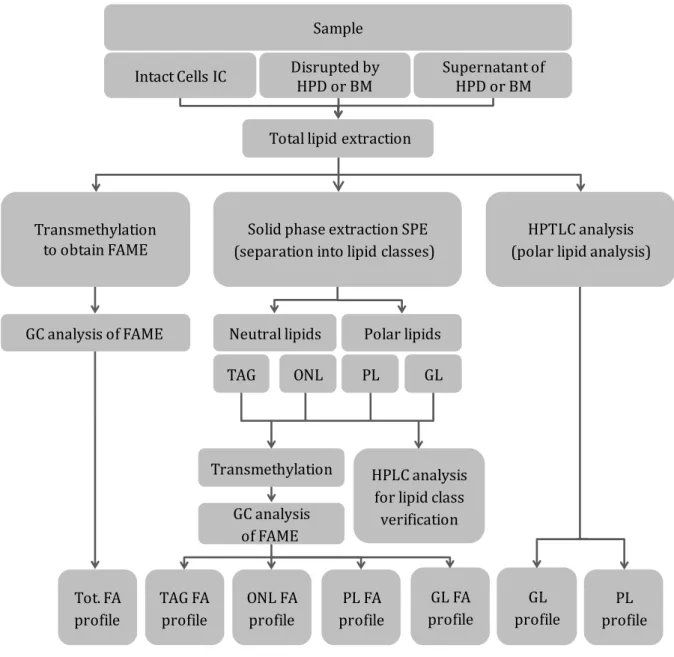
HEMICAL ANALYSESFigure 1 summarises the analyses performed to obtain neutral and polar lipid profiles from nitrogen-starved P. kessleri samples. Lipids from intact cells, and cultures disrupted by HPD or BM and their supernatants were extracted using Folch and Bligh-and-Dyer modified methods, with a mixture of CHCl3/MeOH (2:1, v/v) and 20 μL of dibutylhydroxytoluene (BHT) used as antioxidant, for 6 h on a shaker plate. The total lipid extract was (i) transmethylated, (ii) separated into lipid classes by solid phase extraction (SPE), or (iii) analysed by HPTLC. Fatty acid methyl esters (FAMEs) obtained by transmethylation of the total lipid extract or from the different lipid classes were analysed by gas chromatography (GC) to obtain the total fatty acid profile (Tot. FA profile) from samples, or the FA profile of all the different fractions: triglycerides (TAG FA profile), other neutral lipids (ONL FA profile), glycolipids (GL FA profile) and phospholipids (PL FA profile). HPLC analysis was performed to verify the fractions obtained by SPE. Additionally, HPTLC analysis was carried out to obtain the glyco- and phospholipid profile of the total lipid extract. For conciseness, the numerous methods are summarised here, but the interested reader will find full details in Appendix.
3. R
ESULTS ANDD
ISCUSSIONSamples containing intact cells (IC), cells disrupted by HPD or by BM and their supernatants from four different batches were characterised in terms of their granulometry and lipid profiles. The main results for each characterization method are presented in the following paragraphs, then a cross-analysis is proposed to highlight the main results on the lipid composition of the cultures in the different batches and the impact of disruption methods on the lipid composition.
3.1. G
ENERAL CHARACTERISTICS OF CULTURES:
TOTAL LIPID CONTENT(TL)
Figure 2 shows the percentages of total lipids contained in all the samples analysed relative to dry matter. The highest lipid content in disrupted cells was obtained for batch B3 (1.31g/L), followed by batch B2 (1.10g/L). Disrupted samples from batches B1 and B4 presented lower quantities, between 0.16 and 0.78 g/L. We see that significant variations were obtained between
the different cultures. These differences are probably related to the physiological state of cells, which may cause variations in their response to nitrogen starvation. Tetraselmis subcordiformis, Nannochloropsis oculata and Pavlova viridis cultured in nitrogen-depleted media had a lipid production of between 30 to 36%dw (Huang et al., 2013), similar to the results obtained for IC(B3). On comparing different types of samples from the same batch (IC, disrupted cells and supernatant), the results reveal that disruption increased the quantity of lipids available for extraction, and that a large proportion of lipids was recovered in supernatants by centrifugation. For instance, sample HPD85 from batch B3 yielded twice as much lipids as intact cells (IC). 81% of the lipids released by disruption was recovered in the supernatant after centrifugation; the remainder was trapped in the pellet. For all cases, the recovery ratio of lipids in supernatants was between 80–92% of those present in disrupted samples. No significant differences were observed on comparing samples of cells disrupted by the same method at different percentages of disintegration (85% and 100%). For instance, from batch B2, samples Sup.BM85 and Sup.BM100 showed the same proportion of lipids, i.e. 30%dw of total lipids, and samples Sup.HPD85 and Sup.HPD100, 36–38%dw of total lipids. It would be expected that 100% disintegration of the cells would yield to higher lipid liberation in the supernatant. The potential difference may be hidden by the analytical method uncertainty. Some of the intact cells may be partially damaged and liberate some lipids, or on the contrary a fraction of the lipids from the disrupted cells may not be fully accessible for analysis. On comparing total lipid content of samples from batch B4, disrupted by different methods but at the same percentage of disintegration (BM85 and HPD85), no differences were observed. However, for all batches, slightly higher oil content was observed in supernatants of HPD samples.
3.2. P
ARTICLE SIZE DISTRIBUTIONThe following results present the volume size distribution of analysed samples. Distributions are given by volume because this tells us which group of particles contributes most to total particle mass. As an example for comparison, Figure 3 presents size distributions obtained for samples of batches B1 and B3. Intact cells (IC) IC Samples from B1 and B3 presented a monodisperse particle size volume distribution with a median diameter of Dv50 = 6.2 μm (Dv10 = 4.2 μm and Dv90 = 9.7 μm).
Disrupted samples Considering disrupted samples, BM85 from B1 (Figure 3a) showed a distribution very close to that of intact cells: the main peak (sum of the volume percentage of the corresponding particles equal to 99% of the volume in the analysed sample) was made up of particles with a volume diameter of Dv50 = 4.74 µm; while small particles, with Dv50 = 0.2 µm, formed less than 1% of the total volume. The same results were found for the batch B4 (B4-BM85, see appendix), but the small particles represented 13% of the total volume. By contrast, HPD85 in B3 (Figure 3b), showed a polydisperse size distribution with three peaks: the main one at Dv50 = 4.8 μm (55% of total volume), and two others at 0.3 μm and 65.9 μm, each with 22% of total volume. We note that some particles were bigger than ICs. This can be explained by the agglomeration of small particles after disruption: disrupted samples are mixtures in which water-soluble substances (polysaccharides, proteins, salts, etc.), and non-soluble compounds like lipids are mixed with cell fragments; some of these substances may be adsorbed at interfaces of particles, such as proteins on fat globules at water-oil interfaces (Lopez et al., 2010). After HPD of batch B3, the cells are broken in smaller fragments that explain the presence of smaller particles. The external structure of the cells is strongly modified. The destabilization of the suspension and the aggregation seems more important in HPD. The BM particles may maintain for a moment their general structure and the repulsion between cells. The aggregation will obviously also occur because of the release of the molecules but may be later. HPD in the case of batch B4 don’t show any aggregation. A deeper study would be needed to evaluate the impact of physiological state on the disruption method efficiency. Supernatant samples The centrifugation process eliminates cell fragments, which are pelleted. In the case of sample Sup.BM85 from batch B1, two peaks were detected: one at Dv50 = 18.3 μm (75% of total volume) and the other at Dv50 = 0.5 μm (25% of total volume). This result contrasts with that for sample Sup.HPD85 from B3 (Figure 3b), for which most of the particles presented a mean diameter of Dv50 = 0.02 μm (76% of total volume), although another peak appeared at Dv50 = 5.7 μm. Accordingly, particles found in supernatants should mainly be lipid droplets, with amphiphilic compounds that may be bound at the oil-water interface (proteins, etc.), or eventually non-centrifuged small fragments. But as we noticed in BM samples, most of disrupted cells have a size similar to intact cells and should leave in the pellet. These differences may be associated with the disruption process. Bead milling yields larger droplets than high-pressure disruption, which breaks up droplets. The centrifugation process may facilitate the coalescence
of the larger lipid droplets, and result in an increased size of particles found in supernatant samples. Data on the volume size distributions of all the other samples are presented in Appendix. They show that most of the supernatants after HPD contain smaller droplets than supernatants after BM. However, size of droplets in the supernatant may be a very important variable for lipid separation by membrane processes: bigger lipid droplets are desirable because this facilitates the separation from other components such as proteins and polysaccharides. Bead milling is therefore recommended.
3.3. F
ATTY ACID(FA)
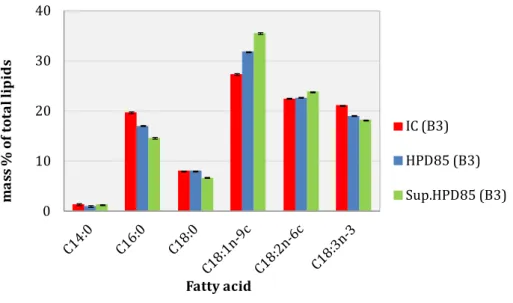
PROFILE OF THE TOTAL LIPID EXTRACTTable 2 shows the total fatty acid composition of intact cells (IC), cells disrupted by BM or HPD, and supernatant samples from nitrogen-starved P. kessleri cells. Carbon chains of fatty acids comprised 14 to 18 carbons, saturated, or with up to 3 unsaturations. Samples contained mainly oleic (C18:1n-9c), linoleic (C18:2n-6c), linolenic (C18:3n-3), palmitic (C16:0) and stearic acids (C18:0). Kobayashi et al., 2013, reported a similar profile for P. kessleri (same strain as used in this work,) but with C16:0 and C18:2n-6c as the main FAs. These results also show that a part of the total FA profile depends on the response of cells to starvation. The most notable variation in the total FA profile was that supernatant samples from cultures with the lowest lipid content (B1 and B4) showed more linoleic acid and less oleic acid than those from cultures with the highest total lipid content (B2 and B3). Likewise, some differences were observed between different sample types from the same batch. For instance, as shown in Figure 4, disrupted samples presented more oleic acid and less palmitic acid that intact cells, suggesting that the extra C18:1n-9c comes from polar lipids present in cell membranes. They were not extracted during IC analysis, but released during disruption. On the contrary, on comparing the different methods of disruption and the different percentages of disintegration (85% or 100%), non-significant differences were observed (Table 2, B2 and B4), suggesting that neither the method nor the cell disruption yield tested (85% or 100%) influenced the total FA profile.
3.4. SPE
SEPARATION OF LIPIDS INTAG,
ONL,
GL
ANDPL
CLASSESTable 3 shows the distribution of main lipid fractions in the total lipids extracted from two batches. For a culture with a good lipid production (B3), P. kessleri produced mainly neutral lipids, up to 90% of total lipids, of which 83% were TAGs (IC sample). This high accumulation of neutral lipids was caused by the depletion of nutrients, which causes cells to produce more reserve lipids (TAGs and ONLs) than polar lipids. (Kobayashi et al., 2013), reported similar
results for the same strain (also cultured under nitrogen depletion): TAG ≈ 80% of total lipids. These results are interesting compared with other strains (Appendix).
In the disrupted samples HPD85 from the B3 culture, the total lipids represented 63% of dry matter, whereas the lipids in HPD85 from the B4 culture represented only 27% of dry matter (see Figure 2). This is relied to the different answer of the two cultures to the starving conditions. However, surprisingly, equal proportions of TAGs were obtained: 47.7% of the total lipids in the HPD85 for B3 and B4. The proportion of “other neutral lipids” (ONLs) in sample HPD85 was higher for batch B3 than for the batch B4, in contrast to the polar lipids. On comparing IC, disrupted and supernatant samples from batch B3 (Table 3 and Table 4), the proportion of ONLs increased with disruption. This may be due to the release of ONLs during cell disruption. The mass of TAGs and polar lipids also slightly increased (Table 4). A part of these released compounds may also be degraded into FFAs. This degradation may be through hydrolysis due to enzymes released during cell disruption, or be a consequence of disruption conditions. (Balduyck et al., 2017, 2016)), also observed a rise in FFA concentration during storage of microalgae, depending on the strain, cell integrity and storage temperature. The effects of disruption can also be observed on comparing samples from the same batch B4 disrupted by different methods: despite the same total lipid content of the disrupted samples (Figure 2), HPD disruption led to a higher content of TAGs and ONLs and less polar lipids compared with sample BM85. The TAG and the polar lipid recovery may be higher in HPD and in BM respectively. The degradation of the TAGs and polar lipids may also be different in the two processes. Cross-analysis of the composition of the microalgae – Results from part 3.1., 3.3. and 3.4 show that for a culture with a good lipid production, P. kessleri produced mainly neutral lipids, up to 90% of total lipids, of which 83% were TAGs (IC sample). According to total fatty acid profiles, samples contained mainly oleic, linoleic, linolenic, palmitic and stearic acids. A part of the total FA profile was dependent on the response of cells to starvation. Supernatant samples from cultures with high lipid content showed more oleic acid and less linoleic acid than those from cultures a low total lipid content.
3.5. F
ATTY ACID COMPOSITION OF LIPID CLASSESThe different lipid classes (TAG, ONL, GL and PL) separated by SPE were transmethylated and analysed by GC to obtain their fatty acid profiles. The results of these analyses, for samples of batch B3, are presented in Table 5.
The results presented here are consistent with those presented previously for the total FA profile (Table 2 and Figure 4), which showed the same major fatty acids found in all fractions of different lipid classes. In general, different samples (IC, HPD85 and Sup.HPD85) presented a FA profile with similar trends for TAG, ONL and PL fractions. The major FAs were the same, with some differences in proportions. (Řezanka and Podojil, 1989), also identified C16:0, C18:1 C18:2 and C18:3 as the main FAs in the PL fraction for Parachlorella kessleri. One of the main differences between IC, HPD85 and Sup.HPD85 samples was observed in the GL fraction in IC, which presented large amounts of C16:0 and C18:0, which were significantly lower in the disrupted and the supernatant samples. Likewise, the C18:1n-9c content was much higher for the GL and PL fractions of disrupted and supernatant samples than for IC samples. As suggested above, the additional amount of C18:1n-9c may come from polar lipids of cell membrane released during disruption. The most abundant fatty acids found in TAG and ONL fractions for all sample types (IC, HPD85 and Sup. HPD85) were polyunsaturated FAs with 18 carbons. In the case of intact cells, SFAs were found to be less abundant in neutral lipid fractions (TAG and ONL) than in polar ones (GL and PL): 23–26% w/w and 44–75% w/w of SFAs respectively. Martin et al. (2014) proposed for Chlorella specie a recycling of acyl groups from polar lipids to produce TAG, which decreases the rate of polar lipids in starving cells, while a part of this loss could be compensated by de novo fatty acid production with mid-long and more saturated chains. This phenomenon is not the same for Nannochloropsis specie (Martin et al., 2014). After disruption and centrifugation, Sup.HPD85 samples showed ONL fractions enriched with MUFAs and PUFAs compared with HPD85. SFAs are solid at room temperature (melting point above 60 °C for C16:0 and C18:0), while MUFAs and PUFAs are liquid (melting points 13.4 °C for C18:1, −5 °C for C18:2 and −11 °C for C18:3). These results suggest that after disruption and centrifugation, a part of the SFAs may have been trapped in the pellet, and the supernatant may have contained more lipids in the liquid state, dispersed in the aqueous phase as in an oil-in-water emulsion. GL and PL also contained more MUFAs and PUFAs after disruption.
3.6. N
EUTRAL LIPID ANALYSISTriglyceride (TAG) analysis The TAG HPLC profiles (qualitative analysis) for samples from batch B3 (see Appendix), intact cells, disrupted cells and their supernatants, were closely similar, indicating that disruption and centrifugation after disruption had no visible effect on the TAG composition.
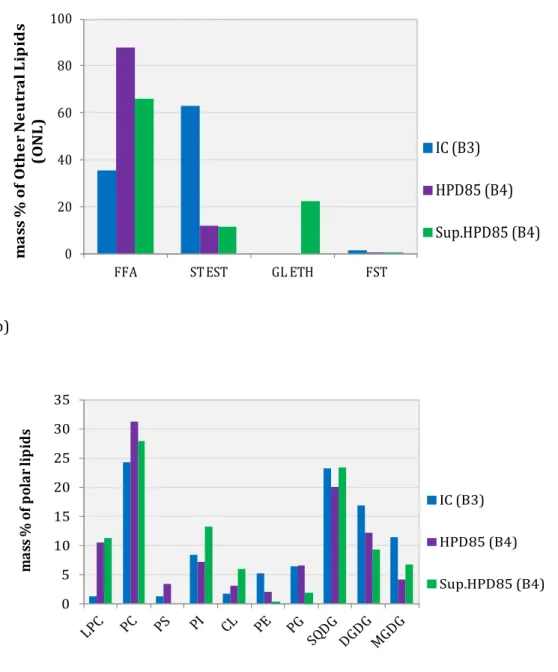
Chromatograms were highly complex owing to the broad variety of TAGs. These compounds are eluted following their equivalent carbon number ECN = number of carbons − 2(number of double bonds). For compounds with the same ECN, the retention time decreases with the number of double bonds. This is illustrated by the retention order of the TAGs with ECN 44: OLL < POLn < PPLn. However, TAGs with identical ECNs may not be completely separated during the HPLC analysis, with some co-elution, and overlapping of their peaks (Gunstone, 2002). To identify the probable TAGs produced by P. kessleri, a comparison with chromatograms from oils of known TAG compositions (grape, macadamia, linseed oils) (Holčapek et al., 2003; Lee et al., 2003) was made (Figure 5). TAGs may be composed mainly of oleic (O), linoleic (L), linolenic (Ln) and palmitic acids (P). Complementary analysis by MALDI TOF was also carried out for the TAG fractions of batch 3. Neither technique, HPLC or MALDI TOF, tell us the position of fatty acids on the glycerol backbone. From the combination of the two techniques, 43 molecular species were identified as the most probable compounds present in TAG fractions (see Appendix). These results show TAGs mainly containing 50–54 carbon atoms and 2–6 double bonds (40 < ECN < 48) as the most probable TAGs produced by starved P. kessleri. The suggested triglycerides are thus liquid at ambient temperature (melting points <20 °C) (Gunstone et al., 2007). Other neutral lipid (ONL) analysis An ONL profile was also determined for some samples using HPTLC (Figure 6a). Results showed that before disruption this fraction contained only 35% (w/w of total ONL) of free fatty acids (sample B3), but in disrupted samples (B4) the proportion increased up to 88% (w/w of total ONLs). These data support the hypothesis that disruption causes release of FFAs or the degradation of TAGs or polar lipids into FFAs. Other components were also identified among the ONLs, namely free sterols, glyceride ethers and sterol esters (main component found in sample IC B3).
3.7. P
OLAR LIPID ANALYSIS BYHPTLC
The composition of the polar lipids (phospholipids and glycolipids) of some samples was determined by HPTLC (Figure 6b). For the phospholipids, the data indicate that the most abundant component was phosphatidylcholine (PC) (24–31% w/w of polar lipids) followed by compounds also reported in the literature for other microalgal species (Alonso et al., 1998; Bigogno et al., 2002; Řezanka and Podojil, 1989; Wang and Wang, 2012) such as lysophosphatidylcholine LPC (1–11% w/w of polar lipids), phosphatidylinositol PI (7–13% w/w of polar lipids) et phosphatidylglycerol PG (2–6% w/w of polar lipids). Concerning the glycolipids, the sulfoquinovosyldiacylglycerol SQDG (20–23% w/w of polar lipids) was the mostabundant, followed by digalactosyldiacylglycerol DGDG (9–17% w/w of polar lipids) and monogalactosyldiacylglycerol MGDG (4–11% w/w of polar lipids). Roughly the same proportions of these polar compounds were quantified in all the samples except for the LPC. The IC sample contained low quantities of LPC (1% w/w of polar lipids) compared with the disrupted and supernatant samples (LPC: 10% w/w of the polar lipids). The high content of LPC in disrupted and supernatant samples may have been caused by the hydrolysis of PC (Mengesha and Bummer, 2010) by enzymes released during disruption. Cross-analysis of disruption methods - Results from part 3.1 and 3.2 show that disruption improved the quantity of lipids available for extraction and a large proportion of lipids was recovered in supernatants by centrifugation. Slightly higher oil content was observed in the supernatant of HPD samples, but bead milling yielded larger droplets, a very important criterion when considering lipid separation by membrane processes. Bead milling is therefore recommended. Agglomeration appears after disruption, causing an increase in particle size. Particles bigger than intact cells were also detected in supernatant samples, which could indicate the coalescence of lipid droplets. Results from part 3.4, 3.5, 3.6 and 3.7 show that The proportion of ONLs, and more specifically FFAs, increased with disruption. This was probably due to the degradation of TAGs or polar lipids by enzymes released during cell disruption, or a result of disruption conditions. HPD disruption led to a higher content of ONLs than BM. The degradation of phosphatidylcholine (PC) into lysophosphatidylcholine (LPC) was also noted and linked to a possible enzyme release. After disruption and centrifugation, the neutral lipid fractions (ONLs and TAGs) in supernatants were enriched in unsaturated fatty acids, which are liquids at ambient temperature, and therefore probably dispersed in the aqueous phase to form an oil-in-water emulsion.
4. C
ONCLUSIONThe objective was to analyze the composition and organization of lipids, after disruption of nitrogen-starved P. kessleri cultures by bead milling and High-pressure disruption. This work demonstrates that disrupting cells by HPD or bead milling improves lipid recovery, but increases the release of amphiphilic substances like FFAs and LPCs, which will favor emulsification. The neutral lipid fractions in supernatants were enriched in unsaturated compounds compared to the disrupted samples. BM was recommended because larger droplet of lipids could be recovered in supernatants. These data will help integrating BM or HPD in the whole process of microalgal lipid production. Acknowledgments:
This work was supported by CNRS (interdisciplinary ENRS project 2014-2016) and realised in collaboration with INRA within the Joint Federation "Biopolymer Engineering for Matrices and Material Structuration" IBSM N° 4202. Appendices Lipid classes’ composition for different microalgae is presented in appendix A. The details on the chemical analyses are presented in appendix B. Detailed results of the granulometry analysis are presented in appendix C. The probable TAG composition of samples from batch 3 are detailed in appendix D. References 1. Ahlgren, G., Gustafsson, I.-B., Boberg, M., 1992. Fatty Acid Content and Chemical Composition of Freshwater Microalgae1. J. Phycol. 28, 37–50. 2. Alonso, D.L., Belarbi, E.-H., Rodríguez-Ruiz, J., Segura, C.I., Giménez, A., 1998. Acyl lipids of three microalgae. Phytochemistry 47, 1473–1481. 3. Angles, E., Jaouen, P., Pruvost, J., Marchal, L., 2017. Wet lipid extraction from the microalga Nannochloropsis sp.: Disruption, physiological effects and solvent screening. Algal Res. 21, 27–34. 4. Balduyck, L., Bijttebier, S., Bruneel, C., Jacobs, G., Voorspoels, S., Van Durme, J., Muylaert, K., Foubert, I., 2016. Lipolysis in T-Isochrysis lutea during wet storage at different temperatures. Algal Res. 18, 281–287. 5. Balduyck, L., Stock, T., Bijttebier, S., Bruneel, C., Jacobs, G., Voorspoels, S., Muylaert, K., Foubert, I., 2017. Integrity of the microalgal cell plays a major role in the lipolytic stability during wet storage. Algal Res. 25, 516–524. 6. Becker, E.W., 1993. Microalgae: Biotechnology and Microbiology. Cambridge University Press. 7. Bigogno, C., Khozin-Goldberg, I., Boussiba, S., Vonshak, A., Cohen, Z., 2002. Lipid and fatty acid composition of the green oleaginous alga Parietochloris incisa, the richest plant source of arachidonic acid. Phytochemistry 60, 497–503. 8. Bottier, C., Géan, J., Artzner, F., Desbat, B., Pézolet, M., Renault, A., Marion, D., Vié, V., 2007. Galactosyl headgroup interactions control the molecular packing of wheat lipids in Langmuir films and in hydrated liquid-crystalline mesophases. Biochim. Biophys. Acta 1768, 1526–1540. 9. Chen, G., Jiang, Y., Chen, F., 2007. Fatty acid and lipid class composition of the eicosapentaenoic acid-producing microalga, Nitzschia laevis. Food Chem. 104, 1580– 1585. 10. Chisti, Y., 2008. Biodiesel from microalgae beats bioethanol. Trends Biotechnol. 26, 126– 131. 11. Cohen, Z., 1999. Chemicals from Microalgae. CRC Press. 12. Dong, T., Knoshaug, E.P., Pienkos, P.T., Laurens, L.M.L., 2016. Lipid recovery from wet oleaginous microbial biomass for biofuel production: A critical review. Appl. Energy 177, 879–895. 13. Fernandes, B., Teixeira, J., Dragone, G., Vicente, A.A., Kawano, S., Bišová, K., Přibyl, P., Zachleder, V., Vítová, M., 2013. Relationship between starch and lipid accumulation induced by nutrient depletion and replenishment in the microalga Parachlorella kessleri. Bioresour. Technol. 144, 268–274.
14. Fogang Mba, A.R., Kansci, G., Viau, M., Hafnaoui, N., Meynier, A., Demmano, G., Genot, C., 2017. Lipid and amino acid profiles support the potential of Rhynchophorus phoenicis larvae for human nutrition. J. Food Compos. Anal. 60, 64–73. 15. Grimi, N., Dubois, A., Marchal, L., Jubeau, S., Lebovka, N.I., Vorobiev, E., 2014. Selective extraction from microalgae Nannochloropsis sp. using different methods of cell disruption. Bioresour. Technol. 153, 254–259. 16. Günerken, E., D’Hondt, E., Eppink, M.H.M., Garcia-Gonzalez, L., Elst, K., Wijffels, R.H., 2015. Cell disruption for microalgae biorefineries. Biotechnol. Adv. 33, 243–260. 17. Gunstone, F.D., 2002. Vegetable Oils in Food Technology: Composition, Properties, and Uses. Blackwell. 18. Gunstone, F.D., Harwood, J.L., Dijkstra, A.J., 2007. The lipid Handbook, 3rd ed. CRC Press. Tylor & Francis Group. 19. Halim, R., Danquah, M.K., Webley, P.A., 2012. Extraction of oil from microalgae for biodiesel production: A review. Biotechnol. Adv. 30, 709–732. 20. Holčapek, M., Jandera, P., Zderadička, P., Hrubá, L., 2003. Characterization of triacylglycerol and diacylglycerol composition of plant oils using high-performance liquid chromatography–atmospheric pressure chemical ionization mass spectrometry. J. Chromatogr. A 1010, 195–215. 21. Huang, X., Huang, Z., Wen, W., Yan, J., 2013. Effects of nitrogen supplementation of the culture medium on the growth, total lipid content and fatty acid profiles of three microalgae (Tetraselmis subcordiformis, Nannochloropsis oculata and Pavlova viridis). J. Appl. Phycol. 25, 129–137. 22. Jayasinghe, C., Gray, D., 2014. Lipid Bodies Isolated Microalgae Residues as a Source for Bioethanol Production, in: Kim, S.-K. (Ed.), Seafood Processing By-Products. Springer New York, pp. 407–421. 23. Jones, J., Manning, S., Montoya, M., Keller, K., Poenie, M., 2012. Extraction of Algal Lipids and Their Analysis by HPLC and Mass Spectrometry. J. Am. Oil Chem. Soc. 89, 1371– 1381. 24. Kobayashi, N., Noel, E.A., Barnes, A., Rosenberg, J., DiRusso, C., Black, P., Oyler, G.A., 2013. Rapid Detection and Quantification of Triacylglycerol by HPLC–ELSD in Chlamydomonas reinhardtii and Chlorella Strains. Lipids 48, 1035–1049. 25. Lee, J.-H., Jones, K.C., Lee, K.-T., Kim, M.-R., Foglia, T.A., 2003. High-Performance Liquid Chromatographic Separation of Structured Lipids Produced by Interesterification of Macadamia Oil with Tributyrin and Tricaprylin. Chromatographia 58, 653–658. 26. Lee, S.Y., Cho, J.M., Chang, Y.K., Oh, Y.-K., 2017. Cell disruption and lipid extraction for microalgal biorefineries: A review. Bioresour. Technol. 244, 1317–1328. 27. Lipid Maps, 2017. LIPID MAPS Tools : LIPID MAPS Lipidomics Gateway [WWW Document]. URL http://www.lipidmaps.org/tools/ms/ (accessed 10.29.17). 28. Lopez, C., Madec, M.-N., Jiménez-Flores, R., 2010. Lipid Rafts in the Bovine Milk Fat Globule Membrane Revealed by the Lateral Segregation of Phospholipids and Heterogeneous Distribution of Glycoproteins. Food Chem. 120, 22–33. 29. Mansour, M.P., Frampton, D.M.F., Nichols, P.D., Volkman, J.K., Blackburn, S.I., 2005. Lipid and fatty acid yield of nine stationary-phase microalgae: Applications and unusual C24– C28 polyunsaturated fatty acids. J. Appl. Phycol. 17, 287–300. 30. Martin, G.J.O., Hill, D.R.A., Olmstead, I.L.D., Bergamin, A., Shears, M.J., Dias, D.A., Kentish, S.E., Scales, P.J., Botté, C.Y., Callahan, D.L., 2014. Lipid profile remodeling in response to
nitrogen deprivation in the microalgae Chlorella sp. (Trebouxiophyceae) and Nannochloropsis sp. (Eustigmatophyceae). PloS One 9, e103389. 31. Mengesha, A.E., Bummer, P.M., 2010. Simple Chromatographic Method for Simultaneous Analyses of Phosphatidylcholine, Lysophosphatidylcholine, and Free Fatty Acids. AAPS PharmSciTech 11, 1084–1091. 32. Meullemiestre, A., Breil, C., Abert-Vian, M., Chemat, F., 2016. Microwave, ultrasound, thermal treatments, and bead milling as intensification techniques for extraction of lipids from oleaginous Yarrowia lipolytica yeast for a biojetfuel application. Bioresour. Technol. 211, 190–199. 33. Middelberg, A.P.J., 1995. Process-scale disruption of microorganisms. Biotechnol. Adv. 13, 491–551. 34. Montalescot, V., Rinaldi, T., Touchard, R., Jubeau, S., Frappart, M., Jaouen, P., Bourseau, P., Marchal, L., 2015. Optimization of bead milling parameters for the cell disruption of microalgae: Process modeling and application to Porphyridium cruentum and Nannochloropsis oculata. Bioresour. Technol. 196, 339–346. 35. Morrison, W.R., Smith, L.M., 1964. Preparation of fatty acid methyl esters and dimethylacetals from lipids with boron fluoride methanol. J. Lipid Res. 5, 600–608. 36. Moutel, B., Gonçalves, O., Le Grand, F., Long, M., Soudant, P., Legrand, J., Grizeau, D., Pruvost, J., 2016. Development of a screening procedure for the characterization of Botryococcus braunii strains for biofuel application. Process Biochem., Bioenergies : Present & Prospects 51, 1855–1865. 37. Přibyl, P., Cepák, V., Zachleder, V., 2012. Production of lipids in 10 strains of Chlorella and Parachlorella, and enhanced lipid productivity in Chlorella vulgaris. Appl. Microbiol. Biotechnol. 94, 549–561. 38. Pruvost, J., Van Vooren, G., Cogne, G., Legrand, J., 2009. Investigation of biomass and lipids production with Neochloris oleoabundans in photobioreactor. Bioresour. Technol. 100, 5988–5995. 39. Řezanka, T., Podojil, M., 1989. Preparative separation of algal polar lipids and of individual molecular species by high-performance liquid chromatography and their identification by gas chromatography—mass spectrometry. J. Chromatogr. A 463, 397– 408. 40. Roleda, M.Y., Slocombe, S.P., Leakey, R.J.G., Day, J.G., Bell, E.M., Stanley, M.S., 2013. Effects of temperature and nutrient regimes on biomass and lipid production by six oleaginous microalgae in batch culture employing a two-phase cultivation strategy. Bioresour. Technol. 129, 439–49. 41. Ryckebosch, E., Bruneel, C., Termote-Verhalle, R., Goiris, K., Muylaert, K., Foubert, I., 2014. Nutritional evaluation of microalgae oils rich in omega-3 long chain polyunsaturated fatty acids as an alternative for fish oil. Food Chem. 160, 393–400. 42. Shene, C., Monsalve, M.T., Vergara, D., Lienqueo, M.E., Rubilar, M., 2015. High pressure homogenization of Nannochloropsis oculata for the extraction of intracellular components: Effect of process conditions and culture age. Eur. J. Lipid Sci. Technol. n/a-n/a. 43. Siaut, M., Cuiné, S., Cagnon, C., Fessler, B., Nguyen, M., Carrier, P., Beyly, A., Beisson, F., Triantaphylidès, C., Li-Beisson, Y., Peltier, G., 2011. Oil accumulation in the model green alga Chlamydomonas reinhardtii: characterization, variability between common laboratory strains and relationship with starch reserves. BMC Biotechnol. 11, 7.
44. Spiden, E.M., Scales, P.J., Kentish, S.E., Martin, G.J.O., 2013a. Critical analysis of quantitative indicators of cell disruption applied to Saccharomyces cerevisiae processed with an industrial high pressure homogenizer. Biochem. Eng. J. 70, 120–126. 45. Spiden, E.M., Yap, B.H.J., Hill, D.R.A., Kentish, S.E., Scales, P.J., Martin, G.J.O., 2013b. Quantitative evaluation of the ease of rupture of industrially promising microalgae by high pressure homogenization. Bioresour. Technol. 140, 165–171. 46. Taleb, A., Kandilian, R., Touchard, R., Montalescot, V., Rinaldi, T., Taha, S., Takache, H., Marchal, L., Legrand, J., Pruvost, J., 2016. Screening of freshwater and seawater microalgae strains in fully controlled photobioreactors for biodiesel production. Bioresour. Technol. 218, 480–490. 47. Taleb, A., Pruvost, J., Legrand, J., Marec, H., Le-Gouic, B., Mirabella, B., Legeret, B., Bouvet, S., Peltier, G., Li-Beisson, Y., Taha, S., Takache, H., 2015. Development and validation of a screening procedure of microalgae for biodiesel production: application to the genus of marine microalgae Nannochloropsis. Bioresour. Technol. 177, 224–232. 48. Vidyashankar, S., VenuGopal, K.S., Swarnalatha, G.V., Kavitha, M.D., Chauhan, V.S., Ravi, R., Bansal, A.K., Singh, R., Pande, A., Ravishankar, G.A., Sarada, R., 2015. Characterization of fatty acids and hydrocarbons of chlorophycean microalgae towards their use as biofuel source. Biomass Bioenergy 77, 75–91. 49. Viswanathan, T., Mani, S., Das, K.C., Chinnasamy, S., Bhatnagar, A., Singh, R.K., Singh, M., 2012. Effect of cell rupturing methods on the drying characteristics and lipid compositions of microalgae. Bioresour. Technol., Advances in Biological Waste Treatment and Bioconversion Technologies 126, 131–136. 50. Wang, G., Wang, T., 2012. Characterization of Lipid Components in Two Microalgae for Biofuel Application. J. Am. Oil Chem. Soc. 89, 135–143.
Captions
Figures Figure 1. Synthesis of the different characterisation methods used to determine lipid profile from Parachlorella kessleri samples Figure 2. Total lipid content of samples from different cultures of nitrogen-starved Parachlorella kessleri. IC: intact cells. BM sample ground in bead mill. HPD: sample subjected to high pressure disruption. Sup.: supernatant sample. 85 and 100: percentage of cell disintegration. Figure 3. Volume particle size distribution of samples from cultures a) B1 and b) B3 of nitrogen-starvedParachlorella kessleri. IC: intact cells. BM sample ground with bead mill. HPD: sample subjected to high pressure disruption. Sup.: supernatant sample. 85 and 100: percentage of cell disintegration. q(%): volume percentage of the corresponding particles relative to the total volume of measured particles. Figure 4. Major fatty acid compositions of samples from different cultures of nitrogen-starved Parachlorella kessleri Figure 5. Probable TAGs from sample HPD100 of batch B2 compared with vegetable oils. L: linoleic acid, Ln: linolenic acid, O: oleic acid, P: palmitic acid Figure 6. HPTLC results for neutral lipids (a) and polar lipids (b) from B3 and B4 samples. ST EST: sterol ester, GL ETH: glyceride ether, TG: triglyceride, FFA: free fatty acid, ALC: alcohol, LPC: lysophosphatidylcholine, PC: phosphatidylcholine, PS: phosphatidylserine, PI: phosphatidylinositol, CL: cardiolipid, PE: phosphatidylethanolamine, PG: phosphatidylglycerol, SQDG: sulfoquinovosyldiacylglycerol, MGDG: monogalactosyldiacylglycerol, DGDG: digalactosyldiacylglycerol
Tables
Table 1. Synthesis of analysed samples from the different batches
Batch IC BM85 HPD85 HPD100 Sup.BM85 Sup.HPD85 Sup.HPD100 Sup.BM100
B1 ü ü - - ü - - - B2 - - - ü ü ü ü ü B3 ü ü - - ü - - B4 - ü ü - ü ü - - IC: intact cells. BM: sample ground in bead mill. HPD: sample subjected to high pressure disruption. Sup.: supernatant sample obtained by centrifugation. 85 and 100: percentage of cell disintegration.
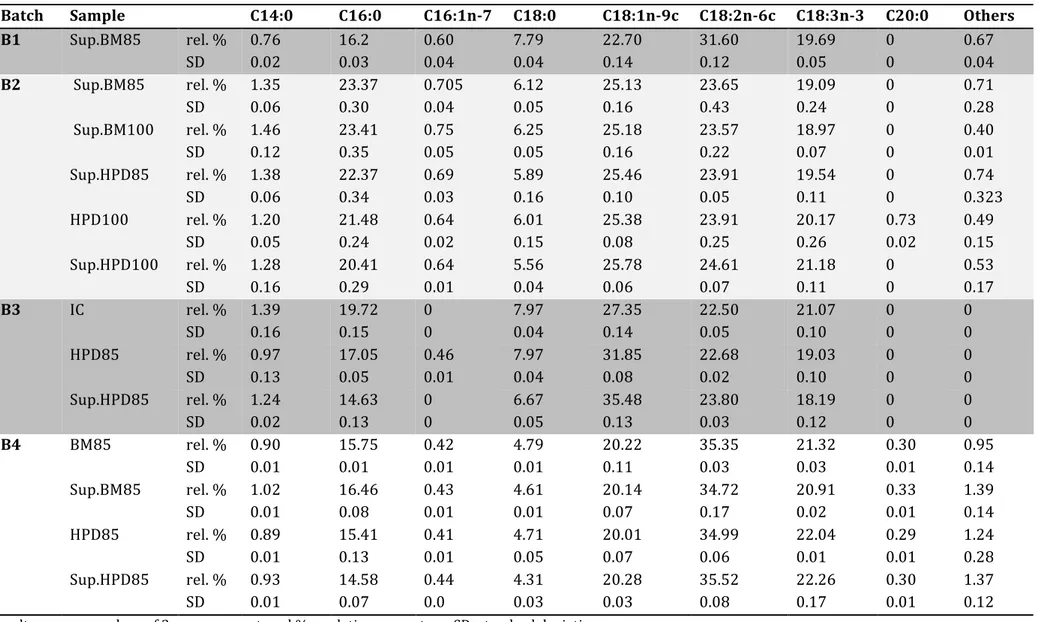
Table 2. Total fatty acid composition of intact cells, cells disrupted by BM or HPD and supernatant samples from nitrogen-starved Parachlorella kessleri
Batch Sample C14:0 C16:0 C16:1n-7 C18:0 C18:1n-9c C18:2n-6c C18:3n-3 C20:0 Others
B1 Sup.BM85 rel. % 0.76 16.2 0.60 7.79 22.70 31.60 19.69 0 0.67 SD 0.02 0.03 0.04 0.04 0.14 0.12 0.05 0 0.04 B2 Sup.BM85 rel. % 1.35 23.37 0.705 6.12 25.13 23.65 19.09 0 0.71 SD 0.06 0.30 0.04 0.05 0.16 0.43 0.24 0 0.28 Sup.BM100 rel. % 1.46 23.41 0.75 6.25 25.18 23.57 18.97 0 0.40 SD 0.12 0.35 0.05 0.05 0.16 0.22 0.07 0 0.01 Sup.HPD85 rel. % 1.38 22.37 0.69 5.89 25.46 23.91 19.54 0 0.74 SD 0.06 0.34 0.03 0.16 0.10 0.05 0.11 0 0.323 HPD100 rel. % 1.20 21.48 0.64 6.01 25.38 23.91 20.17 0.73 0.49 SD 0.05 0.24 0.02 0.15 0.08 0.25 0.26 0.02 0.15 Sup.HPD100 rel. % 1.28 20.41 0.64 5.56 25.78 24.61 21.18 0 0.53 SD 0.16 0.29 0.01 0.04 0.06 0.07 0.11 0 0.17 B3 IC rel. % 1.39 19.72 0 7.97 27.35 22.50 21.07 0 0 SD 0.16 0.15 0 0.04 0.14 0.05 0.10 0 0 HPD85 rel. % 0.97 17.05 0.46 7.97 31.85 22.68 19.03 0 0 SD 0.13 0.05 0.01 0.04 0.08 0.02 0.10 0 0 Sup.HPD85 rel. % 1.24 14.63 0 6.67 35.48 23.80 18.19 0 0 SD 0.02 0.13 0 0.05 0.13 0.03 0.12 0 0 B4 BM85 rel. % 0.90 15.75 0.42 4.79 20.22 35.35 21.32 0.30 0.95 SD 0.01 0.01 0.01 0.01 0.11 0.03 0.03 0.01 0.14 Sup.BM85 rel. % 1.02 16.46 0.43 4.61 20.14 34.72 20.91 0.33 1.39 SD 0.01 0.08 0.01 0.01 0.07 0.17 0.02 0.01 0.14 HPD85 rel. % 0.89 15.41 0.41 4.71 20.01 34.99 22.04 0.29 1.24 SD 0.01 0.13 0.01 0.05 0.07 0.06 0.01 0.01 0.28 Sup.HPD85 rel. % 0.93 14.58 0.44 4.31 20.28 35.52 22.26 0.30 1.37 SD 0.01 0.07 0.0 0.03 0.03 0.08 0.17 0.01 0.12 Results are mean values of 3 measurements. rel % = relative percentage. SD: standard deviation
Table 3. Lipid class profiles of nitrogen-starved Parachlorella kessleri (% w/w of total lipids)
Batch Sample % TAGs % ONLs % GLs % PLs
B3 IC 82.82 ± 1.27 5.85 ± 0.55 3.92 ± 0.22 6.57 ± 0.54 HPD85 47.76 ± 1.14 42.11 ± 0.80 5.81 ± 0.23 4.32 ± 0.13 Sup.HPD85 45.95 ± 1.10 43.75 ± 0.85 6.35 ± 0.36 3.94 ± 0.25 B4 BM85 36.31 ± 2.77 7.93 ± 7.79 36.38 ± 12.43 19.38 ± 2.16 Sup.BM85 21.88 ± 0.92 9.79 ± 5.40 42.24 ± 5.05 26.09 ± 0.75 HPD85 47.79 ± 1.47 32.27 ± 2.14 10.35 ± 1.89 9.59 ± 0.82 Sup.HPD85 32.04 ± 8.51 18.48 ± 5.13 27.73 ± 3.86 21.75 ± 4.75 Results are mean values ± standard deviation. Table 4. Mass of TAGs, ONLs and polar lipids from Batch 3, according to total lipid content and relative mass
Batch B3 IC HPD85 Sup.HPD85
Total lipid content (g) per 100 g of dry matter 33 63 52 Mass of TAGs (g) per 100 g of dry matter 27.4 30.2 23.9 Mass of ONLs (g) per 100 g of dry matter 1.9 26.5 22.9 Mass of polar lipids (g) per 100 g of dry matter 3.5 6.4 5.4 Table 5. Fatty acid profile of lipid classes for intact cells (IC), disrupted sample HPD85 and supernatant Sup.HPD85 from batch B3 (relative %)
FA IC HPD85 Sup. HPD85
TAG ONL GL PL TAG ONL GL PL TAG ONL GL PL
C14:0 1.43 0 0 0.00 1.00 0.82 3.09 0 1.10 0.75 4.22 1.58 C16:0 17.78 15.61 42.39 38.34 14.31 20.66 27.53 34.15 14.51 13.44 21.58 42.35 C16:1n-7 0.45 0 0 0 0.41 0.39 0.00 0 0 0.41 0 0 C18:0 7.24 7.77 32.72 5.41 7.62 9.04 10.02 4.94 7.15 6.57 7.39 5.68 C18:1n-9c 29.79 24.56 0 7.83 33.06 31.39 23.84 10.56 36.23 37.07 28.36 13.23 C18:2n-6c 23.74 27.45 0 22.01 23.08 21.22 17.55 22.66 22.99 23.95 20.52 20.46 C18:3n-3 19.57 24.61 24.89 26.41 19.70 15.92 19.01 27.69 17.19 17.37 19.33 16.70 C20:0 0 0 0 0 0.82 0.82 0 0 0.82 0.44 0 0 Others 0.45 0 0 0 1.24 1.22 0 0 0.82 0.85 0 0 Total SFAs 26.44 23.38 75.11 43.76 23.74 31.35 40.64 39.09 23.58 21.20 33.19 49.62 Total MUFAs 30.25 24.56 0 7.83 33.48 31.79 23.84 10.56 36.23 37.49 28.36 13.23 Total PUFAs 43.31 52.06 24.89 48.41 42.78 37.14 36.55 50.35 40.18 41.31 39.85 37.16 Results are mean values of 3 measurements. SFAs: saturated fatty acids. MUFAs: monounsaturated fatty acids. PUFAs: polyunsaturated fatty acids
Figures
Figure 1. Synthesis of the different characterisation methods used to determine lipid profile from Parachlorella kessleri samples Total lipid extraction Intact Cells IC Solid phase extraction SPE (separation into lipid classes) Transmethylation GC analysis of FAME Neutral lipids TAG Polar lipids ONL PL GL Tot. FA profile TAG FA profile ONL FA profile PL FA profile GL FA profile HPLC analysis for lipid class verification Transmethylation to obtain FAME GC analysis of FAME HPTLC analysis (polar lipid analysis) GL profile PL profile Sample Disrupted byFigure 2. Total lipid content of samples from different cultures of nitrogen-starved Parachlorella kessleri IC: intact cells. BM sample ground in bead mill. HPD: sample subjected to high pressure disruption. Sup.: supernatant sample. 85 and 100: percentage of cell disintegration. Figure 3. Volume particle size distribution of samples from cultures a) B1 and b) B3 of nitrogen-starved Parachlorella kessleri. IC: intact cells. BM sample ground with bead mill. HPD: sample subjected to high pressure disruption. Sup.: supernatant sample. 85 and 100: percentage of cell disintegration. q(%): volume percentage of the corresponding particles relative to the total volume of measured particles. 0 10 20 30 40 50 60 70 To ta l l ip id c on te n t (d ry w eig h t % )
Figure 4. Major fatty acid compositions of samples from different cultures of nitrogen-starved Parachlorella kessleri Figure 5. Probable TAGs from sample HPD100 of batch B2 compared with vegetable oils. L: linoleic acid, Ln: linolenic acid, O: oleic acid, P: palmitic acid 0 10 20 30 40 m as s % o f t ot al lip id s Fatty acid IC (B3) HPD85 (B3) Sup.HPD85 (B3) 0 100 200 300 400 500 0 10 20 30 mV t (min) HPD100-TAG (B2) Grape Macadamia Flax PL L PO L OL L LLL OOL OOO PO O Ln Ln Ln LLn Ln OL n Ln PL n Ln OLLn PL Ln
a) b) Figure 6. HPTLC results for other neutral lipids (a) and polar lipids (b) from B3 and B4 samples. FFA: free fatty acid, ST EST: sterol ester, GL ETH: glyceride ether, LPC: lysophosphatidylcholine, PC: phosphatidylcholine, PS: phosphatidylserine, PI: phosphatidylinositol, CL: cardiolipid, PE: phosphatidylethanolamine, PG: phosphatidylglycerol, SQDG: sulfoquinovosyldiacylglycerol, MGDG: monogalactosyldiacylglycerol, DGDG: digalactosyldiacylglycerol 0 20 40 60 80 100
FFA ST EST GL ETH FST
m a ss % o f O th e r N e u tr a l L ip id s (O N L ) IC (B3) HPD85 (B4) Sup.HPD85 (B4) 0 5 10 15 20 25 30 35 m as s % o f p ol ar lip id s IC (B3) HPD85 (B4) Sup.HPD85 (B4)