Open Archive TOULOUSE Archive Ouverte (OATAO)
OATAO is an open access repository that collects the work of Toulouse researchers and
makes it freely available over the web where possible.
This is an author-deposited version published in :
http://oatao.univ-toulouse.fr/
Eprints ID : 19416
To link to this article : DOI: 10.1016/j.cej.2017.09.164
URL : http://dx.doi.org/10.1016/j.cej.2017.09.164
To cite this version : Lan, Yandi and Coetsier, Clémence and Causserand,
Christel and Serrano, Karine An experimental and modelling study of the
electrochemical oxidation of pharmaceuticals using a boron-doped diamond
anode. (2018) Chemical Engineering Journal, vol. 333. pp. 486-494. ISSN
1385-8947
Any correspondence concerning this service should be sent to the repository
administrator:
[email protected]
An experimental and modelling study of the electrochemical oxidation of
pharmaceuticals using a boron-doped diamond anode
Yandi Lan, Clémence Coetsier, Christel Causserand, Karine Groenen Serrano
⁎Laboratoire de Génie Chimique, CNRS, INPT, UPS, Université de Toulouse, 118 route de Narbonne, F-31062 Toulouse, France
G R A P H I C A L A B S T R A C T
A R T I C L E I N F O
Keywords:Electrochemical oxidation Boron-doped diamond anode Pharmaceuticals removal Numerical model Wastewater treatment
A B S T R A C T
This paper deals with an experimental and modelling study on the electrochemical oxidation of refractory pharmaceuticals using a boron-doped diamond (BDD) anode. Different parameters have been investigated, such as the role of salts (sulfates), the presence of other organics, and the influence of applied current intensity. Ciprofloxacin (CIP), Sulfamethoxazole (SMX) and Salbutamol (SALBU) were used for models of pharmaceuticals, and urea as a model for a common organic. The complete removal of pharmaceuticals was observed in all electrolyses under galvanostatic conditions. The presence of common organic waste or other pharmaceutical has no significant impact on the degradation of the CIP target molecule. A mathematical model predicting the temporal concentration variation of organics with electroxidation time has been developed. In this model, dif-ferent oxidation pathways have been considered: the transfer of electrons (direct oxidation) or of oxygen atoms via the reaction with either hydroxyl radicals or/and with strong electrogenerated oxidants. Excellent correla-tion with experiments is obtained under all experimental condicorrela-tions.
1. Introduction
The world-wide consumption of antibiotics is estimated to be be-tween 100 000 and 200 000 tons over the last 50 years[1]. Because most pharmaceuticals, especially antibiotics, are only partially biode-gradable, or even resistant to the conventional activated sludge process of a wastewater treatment plant (WWTP), they are released directly into
the environment[2–4]. Consequently, the spread and accumulation of pharmaceuticals in the aquatic system[5–10]pose significant threats to the sustainability of eco-systems and the safety of drinking water [11–13]. It is therefore crucial to develop and apply more efficient water treatment technologies for the removal of refractory pharma-ceuticals from effluents.
Although the industrial scale is still under development,
⁎Corresponding author.
electrochemical oxidation is a promising alternative technology for the elimination of pharmaceuticals from water, in particular using a boron-doped diamond anode (BDD)[14]. The strong ability of BDD anodes for organic oxidation is well known and attributed to the electrogeneration of hydroxyl radicals (%OH) from water discharge (Eq.(1)). Hydroxyl radicals are the most powerful oxidants in water (standard potential E0= 2.74 V/SHE [15]). They react unselectively and rapidly with a
large variety of organics (i.e. kinetic constant > 109M−1s−1)[16].
H2O →%OH + H++e− (1)
Due to the wide electrode potential window of BDD anodes, direct transfer reactions of electrons are also available. They constitute an important additional mechanism for the oxidation of organics. Numerous studies have shown that a combination of direct transfer of electrons and %OH oxidation are involved in the oxidation pathways of various organic compounds. Through these oxidation pathways, elec-trochemical oxidation processes have demonstrated their great ability to efficiently degrade a wide range of refractory pharmaceuticals, such as paracetamol [17], atenolol [18], trimethoprim [19] and sulfa-chloropyridazine [20]. Nevertheless, almost all of these studies were performed in an aqueous solution that contained only a single phar-maceutical compound. The composition of wastewater is more com-plex, it often contains common organics, such as urea or other re-fractory pharmaceuticals [21,22]. With the aim of the industrial application of the electrochemical processes, the consequence of the presence of organics on the degradation of a target pharmaceutical should be studied.
Modelling is an important approach in the understanding of the oxidation process. Several models have been developed to describe the electroxidation of organic pollutants at the BDD anode. A theoretical model presented by Panizza et al.[23]predicts the temporal decay of the global parameter, which is the chemical oxygen demand (COD). This model, based on the unselectivity of hydroxyl radicals is very useful. Scialdone et al.[24]have extended this model, by taking into consideration species, like oxalic acid. This type of specie is directly oxidized by the transfer of electrons, due to the slow kinetics of the chemical reaction between oxalic acid and hydroxyl radical: 9.2 10−6
L mol−1s−1. Cañizares et al.[25]have investigated a model which
describes the evolution of the concentration of one organic involved in the oxidation processes. The kinetics of organic oxidation were de-scribed by pseudo first-order reactions. To reduce the mathematical complexity, the concentration of the organic compound was considered as dependent only temporally, not spatially. The approach used by Mascia et al.[26,27]focused on the phenomena close to the anode by using a diffusion-reaction model. The aim was to evidence the effects of the operating conditions (hydrodynamics of the cell, current density, influence of the salts, namely chlorides) on the kinetics of the phenolic compounds oxidation. Kapalka et al.[28]investigated the temporal and spatial variations of concentration of a single organic compound and hydroxyl radicals. In this model, a single zone is defined comprising electrode and solution. In order to highlight the role of hydroxyl radi-cals and their action zone, we have developed a model containing three zones[29]: (i) the action zone of %OH close to the electrode (ii) the diffusion zone where the concentration of organics linearly varies with the distance (iii) the bulk zone where the organic concentration is homogenous. This model evidenced the role of %OH in the competition of organics.
The present study, based on an experimental and modelling ap-proach, aims to investigate the degradation of pharmaceutical pollu-tants by electrochemical oxidation on the BDD anode. The contribu-tions of the oxidation pathways are emphasized: transfer of electrons (direct oxidation), transfer of oxygen atoms via a reaction with either hydroxyl radicals or/and with a strong electrogenerated oxidant. For this purpose, the chosen target pollutants are: two antibiotics (cipro-floxacin and sulfamethoxazole), one beta-agonist (salbutamol), and a common organic compound (urea). All these compounds are frequently detected in groundwater[4,30–32]. An easy-to-use model is put for-ward and compared with the experimental results obtained in various operating conditions: concentration of sulfate, various current densities, presence of electroactive and electroinactive organics in the solution. Abbreviations
A electrode surface (m2)
C concentration (mol m−3)
C0 initial concentration (mol m−3)
Cs concentration at the electrode (mol m−3)
j current density (A m−2)
−
jlim ne, limiting current density of direct transfer of electrons
(A m−2)
jlim, OH% limiting current density corresponding to the total
mi-neralization of the specie i (A m−2)
Kd mass transfer coefficient (m s−1)
ki rate constant of chemical reaction involving%OH and i
kSE pseudo-first-order constant rate due to salt effect (s−1)
n number of exchanged electrons
V volume (m3)
Greek letters
γ equivalent number of exchange electrons necessary to
achieve complete mineralisation
Γ total rate of organic destruction
−
Γe rate of direct oxidation (electron transfer)
Γ%OH reaction rate of organic with hydroxyl radicals
ΓSE reaction rate of organic with electrogenerated oxidant
Table 1
Organics used in the synthetic solution.
Ciprofloxacin (CIP) Sulfamethoxazole (SMX) Salbutamol (SALBU) Urea Formula C17H18FN3O3 C10H11N3O3S C13H21NO3 CH4N2O
Type Antibiotic Antibiotic Beta-agonist Organic
M (g mol−1) 331.3 253.3 239.3 60.06
2. Materials and method 2.1. Chemicals
The pharmaceuticals: ciprofloxacin (≥98% purity), sulfamethox-azole (≥98% purity) and salbutamol (Salbutamol·sulfate ≥ 99% purity) were purchased from Alfa Aesar and Fluka. Urea was laboratory reagent grade from Fisher chemical. All synthetic solutions were pre-pared with ultrapure water (ρ = 18.2 MΩ cm). Potassium sulfate (≥99% purity), as the supporting electrolyte for electrochemical oxi-dation in the synthetic solution, was analytical grade and supplied by Fisher Science. Other chemicals, organics or solvents, were HPLC or analytical grade(Table 1).
The range of concentration of the pharmaceuticals (CIP, SMX, SALBU) used in this study was chosen according to the concentration of refractory organics detected in the nanofiltration concentrate of a bio-logical-treated hospital wastewater[33].
2.2. Analytical methods
Pharmaceutical concentrations were measured by high performance liquid chromatography (HPLC) and a UV detector using an Agilent ZORBAX Eclipse Plus C18 column (3.5 µm, 3 mm × 100 mm) from Agilent Technologies. The UV wavelength detection was set to 278 nm. The mobile phase was a mixture of a gradient of ultrapure water (with 0.1% formic acid) and acetonitrile (with 0.1% formic acid) which was thermoregulated at 30 °C. The flow rate was 0.4 mL min−1 and the
volume of injection was 10 µL. The gradient for the mobile phase is reported in theTable 2.
5.1, 9.9 and 12.1 min were the retention times of SALBU, CIP and SMX, respectively. The detection limit of CIP and SMX was 10 µg L−1
and of SALBU was 100 µg L−1. The analytical errors ranged from 0.2%
to 1%.
Concentrations of urea were determined by a L-Arginine/Urea/ Ammonia kit (Nzytech, Portugal). The principle of the measure is shown in Eqs.(2) and (3). The amount of nicotinamide adenine dinu-cleotide phosphate (NADP+, measured at UV 340 nm) was formed
through the combined action of urease (URE) and glutamate dehy-drogenase (GlDH).
+ ⎯ →⎯⎯⎯ +
Urea H O2 URE 2NH3 CO2 (2)
+ + +⎯ →⎯⎯⎯⎯ + ++
Oxoglutarate NADPH NH L Glutamate NADP H O
2– 4 GIDH – 2
(3) The sensitivity of the assay was based on 0.005 absorbance units and a sample volume of 2.00 ml. The detection limit of urea was 0.13 mg L−1. The relative standard deviation of the urea test was 3%.
2.3. Electrochemical cell and reactor
Cyclic voltammograms were carried out in a conventional three-electrode cell of 100 mL capacity using a computer-controlled Autolab potentiostat Model 30. A BDD anode of 0.196 cm2 from Adamant
(Switzerland) was used as the working electrode, a Pt wire as the counter electrode and a Hg/Hg2Cl2/Cl− (sat) electrode (SME) as the
reference electrode. Before each experiment, the electrode was pre-treated using anodic polarisation at 2.84 V/SHE for 40 s into a 1 M H2SO4solution.
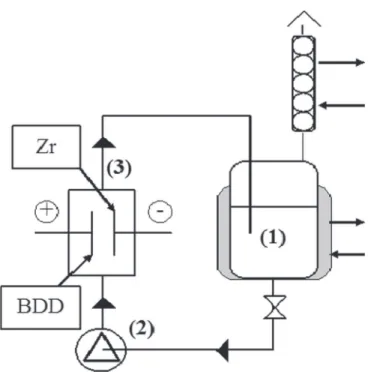
Electrolyses were conducted at 30 °C in a one-compartment flow filterpress reactor (3) under galvanostatic conditions. The experimental solution was stored in a 1-litre thermoregulated glass reservoir (1) and circulated through the electrolytic cell using a centrifugal pump (2) (Fig. 1). The flow rate was 360 L h−1.
The electrodes were two discs of 69 cm2of active surface each,
se-parated by 10 mm between them. The BDD anode from Adamant
(Switzerland) was elaborated by chemical vapour deposition on a conductive substrate of silicium. The thickness of BDD is 2–3 μm, the boron concentration is 500 ppm and the initial sp3/sp2 ratio is in the range of 100–300. The cathode was a 1-mm thick disc of zirconium. The current was supplied by an ELCAL 924 power supply. Before each electrolysis, the working electrodes were anodically pretreated (40 mA cm−2 for 30 min in a 0.1 M K
2SO4 solution) to clean their
surfaces of any possible adsorbed impurities. Then the system was rinsed with ultrapure water. Samples were taken at regular intervals in the tank. The overall volume of samples was less than 10% of the total volume. K2SO4was used in this study as the electrolyte at two different
concentrations and pH: 0.1 M at pH = 4 (adjusted with concentrated H2SO4) and 0.02 M at pH = 6.
In the present study, the flow rate was 360 L h−1 at 30 °C. At
360 L h−1, the mass transfer coefficient has been estimated to be
2.30 × 10⁻⁵m s−1at 30 °C in a preceding study[34].
3. Theory and mathematical model
A general illustration of the possible pathways of electroxidation of organics with the BDD anode is shown inFig. 2. The oxidation reactions can occur at the anode surface by direct transfer of electrons (1) for an electroactive organic or by unselective oxygen transfer via the hydroxyl radicals, %OH (4), generated by water discharge (2). Because of the weak interaction between the surface of BDD anode and the hydroxyl radical, %OH can be considered as quasi free on the surface[28]. If the amount of available %OH is higher than that required for the miner-alization of organics, complete minerminer-alization can be reached (7). Otherwise, it is possible to generate organic radicals (5) with chain reactions[35]. Oxidation via direct exchange of electrons occurs only at the anode surface and the reaction with %OH happens in a narrow zone adjacent to the electrode surface (< 1.0 µm).
3.1. Model description
The direct electroxidation can be written according to Eq.(4):
→ + −
Organic Product ne (4)
The corresponding limiting current density (jlim ne, −)which depends
on the mass transfer coefficient kd(m s−1) and the concentration of the
electroactive specie, C(t), can be defined by Eq.(5).
=
−
jlim ne, nFk C td ( ) (5)
wherejlim ne, −is the initial limiting current density of direct transfer of
electrons (A m−2), n is the number of exchanged electrons, F is Faraday
constant (96485 C mol−1) and C(t) is concentration of electroactive
species in the solution (mol m−3).
Consequently, the initial limiting current density (jlim ne0, −) can be
written as Eq.(6). = − jlim ne, nFk Cd 0 0 (6) C0is the initial concentration of the electroactive specie in the solution
(mol m−3).
When the current density, j, is lower than jlim ne, −, the oxidation
process is controlled by electron transfer. Whereas when j is higher than
Table 2
Gradient of the mobile phase for analysis of pharmaceuticals with ZORBAX Eclipse Plus C18 column.
Time (min) acetonitrile% (with 0.1% formic acid)
0 5
3 5
18 95
21 5
−
jlim ne, , the oxidation of water occurs and hydroxyl radicals are
gener-ated (Eq. (1)). Because these radicals are quasi free at the electrode surface, they can react actively with the organics, reaching complete mineralization. The equivalent number of exchanged electrons can be calculated with Eq.(7):
+ − → + + − ++ + − −
C H Ox y z (2x z H O) 2 xCO2 (4x y 2 )z H (4x y 2 )z e (7)
The equivalent number of exchanged electrons γ, is calculated by Eq.(8):
= + −
γ 4x y 2z (8)
In this case, the initial limiting current density that corresponds to the total mineralization of the organic specie (jlim OH0 ,
% , A m−2) can be
defined: it is a function of γ, kdand C0.
= + −
jlim OH, (4x y 2 )z Fk Cd
0 0
% (9)
When several organics are present in the solution, the limiting current density that corresponds to the total mineralization of the or-ganic matter is calculated from the sum of the limiting current densities
of each organic, i.
∑
∑
= = jlim OH j ( )i Fk γ C i lim OH d i i i , 0 , 0 0 % % (10) This model is based on the variation of the organic concentration, C(t), which depends only on the rate of organic oxidation, Γ, involving direct transfer of electrons and/or oxygen atom transfer:= − VdC t dt A ( ) Γ (11) V is the volume of the solution, A is the electrode surface (m2), Γ is the
total rate of organic destruction.
Depending on the value of the concentration of organics and the applied current density, three different regimes can be considered.
a) j ≤jlim ne, −
b) jlim ne, − < j < jlim OH,%
c) j > jlim OH,%
In this study, because the removal of organics using a BDD anode is efficient in the presence of %OH, the study model will be focused on the regions (b) and (c) where %OH are electrogenerated.
(a) j⩽jlim ne, −
In this regime, only direct exchanged electron occurs, the rate of organic destruction corresponds to the direct electrochemical oxidation rate, Γe−. This oxidation, governed by electron transfer, depends on the
applied current density j:
= −= j
nF
Γ Γe (12)
In the case of j = jlim,ne−, Γe−can be written by Eq.(13) = − j − nF Γe lim ne, 0 (13) (b) jlim ne, − <(j<jlim OH,%
For a current density higher thanjlim ne, −, the oxidation of water
oc-curs. Then the rate of organic oxidation is expressed by the sum of the rate of electrons transfer, Γe−,and the rate of reaction with%OH,Γ
OH % .
= −+
Γ Γe Γ%OH (14)
The mass balance of the organic specie can be expressed by Eq.(15).
= − −+ VdC t dt A ( ) (Γe Γ%OH) (15) here, the part of the current density used to generate %OH, j%OH,
re-presents the difference between the applied current density andjlim ne, −:
= − −
J%OH j jlim ne, (16)
According to Eqs. (7) and (8), the mineralization of one mol of CxHyOzconsumes γ mol of%OH. The reaction rate of organics with%OH
(
Γ%OH)
can be written by Eq.(17).= j
γF
Γ%OH %OH
(17) Combining Eqs.(12), (14) and (17),
= −⎛ ⎝ ⎜ + ⎞ ⎠ ⎟ − VdC t dt j nF j γF A ( ) lim ne, OH 0 % (18) n ≪ γ (see Table 4) for mainly organics, it can be assumed that
jOH= j, in this context combining Eq.(5), Eq.(18)and, t = 0, C = C0
gives the temporal variation of C:
Fig. 1. Discontinuous process with a single-compartment electrochemical reactor, (1) tank, (2) pump, (3) electrochemical cell.
Organic n e-Product H2O ·OH ROO ˙ CO2+H2O BDD Organic CO2 e-R˙ Organic radical chain reactions
1/2O2 O 2 X ˙ (1) (3) (4) (5) (6) (7) CO2+H2O… (2)
Fig. 2. Oxidation pathways of organics in a BDD anode system: (1) direct exchange of electrons, (2) electrogeneration of%OH, (3) generation of oxygen (4) formation of organic radicals via reactions between organics and hydroxyl radicals, (5) reactions between O2 and organic radicals, (6) reaction between peroxy radicals and organics in the solution, (7) complete mineralization.
= − + ⎛ ⎝− ⎞⎠ C t j γFk K exp Ak V t ( ) OH d d % (19) where K is a constant defined by Eq.(20).
= + K C j γFk OH d 0 % (20) This expression applies until a critical time (tcr), at which the
ap-plied current density (j) equals the limiting current density for miner-alization, jlim OH,% .
A characteristic parameter α is defined as
=
α j
jlim OH0 ,
% (21)
The concentration of organics on critical time is Ccrdefined by Eq.
(22)
= α
Ccr C0 (22)
Substituting Eq.(22)for Eq.(19), the critical time can be calculated as ⎜ ⎟ = − ⎛ ⎝ − + − ⎞⎠ t V Ak ln αγ αn γ αγ n 2 cr d (23)
As n ≪ γ, the function can be simplified:
= − ⎛ ⎝ + ⎞⎠ t V Ak ln α α 2 1 cr d (24)
In this region, the non-electroactive organics can be oxidized only via the chemical reaction with hydroxyl radicals. The reaction rate is written as
=
Γ Γ%OH (25)
Then, the variation of concentration of organics is expressed as:
= − C t C Aj γFVt ( ) 0 %OH (26) (c) j > jlim OH,%
When the applied current density exceeds the limiting current density for complete mineralization j > jlim OH,% , the%OH chain-reaction
rate is controlled by mass transfer. Under these experimental condi-tions, the flux of %OH is always higher than that required for the mi-neralization of organics. Consequently, the concentration of organic on the anode surface (Cs(t)) is zero. The reaction of organics for %OH
ra-dical-chain reactions is written as:
=k C t−C t =k C t
Γ%OH d( ( ) s( )) d ( ) (27)
Combining Eqs.(5), (13), and (27), Eq.(15)is written as Eq.(28)
= −
VdC t
dt Ak C t
( )
2 d ( ) (28)
Consequently, the temporal variation of organics can be calculated from Eq.(28). = ⎛ ⎝− ⎞⎠ C t C exp Ak V t ( ) 0 2 d (29) For non-electroactive organics,
= ⎛ ⎝− ⎞⎠ C t C exp Ak V t ( ) 0 d (30) The theoretical expressions for the temporal variation of the organic concentration in all conditions are summarized inTable 3.
3.2. Determination of model parameters
To validate the model, experiments were performed using different pharmaceutical compounds: ciprofloxacin (CIP), sulfamethoxazole (SMX) and salbutamol (SALBU), or a common organic compound (urea). The experimental data obtained from electrolysis were com-pared with the proposed model for which the parameters were pre-liminarily investigated. These parameters include the number of ex-changed electrons, n, and the equivalent electrons for complete mineralization, γ, depending on the electro -activity of the studied molecule on the BDD anode.
A typical cyclic voltamogram of a solution containing CIP is shown inFig. 3. An irreversible oxidation peak of CIP appears before the water discharge at 1 V/SCE. Similar electrochemical behaviour was obtained by Boudreau et al.[36]and Karuwan et al.[37]in a synthetic solution of SMX and SALBU on a BDD anode, respectively. For both cases, the authors observed the deposition of a polymeric film on the anode, be-fore the water discharge. The organic compounds undergo electron transfer at the anode, form phenolic radicals, recombine themselves and finally form a polymer. The activity of the electrode can be restored using an applied current density (or potential) that is sufficiently high to produce hydroxyl radicals, the “cleansing agent”.
In addition, An et al.[38]studied the chemical reaction between the hydroxyl radical and CIP. They reported a kinetic constant of
k%OH= 2.15 1010mol−1L−1s−1. The constant rate for the reaction of
OH radicals and SMX is also high and reaches 5.5 109mol−1L−1s−1
[39].
Consequently these three pharmaceuticals can be oxidized following two pathways: direct transfer of electrons and oxygen transfer via hy-droxyl radicals.
By contrast, Cataldo Hernández et al.[40]showed that urea is not electroactive because no direct transfer of electrons was observed on the BDD electrode.
The reaction of mineralization of CIP, SMX, SALBU and urea is presented by Eq.(31)–(35). All nitrogen atoms derived from organics are assumed to be converted into NO3−. During the mineralization of
organics, the number of exchanged electrons, n, and the equivalent electrons for complete mineralization, γ, are reported inTable 4.
+ → + −+ −+ ++ − C H FN O17 18 3 3 40H O2 17CO2 3NO3 F 98H 94e (31) + → + −+ −+ ++ − C H N O S10 11 3 3 30H O2 10CO2 3NO3 SO42 71H 66e (32) + → + −+ ++ − C H NO13 21 3 26H O2 13CO2 NO3 73H 72e (33) + → + −+ ++ − CH N O4 2 7H O2 CO2 2NO3 18H 16e (34)
4. Results and discussion 4.1. Influence of salts
Previous studies have shown that the presence of salts in the solu-tion, such as chloride and sulfate, can induce an increase in the removal
Table 3
Temporal variation of organic concentrations in all conditions. Operating current Electro activity Concentration
−
jlim ne, < j <jlim OH,% Yes C t( )= −j OH+Kexp
(
− t)
γFkd Akd V % (19) No C t( )=C−Aj OHt γFV 0 % (26)
j > jlim OH,% Yes C t( )=C exp
(
−Akdt)
V
0 2 (29)
No C t( )=C exp
(
−Akdt)
V
rate of pharmaceuticals [42–44]. In fact, strong oxidants can be elec-trogenerated from salts during electrochemical oxidation, in particular using a BDD anode. These oxidants react chemically with organics. SO4%−can react selectively and rapidly with pharmaceuticals that are
close to the anode surface, with in an order of 109
–1010M−1s−1[43].
For example, Radjenovic et al.[44]showed that the rate of SMX oxi-dation was 6 times higher in a sulfate anolyte compared to a nitrate
anolyte. By using scavengers of radicals (t-BuOH for%OH and EtOH for
both%OH and SO
4%−),[45]experimentally evidenced that SO4%−
ra-dicals take part in the oxidation of CIP as well as%OH. In addition, it has
been shown that the presence of sulfates accelerates the removal of CIP and SMX but their presence had no effect on the oxidation of SALBU [33]. This latter result highlights the selectivity of the reaction between organics and sulfate radicals.
Consequently, our model has been implemented with the con-sideration of these reactions. The total oxidation rate of organics is expressed by the sum of the rate of electron transfer, Γe−, the rate of reaction with%OH, Γ%
OHand the rate of reaction with SO4%−(called
salt effect: SE), ΓSE.
= −+ +
Γ Γe Γ%OH ΓSE (35)
The reaction rate, ΓSE(mol s−1),is described by a pseudo first-order
kinetic:
=
ΓSE k C(t)SE (36)
kSE(s−1) is the pseudo-first-order constant rate due to SE.
Taking into account the additional oxidation of the active electro-lyte, the oxidation rate is expressed by combining Eqs.(28) and (36):
= − − dC t dt Ak V C t k C t ( ) 2 ( ) ( ) d SE (37)
In the case of j > jlim OH,% , the temporal variation of organics can be
calculated from Eq.(38):
⎜ ⎟ = ⎛ ⎝−⎛⎝ + ⎞⎠⎞⎠ C t C exp Ak V k t ( ) 0 2 d SE (38) For non-electroactive organics,
⎜ ⎟ = ⎛ ⎝−⎛⎝ + ⎞⎠⎞⎠ C t C exp Ak V k t ( ) 0 d SE (39) To investigate the role of sulfate species and validate the im-plemented model (Eq. (39)), the results obtained from experiments were compared with the model using two concentrations of sulfate. Indeed, a previous study[33]showed that the amount of sulfate radi-cals is negligible in 0.02 M K2SO4in comparison with that of 0.1 M
K2SO4at pH = 4.Fig. 4shows the comparison of the temporal variation
of the normalized CIP concentration, using both electrolytes.
The acceleration of CIP oxidation is observed when the sulfate an-olyte concentration is the highest. In 100 min, 94% of CIP was removed
0.0E+00 5.0E-04 1.0E-03 1.5E-03 2.0E-03 0 0.5 1 1.5 i (A ) Potential (V / SCE) OH e -Electrolyte
Fig. 3. Cyclic voltammogram of CIP 0.068 mM in 0.1 M H2SO4. Working electrode: BDD (0.196 cm2), Counter electrode: Pt (1 cm2), Reference electrode: SCE. Scan rate: 100 mVs−1, ω = 800 rpm.
Table 4
Parameters used for model validation for CIP, SMX, SALBU and Urea. Ciprofloxacin (CIP) Sulfamethoxazole (SMX) Salbutamol (SALBU) Urea
Electroactivity Yes Yes Yes No
n 2[41] 1[42] 1[37] – γ 94 66 72 16 0 2 4 6 0 50 100 150 200 L n C 0/C EO Time (min)
(a)
0 2 4 6 0 50 100 150 200 L n C 0/C EO Time (min)(b)
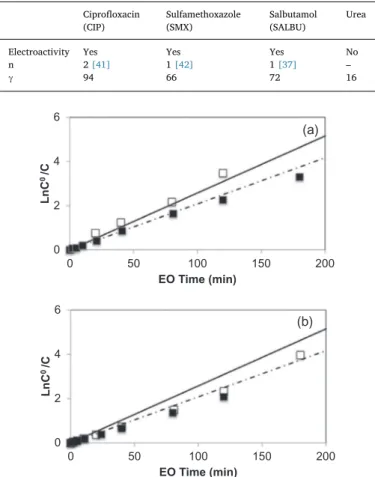
Fig. 4. The normalized concentration of CIP (a) and SALBU (b) during electrolyses: symbols: experimental data, line: model, j = 1.45 mA cm−2, j > j0
lim, kSE= 1.1 × 10⁻⁴s−1, T = 30 °C, in □K2SO40.1 M, pH = 4, range of potential differ-ence: 3.7–4.0 V; ■ K2SO40.02 M, pH range = 6.4–4, range of potential difference: 4.1–4.3 V, Simulated values calculated from: Eq.(38): – continuous line; from Eq.(29)— dashed line.
0
25
50
75
100
0
100
200
300
C/C
0(%
)
EO time (min)
Model for electroactive species Model for non-electroactive species CIP
SMX Urea
Fig. 5. Experimental (symbol) and simulated (line) concentrations of CIP, SMX, UREA values over time. Simulated values calculated from Eq.(29): – continuous line; Eq.(30)— dashed line. For j > jlim OH0,% , range of potential difference: 4.5–4.8 V,
kd= 2.3 × 10⁻⁵m s−1, kSE= 1.1 × 10⁻⁴s−1, T = 30 °C, pH = 4, [K2SO4] = 0.1 M. ▲ [CIP]0 = 53 μM, j
lim OHO,% = 1 mA cm−2, j = 7.2 mA cm−2. ● [SMX]0= 59 μM,
jlim OHO,% = 1 mA cm−2, j = 7.2 mA cm−2. Ο [Urea]°= 630 μM,jlim OH0,% = 2.5 mA cm−2,
in the highest concentration of K2SO4whereas it takes 150 min to reach
the same removal rate in 0.02 M K2SO4. Inversely,Fig. 4(b) shows that
the SALBU oxidation is independent of the K2SO4concentration, which
confirms that the sulfate radical is selective for the reaction with or-ganics.
The modelling degradation of pharmaceuticals, taking into account the active salt effect (0.1 M K2SO4) is calculated from Eq.(38). kSEin
this equation was experimentally estimated by electroxidation of SMX in K2SO4 0.1 M and 0.02 M electrolytes. Details are provided in
Supplementary Materials S1. A value of 1.1 × 10⁻⁴s−1was found for
kSE. This value is very close to the one provided in the literature:
1.3 × 10⁻⁴s−1[44].
The comparison of the experimental data and the model taking into account the reaction of CIP with the “activated” electrolyte (in the case of 0.1 M K2SO4) or without (in the case of 0.02 M K2SO4) shows a good
correlation. In addition, the model confirms the non-reaction between sulfate radicals and SALBU.
4.2. Influence of the electroactivity
Three electrolyses were performed with a solution containing a single organic: CIP, SMX and urea under mass transfer control condi-tions (j > jlim OH,% , 4.5–4.8 V was the measured difference of potential,
this value was stable during the electrolysis.Fig. 5illustrates the tem-poral variation of concentrations of these organics over electroxidation time. As expected, the complete removal of the electroactive organics (CIP and SMX) was obtained with quite similar degradation rates. In addition, the excellent correlation between the experimental data and predicted values with Eq.(29) is observed for electroxidation of all tested electroactive organics.
However, the degradation of the non-electroactive specie, urea, shows a lower rate, comparing to two electroactive pharmaceuticals under the same operating conditions. Indeed, the two pharmaceuticals, which are electroactive, can be oxidized through two pathways: direct and indirect exchange of electrons via%OH, while urea, which is non
electro-active, reacts only with hydroxyl radicals. There is a good cor-relation between experimental degradation of urea and the model for non-electroactive organics.
4.3. Influence of the current density
In order to investigate the influence of the applied current density on the degradation of pharmaceuticals, the electroxidation of CIP was performed at various applied current densities corresponding to dif-ferent regimes, jlim ne∘ , − < j < jlim OH∘ ,% and j > jlim OH∘ ,% . The operating
Table 5
Applied current density, initial limiting current and the calculated critical time for the electrolyses.
[CIP]0(μM) j (mA cm−2)
−
jlim ne0, (mA cm−2) jlim OH0 %, (mA cm
−2) α tcr(min) − jlim ne, 0 < j < jlim OH, 0 % 52 0.72 0.023 0.90 0.8 34 j > jlim OH, 0 % 62 1.45 0.027 1.07 1.36 – 59 7.24 0.026 1.02 7.10 – 0 25 50 75 100 0 100 200 300 [CIP]/[CIP] 0(% ) EO time (min) t = tcr
(a)
< j < j > 0 25 50 75 100 0 100 200 300 [CIP]/[CIP] 0(%
)
EO time (min) j = 1.45 j = 7.24 mA/cm2 mA/cm2(b)
Fig. 6. Experimental (symbol) and simulated (line) values of concentration versus elec-troxidation time kd= 2.3 × 10⁻⁵m s−1, kSE= 1.12 × 10⁻⁴s−1, T = 30 °C, pH = 4, [K2SO4] = 0.1 M, [CIP]0= 0.052 mM. (a) jlim,ne−0 < j < jlim OH0, (Eq.(19)), continuous
line – ; j >jlim OH,% (Eq.(29)), dashed line —, j = 0.72 mA cm−2, range of potential
dif-ference: 3–3.9 V. (b) j > jlim OH0,% simulated values calculated from Eq.(38), j = 1.45 and
7.24 mA cm−2, range of potential difference: 3.7–4.0 and 4.5–4.8 V.
Table 6
Composition of solutions, limiting and applied current density of electrolysis ofFig. 7.
Organics Electro-activity C0(μM) jlim OH0,% (mAcm−2) j (mAcm−2)
Single solution CIP Yes 69 1.20 7.24 Multi-Component solutions CIP Yes 42 1.30 7.24 Urea No 90 CIP Yes 76 2.51 7.24 SMX Yes 60
0
25
50
75
100
0
100
200
300
[CIP]/[CIP] 0(% )EO time (min)
Model CIP CIP+SMX CIP+UreaFig. 7. Experimental (symbol) and simulated (line) concentrations of CIP during elec-trolysis of solutions (given in Table 5) at j >jlim OH,
0
% , kd= 2.3 × 10⁻⁵m s−1, kSE= 1.12 × 10⁻⁴s−1, T = 30 °C, pH = 4, range of potential difference: 4.5–4.8 V, electrolyte: K2SO40.1 M.
conditions of each electrolysis are presented inTable 5and the varia-tion of CIP during electrolysis is shown inFig. 6. It can be observed in Fig. 6(a) that the model correlates well with the experimental data for both regimes: j0 lim,ne−< j < jlim OH, 0 % ·and j > jlim OH, 0 % .Fig. 6(b) shows
that for two current densities (j = 1.45 and 7.24 mA cm−2), CIP
con-centration decreases with the same rate and 100% of CIP was removed after 180 min of electrolysis. The removal rate of CIP is unlikely to depend on the applied current intensity when operating in the regime of j >jlim OH0 ,
% . Furthermore the model is validated for all applied current
densities.
4.4. In the presence of other organics
Electrolyses were performed in two multicomponent solutions containing pharmaceuticals or common organic. The variation of the CIP concentration during electrolysis has been compared with the one obtained in a single solution. For each case, the electrolysis was con-trolled by mass transfer (j > jlim OH0 , ).
% The operating conditions are
shown inTable 6.
Fig. 7presents the experimental and simulated variation of the CIP concentrations during electrolysis in different solutions (single and multi-component solutions).
After 180 min the removal of CIP is complete for all solutions, which indicates that the presence of other compounds (SMX or Urea) has no significant impact on the CIP oxidation rate. Excellent correlation of experimental and modelling simulation were obtained.
It can be expected that this model can be applied to wastewater that contains more organics to predict the temporal concentration of various target organic compounds.
5. Conclusion
An easy-to-use model has been proposed and validated by the ex-perimental results to predict the variation of the concentration of a target organic in the electrochemical oxidation process using a BDD anode. The contribution of the types of transfers in the oxidation pro-cess has been emphasized: electrons (direct oxidation), atoms of oxygen via the reaction with either hydroxyl radicals or with strong electro-generated oxidants. The proposed model showed a strong correlation between the experimental data obtained for various operating condi-tions : concentracondi-tions of sulfate, current densities.
Because real solutions always contain other organic compounds, a study was performed by taking into account the presence of another pharmaceutical compound (SMX) or a common organic compound (urea). In each case, the experiment and the modelling showed that the presence of such compounds did not affect the degradation of the target compound, ciprofloxacin.
In addition, this model was implemented to take into account the effect of salts. Indeed, the presence of some anions, under polarization, can generate powerful oxidants and so accelerate the degradation of target molecules. For example, it was shown that 50% gain in time for electrolysis was obtained in the presence of sulfate for the complete removal the CIP antibiotic.
In summary, regarding the target molecule, to use this model, the input parameters are: the number of exchanged electrons for direct oxidation, n; the electroactivity on BDD; in the case of the presence of electroactive salts (such as sulfate), the reaction rate with the electro-generated oxidants from salts (described and estimated by a pseudo-first-order kinetic in this study). The excellent correlation between ex-perimental results and predicted values from the model simulations in all conditions indicate that this model enables a wide application to predict the oxidation behaviour of electroactive and non-electroactive organics at various applied current densities in single and mixed solu-tions.
Acknowledgements
The authors would like to thank the China scholarship council for the final support and Sophie Chambers for proofreading and correcting the manuscript.
Appendix A. Supplementary data
Supplementary data associated with this article can be found, in the online version, athttp://dx.doi.org/10.1016/j.cej.2017.09.164. References
[1] R. Wise, Antimicrobial resistance: priorities for action, J. Antimicrob. Chemother. 49 (2002) 585–586.
[2] K. Kümmerer, A. Al-Ahmad, V. Mersch-Sundermann, Biodegradability of some an-tibiotics, elimination of the genotoxicity and affection of wastewater bacteria in a simple test, Chemosphere 40 (2000) 701–710.
[3] M. Clara, N. Kreuzinger, B. Strenn, O. Gans, H. Kroiss, The solids retention time—a suitable design parameter to evaluate the capacity of wastewater treatment plants to remove micropollutants, Water Res. 39 (2005) 97–106.
[4] A.L. Batt, I.B. Bruce, D.S. Aga, Evaluating the vulnerability of surface waters to antibiotic contamination from varying wastewater treatment plant discharges, Environ. Pollut. 142 (2006) 295–302.
[5] E. Zuccato, D. Calamari, M. Natangelo, R. Fanelli, Presence of therapeutic drugs in the environment, The Lancet. 355 (2000) 1789–1790.
[6] J. Zhou, H. Hong, Z. Zhang, K. Maskaoui, W. Chen, Multi-phase distribution of organic micropollutants in Xiamen Harbour, China, Water Res. 34 (2000) 2132–2150.
[7] D.W. Kolpin, E.T. Furlong, M.T. Meyer, E.M. Thurman, S.D. Zaugg, L.B. Barber, H.T. Buxton, Pharmaceuticals, Hormones, and Other Organic Wastewater Contaminants in U.S. Streams, 1999–2000: A National Reconnaissance, Environ. Sci. Technol. 36 (2002) 1202–1211.
[8] X. Chang, M.T. Meyer, X. Liu, Q. Zhao, H. Chen, J. Chen, Z. Qiu, L. Yang, J. Cao, W. Shu, Determination of antibiotics in sewage from hospitals, nursery and slaughter house, wastewater treatment plant and source water in Chongqing region of Three Gorge Reservoir in China, Environ. Pollut. 158 (2010) 1444–1450. [9] A.J. Watkinson, E.J. Murby, D.W. Kolpin, S.D. Costanzo, The occurrence of
anti-biotics in an urban watershed: from wastewater to drinking water, Sci. Total Environ. 407 (2009) 2711–2723.
[10]K.S. Le Corre, C. Ort, D. Kateley, B. Allen, B.I. Escher, J. Keller, Consumption-based approach for assessing the contribution of hospitals towards the load of pharma-ceutical residues in municipal wastewater, Environ. Int. 45 (2012) 99–111. [11]A.C. Johnson, M.D. Jürgens, R.J. Williams, K. Kümmerer, A. Kortenkamp,
J.P. Sumpter, Do cytotoxic chemotherapy drugs discharged into rivers pose a risk to the environment and human health? An overview and UK case study, J. Hydrol. 348 (2008) 167–175.
[12]G.T. Ankley, B.W. Brooks, D.B. Huggett, J.P. Sumpter, Repeating History: Pharmaceuticals in the Environment, Environ. Sci. Technol. 41 (2007) 8211–8217. [13]G.M. Bruce, R.C. Pleus, S.A. Snyder, Toxicological Relevance of Pharmaceuticals in
Drinking Water, Environ. Sci. Technol. 44 (2010) 5619–5626.
[14]B.P. Chaplin, Critical review of electrochemical advanced oxidation processes for water treatment applications, Environ. Sci. Process. Impacts. 16 (2014) 1182–1203. [15]R. Tenne, K. Patel, K. Hashimoto, A. Fujishima, An international journal devoted to
all aspects of electrode kinetics, interfacial structure, properties of electrolytes, colloid and biological electrochemistry efficient electrochemical reduction of ni-trate to ammonia using conductive diamond film electrodes, J. Electroanal. Chem. 347 (1993) 409–415.
[16]G.V. Buxton, C.L. Greenstock, W.P. Helman, A.B. Ross, Critical Review of rate constants for reactions of hydrated electrons, hydrogen atoms and hydroxyl radicals (radOH/radO− in Aqueous Solution, J. Phys. Chem. Ref. Data. 17 (1988) 513–886. [17]E. Brillas, I. Sirés, C. Arias, P.L. Cabot, F. Centellas, R.M. Rodríguez, J.A. Garrido,
Mineralization of paracetamol in aqueous medium by anodic oxidation with a boron-doped diamond electrode, Chemosphere 58 (2005) 399–406.
[18]M. Murugananthan, S.S. Latha, G. Bhaskar Raju, S. Yoshihara, Role of electrolyte on anodic mineralization of atenolol at boron doped diamond and Pt electrodes, Sep. Purif. Technol. 79 (2011) 56–62.
[19]K.P. de Amorim, L.L. Romualdo, L.S. Andrade, Electrochemical degradation of sulfamethoxazole and trimethoprim at boron-doped diamond electrode: Performance, kinetics and reaction pathway, Sep. Purif. Technol. 120 (2013) 319–327.
[20]A. Dirany, I. Sirés, N. Oturan, A. Özcan, M.A. Oturan, Electrochemical Treatment of the Antibiotic Sulfachloropyridazine: Kinetics, Reaction Pathways, and Toxicity Evolution, Environ. Sci. Technol. 46 (2012) 4074–4082.
[21] R.G. Rice, M.E. Browning, R.S.K.E.R. Laboratory, J.E. Group, A.C. Corporation, I.O. Association, Ozone for industrial water and wastewater treatment: a literature survey, Robert S. Kerr Environmental Research Laboratory, Office of Research and Development, U.S. Environmental Protection Agency, 1980.
[22]G. Pérez, A.R. Fernández-Alba, A.M. Urtiaga, I. Ortiz, Electro-oxidation of reverse osmosis concentrates generated in tertiary water treatment, Water Res. 44 (2010) 2763–2772.
2-naphthol at boron-doped diamond electrodes, J. Electroanal. Chem. 507 (2001) 206–214.
[24] O. Scialdone, Electrochemical oxidation of organic pollutants in water at metal oxide electrodes: A simple theoretical model including direct and indirect oxidation processes at the anodic surface, Electrochim. Acta 54 (2009) 6140–6147. [25] P. Cañizares, J. García-Gómez, J. Lobato, M.A. Rodrigo, Modeling of Wastewater
Electro-oxidation Processes Part I. General Description and Application to Inactive Electrodes, Ind. Eng. Chem. Res. 43 (2004) 1915–1922.
[26] M. Mascia, A. Vacca, S. Palmas, A.M. Polcaro, Kinetics of the electrochemical oxi-dation of organic compounds at BDD anodes: modelling of surface reactions, J. Appl. Electrochem. 37 (2007) 71–76.
[27] M. Mascia, A. Vacca, A.M. Polcaro, S. Palmas, J.R. Ruiz, A. Da Pozzo, Electrochemical treatment of phenolic waters in presence of chloride with boron-doped diamond (BDD) anodes: Experimental study and mathematical model, J. Hazard. Mater. 174 (2010) 314–322.
[28] A. Kapałka, G. Fóti, C. Comninellis, The importance of electrode material in en-vironmental electrochemistry: Formation and reactivity of free hydroxyl radicals on boron-doped diamond electrodes, Electrochim. Acta 54 (2009) 2018–2023. [29] K. Groenen-Serrano, E. Weiss-Hortala, A. Savall, P. Spiteri, Role of Hydroxyl
Radicals During the Competitive Electrooxidation of Organic Compounds on a Boron-Doped Diamond Anode, Electrocatalysis. 4 (2013) 346–352.
[30] P. Verlicchi, M. Al Aukidy, A. Galletti, M. Petrovic, D. Barceló, Hospital effluent: Investigation of the concentrations and distribution of pharmaceuticals and en-vironmental risk assessment, Sci. Total Environ. 430 (2012) 109–118.
[31] M. Gros, M. Petrović, A. Ginebreda, D. Barceló, Removal of pharmaceuticals during wastewater treatment and environmental risk assessment using hazard indexes, Environ. Int. 36 (2010) 15–26,http://dx.doi.org/10.1016/j.envint.2009.09.002. [32] S. Castiglioni, R. Bagnati, R. Fanelli, F. Pomati, D. Calamari, E. Zuccato, Removal of
Pharmaceuticals in Sewage Treatment Plants in Italy, Environ. Sci. Technol. 40 (2006) 357–363.
[33] Y. Lan, C. Coetsier, C. Causserand, K. Groenen Serrano, On the role of salts for the treatment of wastewaters containing pharmaceuticals by electrochemical oxidation using a boron doped diamond anode, Electrochim. Acta. 231 (2017) 309–318. [34] C. Racaud, A. Savall, P. Rondet, N. Bertrand, K. Groenen, Serrano, New electrodes
for silver(II) electrogeneration: Comparison between Ti/Pt, Nb/Pt, and Nb/BDD, Chem. Eng. J. 211–212 (2012) 53–59.
[35]G. Scholes, J. Weiss, Oxygen Effects and Formation of Peroxides in Aqueous Solutions, Radiat. Res. Suppl. 1 (1959) 177–189.
[36]J. Boudreau, D. Bejan, S. Li, N.J. Bunce, Competition between Electrochemical Advanced Oxidation and Electrochemical Hypochlorination of Sulfamethoxazole at a Boron-Doped Diamond Anode, Ind. Eng. Chem. Res. 49 (2010) 2537–2542. [37]C. Karuwan, T. Mantim, P. Chaisuwan, P. Wilairat, K. Grudpan, P. Jittangprasert,
Y. Einaga, O. Chailapakul, L. Suntornsuk, O. Anurukvorakun, D. Nacapricha, Pulsed Amperometry for Anti-fouling of Boron-doped Diamond in Electroanalysis of β-Agonists: Application to Flow Injection for Pharmaceutical Analysis, Sensors. 6 (2006) 1837–1850.
[38]T. An, H. Yang, G. Li, W. Song, W.J. Cooper, X. Nie, Kinetics and mechanism of advanced oxidation processes (AOPs) in degradation of ciprofloxacin in water, Appl. Catal. B Environ. 94 (2010) 288–294.
[39]M.M. Huber, A. GÖbel, A. Joss, N. Hermann, D. LÖffler, C.S. McArdell, A. Ried, H. Siegrist, T.A. Ternes, U. von Gunten, Oxidation of Pharmaceuticals during Ozonation of Municipal Wastewater Effluents: A Pilot Study, Environ. Sci. Technol. 39 (2005) 4290–4299.
[40]M. Cataldo Hernández, N. Russo, M. Panizza, P. Spinelli, D. Fino, Electrochemical oxidation of urea in aqueous solutions using a boron-doped thin-film diamond electrode, Diam. Relat. Mater. 44 (2014) 109–116.
[41]L. Fotouhi, M. Alahyari, Electrochemical behavior and analytical application of ciprofloxacin using a multi-walled nanotube composite film-glassy carbon elec-trode, Colloids Surf. B Biointerfaces. 81 (2010) 110–114.
[42]R. Goyal, A. Srivastava, Electrochemical oxidation of sulfamethoxazole at pyrolytic-graphite electrode - an example of free-radical dimerization, indian, J. Chem. Sect. -Inorg. Bio-Inorg. Phys. Theor. Anal. Chem. 29 (1990) 635–638.
[43]P. Neta, V. Madhavan, H. Zemel, R.W. Fessenden, Rate constants and mechanism of reaction of sulfate radical anion with aromatic compounds, J. Am. Chem. Soc. 99 (1977) 163–164.
[44]J. Radjenovic, M. Petrovic, Removal of sulfamethoxazole by electrochemically ac-tivated sulfate: Implications of chloride addition, J. Hazard. Mater. 333 (2017) 242–249.
[45]Y. Ji, C. Ferronato, A. Salvador, X. Yang, J.-M. Chovelon, Degradation of cipro-floxacin and sulfamethoxazole by ferrous-activated persulfate: Implications for re-mediation of groundwater contaminated by antibiotics, Sci. Total Environ. 472 (2014) 800–808.
![Fig. 6. Experimental (symbol) and simulated (line) values of concentration versus elec- elec-troxidation time k d = 2.3 × 10 −5 m s −1 , k SE = 1.12 × 10 −4 s −1 , T = 30 °C, pH = 4, [K 2 SO 4 ] = 0.1 M, [CIP] 0 = 0.052 mM](https://thumb-eu.123doks.com/thumbv2/123doknet/2973246.82793/8.892.444.833.157.505/fig-experimental-symbol-simulated-values-concentration-versus-troxidation.webp)
