HAL Id: hal-01192679
https://hal-iogs.archives-ouvertes.fr/hal-01192679
Submitted on 3 Sep 2015
HAL is a multi-disciplinary open access
archive for the deposit and dissemination of
sci-entific research documents, whether they are
pub-lished or not. The documents may come from
teaching and research institutions in France or
abroad, or from public or private research centers.
L’archive ouverte pluridisciplinaire HAL, est
destinée au dépôt et à la diffusion de documents
scientifiques de niveau recherche, publiés ou non,
émanant des établissements d’enseignement et de
recherche français ou étrangers, des laboratoires
publics ou privés.
towards fibered Raman-free correlated photon sources
Margaux Barbier, Isabelle Zaquine, Philippe Delaye
To cite this version:
Margaux Barbier, Isabelle Zaquine, Philippe Delaye. Spontaneous four-wave mixing in liquid-core
fibers: towards fibered Raman-free correlated photon sources . New Journal of Physics, Institute of
Physics: Open Access Journals, 2015, 17, pp.053001(1-11). �10.1088/1367-2630/17/5/053031�.
�hal-01192679�
M Barbier1,3, I Zaquine2and P Delaye1
1 Laboratoire Charles Fabry, Institut d’Optique, CNRS, Univ Paris-Sud, 2 avenue Augustin Fresnel, 91127 Palaiseau, France 2 Laboratoire Traitement et Communication de l’Information, CNRS, Télécom Paristech, 46 rue Barrault, 75013 Paris, France 3 Current address: Optics Laboratory, Tampere University of Technology, Korkeakoulunkatu 3, 33720 Tampere, Finland E-mail:margaux.barbier@institutoptique.frandmargaux.barbier@tut.fi
Keywords: correlated photon pairs, spontaneous four-wave mixing, liquid-core photonic crystal fibers
Abstract
We experimentally demonstrate, for the first time to our knowledge, the generation of correlated
photon pairs in a liquid-core photonic crystal fiber. Moreover, we show that, thanks to the specific
Raman properties of liquids, the Raman noise (which is the main limitation of the performance of
silica-core fiber-based correlated photon pair sources) is highly reduced. With a demonstrated
coincident-to-accidental ratio equal to 63 and a pair generation efficiency of about 10
−4per pump
pulse, this work contributes to the development of high-quality correlated photon pair sources for
quantum communications.
1. Introduction
Spontaneous four-wave mixing (FWM) is a third-order nonlinear process in which two pump photons are annihilated to create a pair of signal and idler photons whose wavelengths are governed by the energy and momentum conservation conditions [1]. The signal and idler photons from the same pair are generated simultaneously, and that is why they are said to be temporally correlated. This process can occur inside the core of an optical fiber if the pump wavelength is close to the zero-dispersion wavelength of the fiber (to satisfy both the energy and momentum conservation conditions) [2,3]. Thus it is advantageous to use silica-core photonic crystal fibers (PCFs) [4], whose dispersion properties (and particularly the zero-dispersion wavelength) can be adjusted by adequately designing the microstructuring geometry [5], because it allows one to choose the spectral properties (spectral emission range and spectral width) of the correlated photon pair source [6–9].
From such a correlated photon pair source, it is possible to produce entangled photon pairs [9], which are actually the key to a lot of quantum information devices (for quantum communications, quantum
cryptography, quantum computation, etc) as well as fundamental quantum tests (violation of Bell’s inequalities) [10]. More precisely, fiber-based correlated photon pair sources are of high interest in the field of quantum communications, because a fibered architecture allows one to minimize the coupling losses when connecting the source to the other components of the telecommunication network.
In the early 2000s, the first studies about the generation of correlated photon pairs by spontaneous FWM in conventional and microstructured silica-core fibers highlighted the fact that the performance of these sources was limited in terms of quantum purity because of the spontaneous Raman scattering (SpRS) process [9,11–14]. Indeed, the Raman spectrum of silica is very broad (≈40 THz of total width, with≈7THz full-width at half maximum (FWHM) [2]) and thus, regardless of the wavelengths of the emitted correlated photons, some uncorrelated Raman photons are also generated at these wavelengths in the silica core of the fiber. Such non-filterable noise photons strongly reduce the purity of the correlated photon pair source. Note that this issue is common to all glass fibers and waveguides (chalcogenide, fluoride...), since all amorphous materials exhibit broad Raman spectra [14–16].
One of the first approaches that have been investigated in order to overcome this limitation was to cool the device down to 77 K [17] or even 4 K [13], which results in drastically reducing the efficiency of the SpRS
14 February 2015
REVISED
12 April 2015
ACCEPTED FOR PUBLICATION
21 April 2015
PUBLISHED
20 May 2015 Content from this work may be used under the terms of theCreative Commons Attribution 3.0 licence.
Any further distribution of this work must maintain attribution to the author(s) and the title of the work, journal citation and DOI.
process. The main drawback of this method lies in the complexity of the experimental setup used for cooling, making it less practical for applications. Another approach was to exploit cross-polarized phase-matching configurations in a birefringent fiber [11]. In such a configuration, the emitted correlated photons are cross-polarized with the pump photons, whereas the Raman photons remain mainly co-cross-polarized with the pump photons. Consequently, the Raman photons can be separated from the correlated photons using a polarizer. However, cross-polarized Raman photons remain a problem [18]. By using an adequately designed
microstructured fiber, it is also possible to work in the normal dispersion regime of the fiber and thus to get a very high spectral gap between the pump photons and the generated correlated photons [2,8]. For spectral gaps higher than 40 THz, the efficiency of the SpRS process becomes negligible. However, as shown by Rarity et al [19] and by Cui et al [20], multiphonon Raman scattering can still be troublesome. Finally, one can decide to replace the glass fiber by a crystalline (e.g., silicon) waveguide with the advantage of a thin-line Raman spectrum. It is then possible to avoid the generation of Raman photons at the wavelengths of the correlated photons by adequately choosing the pump wavelength [21–25]. The drawback of this option is the high coupling losses of the waveguide to an optical fiber, which makes it ill-adapted to fibered telecommunication networks. Nevertheless, silicon photonic devices have been recently widely investigated on the way towards new planar optical integrated circuit technologies [26–28].
Our approach is conceptually close to this last idea, since it consists in replacing silica with a material exhibiting a thin-line Raman spectrum. In order to keep a fibered architecture and to get a compact and easy-to-use device, we have chosen to easy-to-use a liquid-filled hollow-core PCF. This choice was guided by a number of previously reported investigations: first, dealing with the linear properties of such liquid-core PCFs and showing that the transmission spectral band and the zero-dispersion wavelength do not only depend on the
microstructuring geometry of the fiber, but also on the linear refractive index of the filling liquid [29]; and second addressing their nonlinear properties, focusing on two main aspects: 1) The self-phase modulation process [2] has been exploited to measure the nonlinear refractive indices of liquids [30,31], and 2) The stimulated Raman scattering process has been extensively studied [32–35], leading to the development of efficient single-mode Raman converters with high spectral flexibility. These converters take advantage of both the special Raman properties of liquids (particularly their usual thin-line Raman spectra, with typical widths in the tens of GHz range, i.e., two to three orders of magnitude thinner than the 7-THz-FWHM Raman spectrum of silica) and the flexibility of the liquid-core fiber architecture in terms of transmission band positioning (see [32–35] for more details). Our point is that these two features can be also exploited to drastically reduce the SpRS noise in fibered sources of correlated photon pairs: by adequately choosing the microstructuring geometry of the hollow-core PCF, the linear refractive index of the liquid, and the pump wavelength, it becomes possible to generate the photon pairs outside the thin Raman lines of the liquid (which is not possible with the broad continua of the Raman spectra in glass materials). As a result, the Raman photons that are generated in the core of the fiber can be filtered out, as their wavelengths are well-separated from those of the emitted correlated photons. Moreover, by conveniently choosing the experimental parameters, one can find an even better configuration in which the major Raman lines of the liquid (i.e., the most intense lines) are rejected outside the transmission band of the fiber, as illustrated in figure1. In this way, the main part of the SpRS process is already filtered out by the transmission band of the fiber.
In this paper, we present the first experimental demonstration of the generation of correlated photon pairs in a liquid-core PCF, and we provide the experimental proof of principle for the huge potential of the liquid-core fibered architecture on the way to the development of high-quality correlated photon pair fibered sources for quantum telecommunication networks. The paper is organized as follows. Section2starts with a brief description of the linear and nonlinear properties of the liquid-core fiber involved in our experiments. In section3we describe the experimental setup used to generate and detect the correlated photon pairs. Section4is devoted to our experimental results and is split into two parts: 1) detection rate measurements, providing the experimental evidence of photon pair generation from a nonlinear optics point of view, and 2) coincident count measurements, corresponding to the quantum optics vision of the correlated pairs. These results are discussed and compared to previously reported ones in section5before the conclusion is drawn in section6.
2. Linear and nonlinear properties of the liquid-core fiber
We use a commercially available 1 meter-long hollow-core PCF (HC-1550-PM-01 from NKT Photonics, with a core diameter of 12 μm and a cladding pitch of 4.0 μm) filled with deuterated acetone. This hollow-core PCF has been initially designed to exhibit a strong polarization-maintaining property, and once filled with deuterated acetone two principal axes can still be clearly identified (even if the birefringence is slightly reduced). The choice of the liquid relies on three main criteria: 1) its non-toxicity, 2) its negligible absorption in our working spectral range (between 700–1000 nm typically), and 3) its linear refractive index close to 1.36, which permits one to shift
the transmission band of the PCF from around 1550 nm (filled with air) to around 900 nm (filled with
deuterated acetone), according to the shifting law given in [29]. To experimentally confirm the value of this shift, a supercontinuum source was used to measure the transmission band of the liquid-core fiber, showing that it ranges typically from 820–925 nm (see transmission band in figure1). As a result, the transmission band matches the spectral tunability range of the Ti:Sapphire laser used as the pump for our spontaneous FWM experiments. This transmission band measurement also confirms that the main Raman lines of deuterated acetone (with Raman shifts around 2100 cm−1) are rejected outside the transmission band, while three minor
Raman lines (at 331 cm−1
, 410 cm−1
, and 478 cm−1
) are still included (see figure2) and must be avoided by adequately choosing the pump wavelength for the FWM process (this point will be discussed in more details in the following section). The 1-meter fiber length allowed a reasonable core-filling time together with a good precision on the preliminary linear and nonlinear characterization.
One-picosecond pulses emitted by a tunable mode-locked Ti:Sapphire pump laser are injected in the liquid-core fiber, with a repetition rate of 80 MHz, after filtering out the broadband residual fluorescence background of the laser to a negligible level (attenuation of 50 dB at least). Even though this kind of fiber architecture, based on commercial fibers initially optimized for empty uses, is usually slightly multimode [33], a fine adjustment allows one to stably inject the pump pulses in the Gaussian fundamental mode [30] (as was easily checked in our experiments by regularly imaging the output face of the fiber on a CCD camera). The pump transmission, including both coupling and mode propagation losses, is greater than 40% and can be as large as 50%. Noting that some previous measurements performed with similar fibers led to propagation losses of the order of 0.75 dB m−1
[30], we can reasonably consider that the greatest part of the 3-dB transmission loss is rather related to imperfect coupling.
Taking advantage of the tunability of the Ti:Sapphire pump source, the group-velocity dispersion (GVD) curveβ2of the liquid-core fiber was experimentally determined (by an interferometric time-of-flight measurement) and led in particular to a zero-dispersion wavelength (λZDW) equal to(896±1) nm (see figure3
and appendixA).
Figure 1. Both on the Stokes (λ λ> p, withλpthe pump wavelength) and anti-Stokes (λ λ< p) sides, the major Raman lines of the
liquid can be placed outside the transmission band, and the minor Raman lines that are still included can also be avoided, since they are spectrally thin. (Following the convention given by Agrawal in [2] and Marhic in [3], the signal and idler wavelengths—λsandλ ,i
respectively—verifyλs>λpandλi<λp.)
Finally, by exploiting the self-phase modulation-induced spectral broadening of the pump pulses [30], the nonlinear coefficient γ of the fiber [2] was measured to be equal to(0.012±0.002) m−1
W−1
. Given the values of the nonlinear refractive index of deuterated acetone (n2=5.2×10⁻²⁰m2W−1according to [31]) and of the pump wavelength (λp≈ λZDW= 896nm), we could deduce the effective mode areaA ,eff thanks to the
following formula [2]:γ= n2π 2 (λpAeff). We foundAeff ≈ 30μm2, which is consistent with the specifications
of the liquid-core fiber and with some previous measurements performed with a similar fiber (with close microstructuring geometry and the same filling liquid) [31]. These results show that the nonlinear behavior of our liquid-core fiber is in agreement with what can be expected as far as the automatically phase-matched nonlinear process of self-phase modulation is concerned.
From these preliminary characterization steps, we were able to deduce the phase-matching curve for the FWM process in this fiber (see figure4, solid line), which is given by [2]:
β ω −β ω −β ω − γP =
2 ( p) ( s) ( i) 2 p 0, (1)
with β the propagation constant on the fundamental mode of the fiber,ωp,ω ,s andωithe pump, signal, and
idler angular frequencies, respectively, and Ppthe peak pump power. Experiments of parametric amplification
by FWM were also performed in order to confirm the validity of this phase-matching curve: in addition to the Ti: Sapphire picosecond pump pulses, we injected (in the fundamental mode of the fiber) a broadband pulsed signal [4] (temporally overlapped with the pump pulses). The output spectrum, acquired from an optical spectrum analyzer, confirmed that the amplification process actually occurs around the wavelengths predicted by the phase-matching curve (see dots in figure4).
3. Experimental setup
From the phase-matching curve plotted in figure4, we know, for given pump wavelength and power, which signal and idler wavelengths will be spontaneously generated with the highest probability. (Note that this
phase-Figure 3. Group-velocity dispersion (β2) curve of the liquid-core fiber (solid line), deduced from a time-of-flight measurement of the
group index variationsΔngon the fundamental mode of the fiber (dots).
Figure 4. Solid line: phase-matching curve for our liquid-core PCF, calculated from the characterization experimental data (for a peak pump power of 100 W). Dots: signal and idler wavelengths measured in the amplification regime. Dashed lines: minor Raman lines of deuterated acetone included inside the transmission band of our liquid-core PCF. Shaded area: working spectral range.
matching curve exhibits an uncertainty of a few nanometers, on both abscissa and ordinate, due to the uncertainties on the time-of-flight GVD measurement.) As a result, it allows us to define our working spectral range, which must satisfy the two following criteria:
1. The spectral gap between the pump photons and the correlated signal and idler photons must be of the order of 30 nm (i.e.,≈11THz, or≈375 cm−1), which is a compromise between a good transmission of the signal
and idler photons in the fundamental mode of the liquid-core fiber (see the transmission band in figure1) and a good filtering efficiency of the pump photons at the output of the liquid-core fiber;
2. The minor Raman lines of deuterated acetone (dashed lines in figure4) must be avoided.
One can see that we have to work with a pump wavelength (λp) between 880–887 nm typically (shaded area
in figure4). After some optimization steps, we choseλ = 885.5p nm, which leads to the generation of signal and
idler photons at 916 nm and 857 nm, respectively.
In order to separate the spontaneously generated signal and idler photons from each other and from the huge amount of remaining pump photons, we built a free-space two-arm double-grating spectrometer at the output of the liquid-core fiber (see figure5).
Signal (respectively idler) photons are sent into the first (respectively second) arm of the spectrometer, while the pump photons are eliminated (collected in a light trap). At the end of the arm, signal (respectively idler) photons are re-coupled into a single-mode fiber connected to a silicon avalanche-photodiode single-photon detector (SPD) (SPCM-AQRH-14 from Excelitas Technologies, with a dark count level of about 60 s−1
, a dead time equal to 20 ns, and a detection efficiency around 40% at 900 nm). The detection bandwidth is about 0.5 nm on both channels, and the total collection efficiency between the output of the source and the SPD (which includes the transmission of the spectrometer arm, the coupling efficiency in the collecting single-mode fiber, and the detection efficiency of the SPD) is ≈ 3%. Let us note that this global collection efficiency is not optimized and that much higher values could be obtained with a fibered pump filtering, using fiber Bragg gratings, for instance, which would totally avoid the free space part and therefore use the full potential of this fibered
generation of the photon pairs. For a spectral gap between the pump photons and the correlated photons of≈30 nm, we get a pump filtering efficiency of≈130 dB. Starting from approximately 107photons per pulse and given the measured≈ 3% collection efficiency for the correlated photons, such a pump filtering efficiency allows a correct detection of the correlated photons as soon as the generation efficiency is higher than 10−4pairs per pulse
typically (measured at the very output of the liquid-core fiber). This generation efficiency must be kept quite low, however, in order to avoid the generation of multiple pairs by the same pump pulse (which would degrade the quality of the source, as shown in [37]). As a result, we have to work with generation efficiencies between
Figure 5. Detection setup. DG = diffraction grating, SPDs = single-photon detectors, LP = linear polarizer, HWP = half-wave plate, Obj. = microscope objective, RG665 = Schott longpass filter.
10−4
and 10−2
pairs per pulse typically. Given the repetition rate of the pump laser (80 MHz) and the collection efficiency (≈3%), it means that we should keep the FWM detection rate of the two SPDs between 200–30000 counts per second approximately. (The raw detection rate, which includes the FWM detection rate and the noise detection rate—from residual pump, Raman, environment, dark counts—will necessarily be a little bit higher.)
4. Experimental results
4.1. Detection rate
We first measured the evolution of the detection rateΓdeton each SPD as a function of the mean pump power
(Pmean) injected in the fiber core. We expect the following dependence:
Γdet=α0+α1 meanP +α2 meanP2 . (2) The constant termα0originates from the dark counts of the SPD and the environmental noise. The linear term
α P1 meancan come from the residual pump photons on the one hand, and from the Raman photons on the other
hand (since the efficiency of the SpRS process grows linearly with the mean pump power). Obviously, in the case of our liquid-core fiber, we expect the SpRS contribution to be much lower than in the case of a silica-core fiber. Finally, the quadratic termα P2 mean2 will be the signature of the spontaneous FWM process.
A typical result of this kind of detection rate measurement is given in figure6. A second-order polynomial fit on the experimental data leads toα = 7001 s−1mW−1andα = 452 s−1mW−2. (An independent prior
measurement led toα ≈ 600 s−1, showing that the environmental noise level is negligible with respect to the dark
count level.) We used mean pump powers between 0.2–30 mW in order to keep the FWM detection rate between 200–30000 s−1
, as explained at the end of the previous section.
Let us note that, with the silica-core PCF whose characteristics are presented in appendixA, we obtained α ≈ ×1 9 105s−1mW−1with the same pump filtering efficiency and detection setup. The value ofα1in the
liquid-core fiber is about three orders of magnitude lower than in the silica-liquid-core PCF.
The following step was to measure the evolution ofΓdetwithPmeanfor different values of the pump
wavelength (λp) inside the spectral range of interest (shaded area in figure4), while the two arms of the
spectrometer were still collecting the photons at 857 nm and 916 nm. For eachλp, we obtained a curve such as
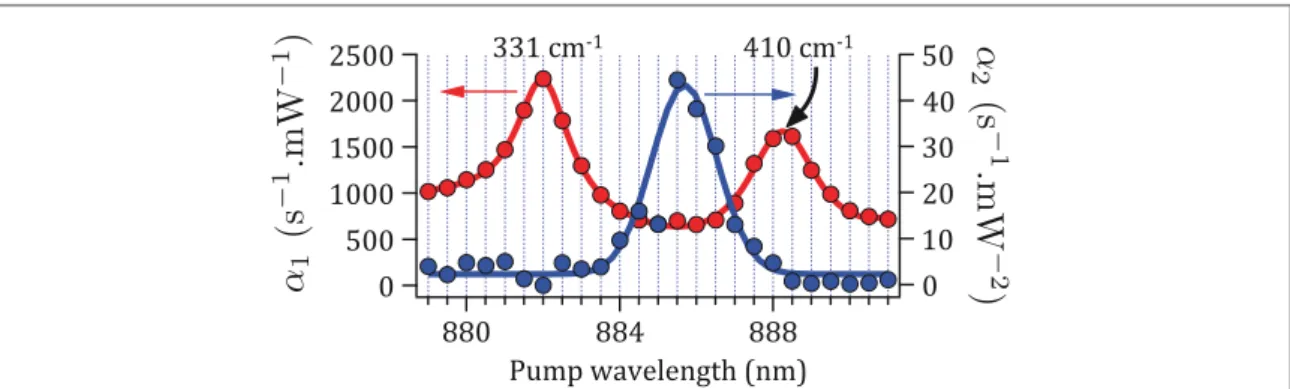
that of figure6, from which we could retrieve the values ofα1andα2. Figure7shows the evolution of the values
ofα1andα2as a function ofλp. It reproduces respectively the minor Raman lines of deuterated acetone and the
parametric band associated with the FWM process (convolved with the≈0.5 nm detection bandwidth of the spectrometer). One can notice that 1)α2actually reaches its maximum value whenλpis equal to 885.5 nm, and
2) in the chosen spectrometer configuration, the parametric band is actually located between two minor Raman lines of deuterated acetone (the overlap between the parametric band and these Raman lines is minimized), as required. Note that this result also permits one to ensure that the quadratic growth obtained on the curve of figure6has no chance to come from a stimulated Raman scattering process but actually originates from the spontaneous FWM process.
Moreover, by performing a double-Lorentzian fit on theα1data, we were able to estimate the values of the
Raman scattering effective cross sections of deuterated acetone for these two Raman lines. For example,
considering the minor line with a Raman shift equal to 331 cm−1, our experimental data lead to an effective cross
section equal to1.3×10−32cm2
sr−1
, whereas an estimation deduced from the reported data [36,38,39] gives
× −
2 10 32cm2sr−1. The good agreement between these two values confirms the validity of our measurements
related to the SpRS process.
It must be noted, nevertheless, that the spontaneous FWM efficiency appears to be unexpectedly low. We actually obtainedα2(liquid)= 45s−1mW−2(maximum of theα2curve in figure7), to be compared to the
silica-Figure 6. Typical evolution of the detection rate as a function of the mean pump power atλ = 885.5p nm. Dots: experimental data.
core PCF used as a reference (see appendixA), for whichα2(silica)≈48 × 104s−1mW−2. Since the nonlinear coefficient γ of the liquid-core PCF is only≈five times lower than that of the silica-core PCF, the FWM efficiency in our liquid-core fiber (which is proportional to( )γL2) is≈400 times lower than expected. It corresponds to an
effective nonlinear interaction length L around 20 times lower than the real length of the fiber. A temporal walk-off between the pump pulse and the signal and idler photons is often said to reduce the effective length [2], but in the case of the photon pair generation in a silica-core PCF reported in [8], the temporal walk-off is said to have no influence on the number of generated photons. Moreover, a simple analytical model that we have developed in order to address this issue in a more quantitative way, taking into account the pulsed temporal regime of the pump [40], does not lead us to attribute this low FWM efficiency to a walk-off problem. Inhomogeneities of the microstructuring structure could rather cause a variation of the zero-dispersion wavelength along the fiber, leading to a fluctuation of the phase-matching condition satisfaction, and therefore justify this reduction of the effective nonlinear interaction length. The influence of such a phenomenon would be low in the case of our silica-core PCF, as it is much less dispersive than the liquid-core fiber. This issue is currently under investigation, both experimentally and theoretically. It essentially shows that we still have a great potential for improvement on these first results if a specially designed fiber is used for such experiments.
In summary, the results described in this section are the key to two essential claims of this paper:
• At high pump power levels the quadratic part of the growth ofΓdetbecomes significant, which highlights the
fact that the spontaneous FWM process actually occurs in the core of our liquid-filled fiber. This is the first experimental demonstration of correlated photon pair generation in a liquid-core fiber.
• The SpRS contribution has been reduced by about three orders of magnitude in the liquid-core fiber compared to the silica-core one.
4.2. Coincident counts
A second series of experiments allowed us to plot the histogram of the temporal correlations between the two SPDs, which represents the number of detection pairs (one detection on each SPD)—called occurrences in figure8—as a function of the delay between the two detections of the pair. In this way, we obtained the number of temporally coincident counts, whose predominance is the signature of the generation of correlated photon pairs. The coincident-to-accidental ratio (CAR), i.e., the ratio between the total number of coincidences and the number of accidental coincidences (see appendixBfor technical details), is a quantitative criterion to estimate the performance of the whole device, including both the quality of the quantum correlations produced by the source and the performance of the detection setup (particularly its collection efficiency).
On the histogram of figure8, we get a CAR equal to 63 for a generation efficiency of about 10−4
pairs per pulse at the output of the fiber.
5. Discussion
Table1summarizes the parameters of interest for a valuable comparison between our experimental results and previously reported ones concerning the generation of correlated photon pairs inχ(3)fibered materials:
microstructured silica-core fibers [8,20,41], highly nonlinear non-microstructured silica fibers [42], and chalcogenide fibers [16].
Figure 7. Evolutions ofα1andα2as a function ofλp, with the idler detection arm centered at 857 nm. Solid lines: double-Lorentzian
This comparison is complex because of the numerous parameters involved in the interpretation of the obtained performances. It is noteworthy that the CAR is expected to decrease with increasing generation efficiency, and that this effect is all the more important as the losses experienced by the signal and idler photons are high; hence, the importance of the collection efficiency of the photon pairs. The generation rate is expected to
Figure 8. Histogram of the delays between a detection on the idler channel and a detection on the signal channel, acquired with
=
Pmean 2.8 mW,Ppeak=17.5W. For this measurement, the generation efficiency was of the order of 10−4pairs per pulse, and the
detection rates on the two SPDs wereΓdet,s≈ 5850s−1andΓ ≈ 2100det,i s−1.
Table 1. Comparison with previously reported results in fibered structures.
Reference Architecture Pump Spectral Detection T° Mean Generation
lasera detuningb setupc pump CAR
efficiency power (pairs/pulse) [8] (2006) 0.2-m silica-core PCF λ = 708p nm Δ ≈t 2ps Γ = 80 MHz 2940 cm−1 88 THz ≈150nm Δλ = 4.5s nm Δλ = 9.6i nm η ≈ 24s % η ≈ 11i % Room T° 340 μW 220 1×10− 2 [41] (2009) 1-m silica-core PCF λ = 742p nm Δ ≈t 8ps Γ = 76 MHz 1000 cm−1 30 THz ≈55 nm Δλ = 0.17s nm Δλ = 0.3i nm η = 7.3s % η = 7.7i % Room T° ≈0.05mW 0.5 mW 900 100 × − 1 10 4 × − 0.9 10 2 [20] (2013) 0.15-m silica-based micro/nano-fiber λ = 1041p nm Δ ≈t 250fs Γ = 62.56 MHz 2000 cm−1 60 THz ≈230nm Δλ = 18s nm Δλ = 9i nm η ≈ 2s % η ≈ 10i % Room T° 1 mW 530 ≈ ×1 10− 3 [42] (2013) 10-m silica-based HNLF λ = 1554.1p nm Δ ≈t 5ps Γ = 46.5 MHz 26.7 cm−1 0.8 THz 6.5 nm Δλ ≈ 1s nm Δλ ≈ 1i nm η = 4.99s % η = 4.87i % 300 K 77 K μ ≈430 W 29 130 × − 1 10 4 × − 7 10 5 [16] (2012) 0.07-m chalcogenide fiber λ = 1550.1p nm Δ ≈t 10ps Γ = 10 MHz 23 cm−1 0.7 THz 5.6 nm Δλ ≈ 0.4s nm Δλ ≈ 0.4i nm η = 3.0s % η = 2.2i % 293 K 77 K /// 0.5 4.2 ≈ ×4 10−3 This paper 1.05-m liquid-core PCF λ = 885.5p nm Δ ≈t 1ps Γ = 80 MHz 375 cm−1 11.3 THz 30 nm Δλ ≈ 0.5s nm Δλ ≈ 0.5i nm η ≈ 3s % η ≈ 3i % Room T° 2.8 mW 63 1×10− 4 a λ
p= pump wavelength,Δt= pulse duration, Γ = repetition rate.
bWarning: For detunings higher than 10 THz typically, the value given in terms of wavelength is only a rough value! c Δλ
s i, = Detection bandwidth in the signal (respectively idler) channel,ηs i, = collection efficiency in the signal (respectively idler) channel.
In contrast with previously reported results, we believe that the main limitation of our device is not the SpRS process anymore; indeed, as shown in the previous subsection, the SpRS contribution has been drastically reduced by replacing the silica core with a liquid core.
6. Conclusion
In this paper, we experimentally demonstrate, for the first time to our knowledge, the generation of correlated photon pairs in a liquid-filled hollow-core PCF. Moreover, we provide the proof of principle for the high potential of this hybrid architecture on the issue of reducing the SpRS noise in fiber-based correlated photon pair sources. Indeed, by comparing the experimental results obtained in a liquid-core PCF and those obtained with a silica-core PCF, we evidenced a reduction of the SpRS contribution by about three orders of magnitude.
We demonstrate a CAR of 63 with a generation efficiency of about 10−4
pairs per pulse obtained with a mean pump power of 2.8 mW, a peak pump power of 17.5 W, and a detection bandwidth of about 0.5 nm for the signal and idler photons, and we expect to be able to highly improve these performances. We will focus on improving the spontaneous FWM efficiency by optimizing the dispersive and nonlinear properties of the hollow-core PCF. A design specifically adapted to the targeted application, together with the use of various nonlinear liquids, will increase the pair generation rate and further minimize the possible residual SpRS contribution of the silica structure of the fiber and of the liquid. (The latter could originate from a slight overlap between the minor Raman lines of deuterated acetone or from the leakage of some low-frequencey Raman lines [43,44].) The choice of the fiber length will also be of significant importance. Polarization entanglement will be investigated, based, for instance, on a Sagnac loop setup [45]. All these issues are currently under investigation, both experimentally and theoretically, in order to move forward on the road to the development of high quantum quality fiber-based photon pair sources for quantum telecommunication networks.
Acknowledgments
This work is financially supported by the Research Federation LUMAT and the C’Nano Île-de-France GENEPHY project, and Margaux Barbier acknowledges the DGA for its financial support.
Appendix A.
TablesA1andA2summarize the main characteristics of the two fibers involved in the experiments presented in this paper.
Appendix B.
In this appendix, we give an overview of the technical details related to the coincident count measurements. Such measurements rely on a Time-Correlation Single-Photon Counting (TCSPC) device, which permits us to measure the delays between a detection on one SPD and a detection on the other one.
In our experiments, a high-resolution histogram (with a bin width of 50 ps) showed that the electronic jitter of the TCSPC device was equal to 2.5 ns (much higher than the pump pulse duration, but lower than the 12.5 ns repetition period of the pump laser). Then, we chose to work with a bin width equal to this electronic jitter (see figure8). In this way, the 2.5 ns bin that is located around the zero delay represents the coincidence window: Any measurement point (or occurrence) recorded in this bin can be attributed to two simultaneous detections (one on each SPD). Among these coincident counts, we can distinguish the ‘true’ coincident counts, which are due to correlated photons (i.e., the signal and idler photons of the same pair), and the ‘accidental’ coincident counts, due to simultaneous counts on the two SPDs that do not come from two correlated photons (for example, a
signal photon on the first SPD and a residual pump photon on the second one). Since the dark count and environmental noise levels are very low, most of the bins surrounding the coincidence window are almost empty (see insert in figure8): only those that are separated from the coincidence window by a multiple of 12.5 ns (repetition period of the pump laser) are populated. These secondary bins mainly correspond to the detection of photons associated with two different pump pulses. As these two counts are necessarily uncorrelated, it is usual to consider that the number of occurrences in a secondary bin is equal to the number of accidental coincidences in the coincidence window. Thus, it is possible to evaluate the ratio between total and accidental coincidences (named coincident-to-accidental ratio, CAR), which is a quantitative criterion to estimate the quality of the quantum correlations produced by the source, considering the performance of the detection setup (essentially its collection efficiency).
References
[1] Boyd R 2008 Nonlinear Optics 3rd edn (New York: Academic) [2] Agrawal G 2007 Nonlinear Fiber Optics 4th edn (New York: Academic)
[3] Marhic M 2012 Fiber Optical Parametric Amplifiers, Oscillators and Related Devices (Cambridge: Cambridge University Press) [4] Barbier M, Leproux P, Roy P and Delaye P 2013 J. Opt. Soc. Am. B30 2889
[5] Russell P 2006 J. Lightwave Technol.24 4729
[6] Sharping J, Chen J, Li X, Kumar P and Windeler R 2004 Opt. Express12 3086
[7] Fan J, Migdall A and Wang L 2005 Opt. Lett.30 3368
[8] Alibart O, Fulconis J, Wong G, Murdoch S, Wadsworth W and Rarity J 2006 New J. Phys.8 67
[9] Sua Y, Malowicki J, Hirano M and Lee K 2013 Opt. Lett.38 73
[10] Tittel W and Weihs G 2001 Quantum Inf. Comput. 1 3
[11] Li X, Chen J, Voss P, Sharping J and Kumar P 2004 Opt. Express12 3737
[12] Takesue H and Inoue K 2005 Opt. Express13 7832
[13] Dyer S, Baek B and Nam S 2009 Opt. Express17 10290
[14] Xiong C et al 2011 Appl. Phys. Lett.98 051101
[15] Xiong C, Helt L, Judge A, Marshall G, Steel M, Sipe J and Eggleton B 2010 Opt. Express18 16206
[16] Clark A, Collins M, Judge A, Mägi E, Xiong C and Eggleton B 2012 Opt. Express20 16807
[17] Lee K, Chen J, Liang C, Li X, Voss P and Kumar P 2006 Opt. Lett.31 1905
[18] Lin Q, Yaman F and Agrawal G 2007 Phys. Rev. A75 023803
[19] Rarity J, Fulconis J, Duligall J, Wadsworth W and Russell P 2005 Opt. Express13 534
[20] Cui L, Li X, Guo X, Li Y, Xu Z, Wang L and Fang W 2013 Opt. Lett.38 5063
[21] Lin Q and Agrawal G 2006 Opt. Lett.31 3140
[22] Sharping J, Lee K, Foster M, Turner A, Schmidt B, Lipson M, Gaeta A and Kumar P 2006 Opt. Express14 12388
Table A1. Liquid-core fiber: HC-1550-PM-01 from NKT Photonics filled with deuterated acetone.
Length Effective Linear Zero-dispersion Nonlinear Nonlinear
of the fiber area refractive index wavelength refractive index coefficient
1.05 m ≈30 μm2 1.36 896 nm 5.2×10⁻²⁰
m2W−1
0.012 m−1W−1 Group-velocity dispersion parameters
∑
β ω2( )= m=0Kmωm 8 = − × − − K0 6.7188826896154 10 17 2s m1 = × − − − K1 1.7227759696642 10 31(s m ). (rad s)2 1 1 = − × − − − K2 1.6292821912020 10 46(s m ). (rad s)2 1 2 = × − − − K3 5.0231053368008 10 62(s m ). (rad s)2 1 3 = × − − − K4 2.5279237557688 10 77(s m ). (rad s)2 1 4 = − × − − − K5 2.8109811175602 10 92(s m ). (rad s)2 1 5 = × − − − K6 1.0539690566502 10 107(s m ). (rad s)2 1 6 = − × − − − K7 1.8886822369153 10 123(s m ). (rad s)2 1 7 = × − − − K8 1.3576311149817 10 139(s m ). (rad s)2 1 8Table A2. Silica-core fiber: RTI-1605-UV from the Xlim Institute (Limoges, France), which has also been used for the experiments reported in [4].
Length Effective Linear Zero-dispersion Nonlinear Nonlinear of the fiber area refractive index wavelength refractive index coefficient 0.97 m ≈4μm2 1.45 834 nm 2.7×10⁻²⁰m2W−1 0.05 m−1W−1
[36] Dellepiane G and Overend J 1966 Spectrochim. Acta22 593
[37] Smirr J L, Frey R, Diamanti E, Alléaume R and Zaquine I 2011 J. Opt. Soc. Am. B28 832
[38] Colles M and Griffiths J 1972 J. Chem. Phys.56 3384
[39] Griffiths J 1974 J. Chem. Phys.60 2556
[40] Barbier M 2014 Génération de paires de photons corrélés par mélange à quatre ondes spontané dans des fibres microstructurées à cœur liquide PhD Thesis Institut d’Optique Graduate School
[41] Ling A, Chen J, Fan J and Migdall A 2009 Opt. Express17 21302
[42] Sua Y, Malowicki J, Hirano M and Lee K 2013 Opt. Lett.38 73
[43] Idrissi A, Longelin S and Sokolić F 2001 J. Phys. Chem. B105 6004
[44] Clemmen S, Perret A, Safioui J, Bogaerts W, Baets R, Gorza S P, Emplit P and Massar S 2012 J. Opt. Soc. Am. B29 1977
![Figure 2. Raman spectrum of deuterated acetone. Reprinted from [36], copyright 1966, with permission from Elsevier.](https://thumb-eu.123doks.com/thumbv2/123doknet/12284695.322757/4.892.180.828.428.665/figure-spectrum-deuterated-acetone-reprinted-copyright-permission-elsevier.webp)


![Table A2. Silica-corefiber: RTI-1605-UV from the Xlim Institute (Limoges, France), which has also been used for the experiments reported in [4].](https://thumb-eu.123doks.com/thumbv2/123doknet/12284695.322757/11.892.186.831.102.415/table-silica-corefiber-institute-limoges-france-experiments-reported.webp)
