HAL Id: halshs-01332655
https://halshs.archives-ouvertes.fr/halshs-01332655
Submitted on 21 Jun 2016
HAL is a multi-disciplinary open access
archive for the deposit and dissemination of
sci-entific research documents, whether they are
pub-lished or not. The documents may come from
teaching and research institutions in France or
abroad, or from public or private research centers.
L’archive ouverte pluridisciplinaire HAL, est
destinée au dépôt et à la diffusion de documents
scientifiques de niveau recherche, publiés ou non,
émanant des établissements d’enseignement et de
recherche français ou étrangers, des laboratoires
publics ou privés.
Three-dimensional Modeling of Percolation Behavior of
Electrical Conductivity in Segregated Network Polymer
Nanocomposites Using Monte Carlo Method
Heng Gu, Jiaojiao Wang, Choongho Yu
To cite this version:
Heng Gu, Jiaojiao Wang, Choongho Yu. Three-dimensional Modeling of Percolation Behavior of
Electrical Conductivity in Segregated Network Polymer Nanocomposites Using Monte Carlo Method.
Advances in Materials, Science Publishing Group, 2016, 5 (1), pp.1-8. �10.11648/j.am.20160501.11�.
�halshs-01332655�
http://www.sciencepublishinggroup.com/j/am doi: 10.11648/j.am.20160501.11
ISSN: 2327-2503 (Print); ISSN: 2327-252X (Online)
Three-dimensional Modeling of Percolation Behavior of
Electrical Conductivity in Segregated Network Polymer
Nanocomposites Using Monte Carlo Method
Heng Gu
1, *, Jiaojiao Wang
2, Choongho Yu
3 1Rexa Electraulic Actuation, Inc. West Bridgewater, MA, USA2School of Materials Science and Engineering, East China University of Science and Technology, Shanghai, China 3
Department of Mechanical Engineering, Texas A&M University, College Station, Texas, USA
Email address:
hgcare@gmail.com (Heng Gu)
*Corresponding author
To cite this article:
Heng Gu, Jiaojiao Wang, Choongho Yu. Three-dimensional Modeling of Percolation Behavior of Electrical Conductivity in Segregated Network Polymer Nanocomposites Using Monte Carlo Method. Advances in Materials. Vol. 5, No. 1, 2016, pp. 1-8.
doi: 10.11648/j.am.20160501.11
Received: April 29, 2016; Accepted: May 16, 2016; Published: May 19, 2016
Abstract:
Polymer nanocomposites filled with carbon nanotubes are observed to present an onset of the insulator-to-conductor transition through previous experimental studies. In this work, numerical simulations based on Monte Carlo method are performed to investigate the percolation threshold. The conductive fillers are modeled as a three dimensional (3D) network of identical units dispersed in the polymer matrix. However, the distribution of the fibers is not uniform due to the existence of the emulsion particles. The effects of the aspect ratio and fiber length on the critical volume fraction are studied. Linearization is made to the logarithm of simulation results. The calculated critical volume fraction is used in the power-law function to predict the electrical conductivity of the polymer composites. The results from the homogeneous model (without emulsion particles) and the model containing emulsion particles are compared. The effects of the size and the geometrical variation of the emulsion particles are evaluated.Keywords:
Monte Carlo Simulation, Electrical Conductivity, Nanotubes, Polymer Nanocomposites1. Introduction
In the twenty-first century, many important applications of novel polymer and its composites reinforced by various types of nano-sized fillers were found in aerospace, medical and electronic industries. A common advantage of these composites is that certain material properties (thermal, electrical, mechanical or optical) are enhanced with minimum weight adding. [1, 2, 3, 4, 5, 6]. It is of interest to investigate that how most optimized properties of the material can be reached by varying the geometry, orientation, length scale, distribution and volume fraction of the fillers. Conductive fibers are embedded in the polymer matrix in order to increase the overall conductivity of the composites. The overall conductivity of the composites is controlled by the volume fractions taken up by the fibers. However, the conductivity-volume fraction curve is not a simple smoothly
upgoing one. Experimental study by Bigg D. M., 1979 [7] revealed the existence of an insulator-to-conductor transition in such composites around a threshold as the volume fraction of the fibers reaches a critical value. It usually turns out to be a sharp onset of high conductivity K at a critical fiber volume fraction f . c
Percolation theory has been successful and widely accepted in describing this transition [8]. According to percolation theory, the conductive fillers can be modeled as a 2D or 3D network of numerous segments, which are located regularly or randomly within the system. The exact solution to percolation problems have been obtained only for very few special cases [8], while the approximation methods, like Monte Carlo simulations, are expected to solve more
2 Heng Gu et al.: Three-dimensional Modeling of Percolation Behavior of Electrical Conductivity in Segregated Network Polymer Nanocomposites Using Monte Carlo Method
general problems. The disordered topology is modeled with Monte Carlo method. The solution of the percolation process is obtained with the aid of computers with high computation capability. The earliest application of Monte Carlo method to solve the percolation problem was conducted by Pike and Seager (1974) [9], who did a 2D study on composites filled with straight sticks. In their work, the sticks were assumed to be of the same fixed length and the size in width was ignored. Balberg and Binenbaum (1983) [10] extended Pike and Seager’s study by accounting for the macroscopic anisotropy of the sticks’ orientation, as well as the distribution of the stick’s length. Natsuki (2005) [11] first considered the width of fibers in his Monte Carlo simulation for a 2D network. The dependence of percolation threshold on fibers’ aspect ratio and orientation angles was investigated. Studies on 3D percolation problems were also present later, including Taya (1987) [12] and Lee (1995) [13]. The former studied the in-plane electrical conductivity of straight short fiber composites, while the latter predetermined the orientation angle of the fibers, and the randomness of the fiber distribution was highly violated.
It is understandable that the nanofibers in conductive composites take on high flexibility due to their extremely large length to diameter aspect ratios. The conductivity of such microstructure will certainly be different from that of the one which only contains straight fibers. To the date, the research on composites of fibers with different shapes has been done and much is still underway. For instance, Yi et. al (2004) [14] reported the increase of percolation threshold with the waviness of sinusoid-shaped fibers. Dalmas et al (2006) [15] simulated the 3D entangled fibrous network using a spline-shaped fiber model. However, the fibers diameter is not considered.
2. Mathematical Formulation
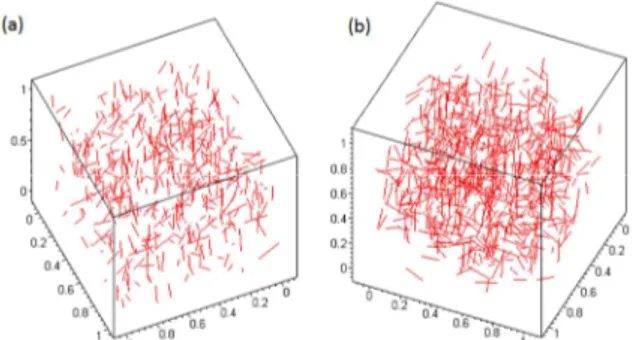
The model is set up in a Cartesian coordinate system. The continuum model of the carbon nanotube is a solid cylindrical stick (Fig. 1) which is assumed to be isotropic and homogeneous. In order to locate each fiber, we generate the random coordinates to the mid-point of the fiber. However, this is not enough to define the orientation of the fiber, so a local spherical system is induced to address this issue. The center of local coordinate system is set at the mid-point of the fiber. Two arms with half of the fiber length are defined. Diameter D is assigned to all the arms. Two independent angles αi and θi are used to define the orientation of the fiber i. The fiber lengths of all the fibers in the system are taken to be identical. To identify a fiber, six random numbers are to be generated: the Cartesian coordinates are specified by the first three random numbers, and the orientation angles are specified by the other three random numbers which are entangled so that the angles are within proper ranges. As shown in Fig. 2, two samples filled by random array of 400 and 800 fibers are plotted.
Figure 1. Local spherical coordinate system for the nano-fiber (red).
Figure 2. Samples with 400(a) and 800(b) fibers distributed randomly; the
cube is nondimensional (of unity length) and the normalized fiber length and is 0.1.
An arbitrary point 1 on fiber i can be defined using a vector X1 (shown in Figure. 3):
1 1 i
λ
=
+
X
X
ζ
(1)(
)
1 1 1 1 TX
Y
Z
=
X
(2)(
)
T i=
X
iY
iZ
iX
(3)(
)
1 cos sin sin sin cos
T
i i i i i
θ α θ α α
=
ζ (4)
where Xi, X and 1 ζ designate the central point i, point 1 1 and the directional unit vector of the line segment;
[
]
(
L/ 2,L/ 2)
λ ∈ − is the distance from i to the arbitrary point 1;
α
i∈[0, ]π
and
θ
i∈[0, 2 ]π
.
Figure 3. An arbitrary point on the fiber apart from the fiber center with
The occurrence of the percolation in a polymer matrix composite sample with conductive fillers has to be determined by computations. The computation will do a search in the system to find a chain of fillers connecting two opposite walls of the sample. The principle of the computation is as follows: Each fiber is checked against another to find whether they intersect. In this work, the connectivity between ith and jth fiber is determined by checking whether the minimum distance between their axes are greater than a critical value, typically the diameter of the fiber or even smaller. The approach to find the shortest distance between two fibers was described in [16] and is implemented as below. Similarly, another fiber j with center point j and an arbitrary point 2 are defined as:
2 2 j
µ
=
+
X
X
ζ
(5)(
)
2 2 2 2 T X Y Z = X (6)(
)
T j j j j X Y Z = X (7)(
)
2 cos sin sin sin cos
T
j j j j j
θ
α
θ
α
α
=
ζ (8)
The vector between any two points on the two lines is then:
2 1 2 1 ij
µ
λ
=
−
=
+
−
d
X
X
X
ζ
ζ
(9) ij=
j−
iX
X
X
(10) The shortest among these vectors is perpendicular to both lines, thus:d·ζ1 = 0 (11) d·ζ2 = 0 (12)
Expand the above two equations:
Xij·ζ1 + µ ζ2·ζ1 – λ = 0 (13) Xij·ζ2 + µ - λζ1·ζ2 = 0 (14)
If two line segments are parallel or ζ2 =ζ and 1 ζ2⋅ζ =1. it 1 becomes:
1
ij
λ µ
− =
X ζ
⋅
(15) ,λ µ have multiple solutions. If two line segments are not parallel or ζ2≠ζ and 1 ζ2⋅ ≠ζ1 1, λ µ, can be solved:
(
) (
)
(
)
(
)
1 2 1 2 0 2 1 21
ij ijλ
=
⋅
−
⋅
⋅
−
⋅
X
ζ
X
ζ
ζ ζ
ζ ζ
(16)(
) (
)
(
)
(
)
2 1 1 2 0 2 1 21
ij ijµ
=
⋅
−
⋅
⋅
−
⋅
X
ζ
X
ζ
ζ ζ
ζ ζ
(17) Insert the value of λ0 and µ0 into d :0 0 2 0 1
ij
µ
λ
=
+
−
d
X
ζ
ζ
(18) The norm d0 is the shortest distance between two line segments.If the condition: d0 ≤D,
λ
∈ −[
L/ 2, / 2L]
and[
L/ 2, / 2L]
µ
∈ − is satisfied, then two fibers connect, otherwise they are disconnected.3. Computer Code Implementation
The model is set up within a cubic space with unit length (non-dimensional). The purpose of scaling is to simplify the data processing especially when extracting the results of the calculation.
The first step is to generate the fibers and fill them into the model, which are of the same fiber length and aspect ratio (fiber length divided by fiber diameter). Each fiber is characterized by five independent parameters: coordinates of the fiber geometry center (x, y, z); two angles θ and α . Furthermore, since the fiber length is predetermined, the coordinates of two fiber ends can be calculated. Since the fibers are randomly distributed and oriented in the model, five parameters x y z, , , θ and α are supposed to be random numbers within certain ranges:
[ ]
, , 0 1
x y z∈ , ;
θ
∈[
0, 2π
]
andα
∈[ ]
0,π
, respectively. The random number generator [17, 18] was used, and it basically should have the following features: firstly, being capable of produce uncorrelated number sequence; secondly, having a long period (in case of the repetition of sequences); thirdly, being capable of producing a uniformly distributed number series; finally, high efficiency.This algorithm is particularly important for Monte Carlo methods due to its reliance on random sampling computation. Meanwhile, each fiber is assigned a fiber number and a cluster number. Initially, fiber numbers are sequentially assigned to each fiber from 1 to N, which is the total number of the fibers and the cluster number is set to be equal to the fiber number.
Next, it is necessary to count the fiber number on the upper and lower boundaries. Two arrays are defined to store the upper and lower boundary fiber numbers. Then a subroutine is called to check the connectivity of fibers. Each fiber is checked against all the other fibers whose fiber numbers are higher. For example, the ith fiber will be checked with the fibers with fiber number form i+1 through N. The connectivity criterion is defined in two steps. Firstly, it must be true that two fibers i and j have overlapping in all three coordinate directions and therefore, the following condition has to be satisfied:
min max j i
x
>
x
or max min j ix
<
x
min max j iy
>
y
or max min j iy
<
y
min max j iz
>
z
or max min j iz
<
z
If all the conditions above are not satisfied, the two fibers i and j are not possible to intersect, then fiber i will be checked against the next fiber j+1. If they are satisfied, the distance
4 Heng Gu et al.: Three-dimensional Modeling of Percolation Behavior of Electrical Conductivity in Segregated Network Polymer Nanocomposites Using Monte Carlo Method
between two fibers is calculated using the expression in Eq. (18). The result will be compared to the value of the diameter of the fibers. If larger than the diameter, two fibers do not intersect. If smaller or equal to the diameter, it can be regarded that two fibers intersect. The smaller distance than the diameter is possible, because some of the connected fibers are soldered by using microwave in the manufacturing process. If a fiber pair meets the above criterion, their cluster numbers will be set the smaller one of the two original cluster numbers. This has to be done to make sure all the fibers in the same cluster have the same cluster identification number. Also two clusters are marked with the same number if they share one or more common fibers. The fiber numbers of all the fibers in a cluster will be compared to the boundary fiber number stored in two arrays defined above. If both upper and lower boundary fibers are found in the same cluster, it can be concluded that two boundaries are connected and the sample is percolated in the direction perpendicular to the opposite boundaries. The critical volume fraction (CVF) is defined as the instantaneous volume fraction of the fibers when the percolation happens for the very first time in the system.
4. Result and Discussion
4.1. Effect of the Fiber Length
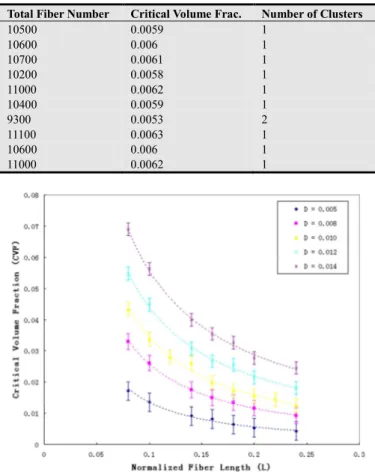
One of the purposes of the numerical simulations is to investigate the filler’s size effect on the percolation threshold. Particularly, the effects of fiber length and aspect ratio on the critical volume fraction are studied. For better accuracy of the results, the calculation on each sample is performed 10 times, as shown in Table 1, and the standard deviation is evaluated (maximum and minimum values are used to create an error bar on each data point). Then the average of the rest values are calculated and regarded as the critical volume fraction.
As shown above, within a sample (a cube of unit length), fibers of length 0.08 and aspect ratio 26.7 are distributed randomly. The initial fiber number is set to be 500 for this case. Then the computation does a search over the system to find the fiber cluster of percolation. Once such a cluster is found, the cluster number is set to 1 (initially 0) and the computation is terminated. The current volume fraction is regarded as the critical volume fraction of the system. If the cluster number is still zero after a search, a small increment (100 for this case) is added to the fiber number and the computation is repeated. An enough large upper bound of fiber number is set to terminate the calculation when it takes too long. Such a situation will be regarded as a inconvergency problem. The initial fiber number, the increment and the upper bound are adjusted based on the dimension of the fibers. It is important that the cluster number is 1, because it makes sure that the simulation is at the first time two opposite boundaries are connected by fibers. By calculating the standard deviation of 10 repetitions, the stability of the results is evaluated. Here the standard deviation equals to 521.1099 and the error (standard deviation divided by average fiber number) equals to 4.94%, which is within the tolerance (5%) and satisfactory.
Table 1. Calculated results (10 repetitions) of critical volume fraction of
fibers in the cube of unit length in which fiber length = 0.080; aspect ratio = 26.7; fiber diameter = 0.003.
Total Fiber Number Critical Volume Frac. Number of Clusters
10500 0.0059 1 10600 0.006 1 10700 0.0061 1 10200 0.0058 1 11000 0.0062 1 10400 0.0059 1 9300 0.0053 2 11100 0.0063 1 10600 0.006 1 11000 0.0062 1
Figure 4. Effects of fiber diameters and lengths on the critical volume
fractions.
In Fig. 4, it is found that the critical volume fraction decreases when the fiber length increases. The critical volume fraction depends on two factors, the single fiber dimensions and the total fiber number at the percolation threshold. It is understandable that the probability that two randomly distributed fibers connect is larger when their length increases. However, smaller fibers have more difficulty to be connected and percolation happens at larger number of fibers. Meanwhile, it is concluded that the critical volume fraction increases with the fiber diameter when the fiber length keeps unchanged.
4.2. Effect of the Aspect Ratio
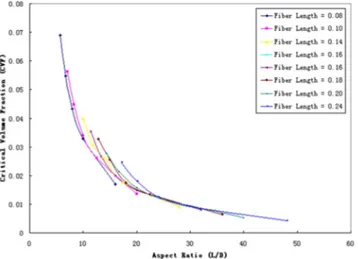
Aspect ratio is another very important factor which affects the percolation threshold. In this study, a set of fiber lengths are selected and for each fiber length several samples of different aspect ratio are used to calculate the critical volume fractions, fc. The results are plotted in Fig. 5: the critical volume fractions fc decreases dramatically with the increasing aspect ratio, which means the critical volume fraction decreases with the decreasing fiber diameters. The volume of a single fiber is proportional to the square of the fiber diameter and the fiber number needed for percolation threshold increases when the fibers become thinner, because it is more difficult to get a fiber pair connected. As discussed in the foregoing section, the fiber number is the dominant factor in
determining the critical volume fraction when the fiber length changes. To the contrary, the single fiber volume affects the critical volume fraction to a larger extent when fiber diameter changes. The results in Fig. 5 coincide with the conclusion form the previous experimental study by D. Bigg (1979) [7]: the percolation threshold relies on the aspect ratio greatly in the case of short fiber reinforced composites, that is, the higher the fiber aspect ratio is, the lower the volume fraction is demanded to obtain conductance. However, the simply plotted results are still ambiguous to predict the trend between critical volume fraction and aspect ratio. Natsuki’s research work in 2005 [11] revealed that the logarithm of the critical volume fraction has a linear dependence on that of the aspect ratio of the fibers.
Figure 5. Critical volume fraction vs. aspect ratio.
Fig. 6 indicates that the linear relationship between the natural logarithm of fiber aspect ratio AR and critical volume fraction fc. The slopes of the straight line in Fig. 6 are the coefficients of the linear functions of curve fitting. The slopes varies with the fiber length a little bit, but it is around -1.40 on average,as shown in Fig. 7. This means that the critical volume fraction is generally proportional to AR-1.40. The result is twice as that of Bigg’s experimental data [7] but closer to Foygel’s theoretical and computational studies of carbon nanotube composites in 2005 [19].
Figure 6. Plotted logarithms of aspect ratios to critical volume fractions.
Figure 7. Linearization of aspect ratios to critical volume fractions.
Samples filled with low-aspect ratio fibers are more difficult to reach the percolation threshold because critical volume fraction can be much higher than that for high-aspect ratio fibers. The computation becomes also much more time-consuming and even fails as a result of inconvergency. It is unrealistic to perform calculations on all the samples. The success of linearization makes it possible to predict the critical volume fractions of low-aspect ratio fibers more accurately than directly using curve-fitting results, which follows the power law and is non-linear. Furthermore, the intersecting point between the linear function and the y-axis represents the logarithm of the critical volume fraction when the fiber length equals to the diameter, in other words, the fillers become particles, not fibers any more.
4.3. Effect of the Emulsion Particles
Figure 8. a) Schematic of CNTs suspended in an aqueous emulsion. Gray
spheres and red lines represent emulsion particles and CNTs, respectively. (b) Schematic of the emulsion-based composite after drying. The CNTs form a 3D network along the surfaces of the spherical emulsion particles (c) composites was freeze-fractured (for instance, along the dotted line in (a)). CNTs (indicated by arrows) were wrapped around the emulsion particles (indicated by dotted yellow lines) rather than homogeneously mixed. SEMs of the cross-sections of 1, 3, 5, 10, and 20 wt% CNT composites are shown in (d), (e), (f), (g) and (h) respectively. The scale bars in the SEMs indicates 1um.
6 Heng Gu et al.: Three-dimensional Modeling of Percolation Behavior of Electrical Conductivity in Segregated Network Polymer Nanocomposites Using Monte Carlo Method
In the above sections, the nano-fibers are assumed to randomly located anywhere in the samples. The polymer matrix is considered to be homogeneous and isotropic. However, such a spatial distribution of fibers is not the case in reality. For instance, the polymer matrix is fabricated from poly (vinyl acetate) (PVAc) homopolymer emulsion (Vinac XX210) (Air Products, Inc.), which consists of polymer particles and water. When the fibers are scattered in the emulsion, they cannot penetrate the particles. After the water is drained, most volume is taken up by the polymer particles and the fiber are accommodated in the interstitial space between the particles (Fig. 8).
To model the real microstructure of the polymer composites, it is necessary to exclude the fibers from the volume of particles. This requires check the locations of fibers after N random fibers are generated. Suppose there are N fibers are ' located in the particles. Then they will be removed and the rest
'
N−N fibers are kept. A new set of N random fibers are ' regenerated. This process will be repeated till N fibers are placed in the interstitial spaces. The topology of emulsion particles in the real microstructure can be complex; however, it will be computationally troublesome, so in the simulation, all particles are assumed to be cubes or spheres for simplicity. The width of the interstitial space between cubs is set to be 10% of the particle size and particles of different sizes are used (Fig. 9-10).
Figure 9. (a) Real microstructure of irregular emulsion particles; the fibers
are only distributed in the interstitial region between fibers; no fibers penetrate the surface of particles; (b, c) A cube matrix representing the emulsion particles; the ratio of interstitial gap width and cube length is 1/10.
Figure 10. Samples with spherical emulsion particles.
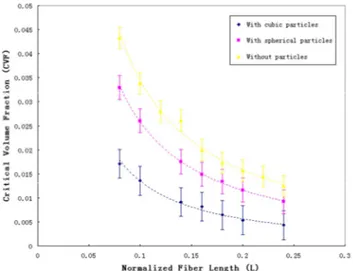
Similarly, the effects of the fiber size on the critical volume fractions will be investigated and compared to those results in the foregoing sections. The fiber diameter is selected to be 0.005 as a default. It is found that the critical volume fractions decrease compared to that of samples without particles given the same fiber length and diameter (Fig. 11). Also when the normalized particle size increases, the critical volume fraction decreases. This is understandable since the existence of the particles narrows the volume for accommodating the nano-fibers and the probability of fiber connections are larger. The curve fitting is made by adding a trend line (dash line) to the calculated results (dots). It is noticed that the power law still works well. The critical volume fraction decreases with the increasing fiber length. The normalized fiber lengths (0.005~0.014) used are smaller than that in the previous sections because it does not make good sense that the fiber length is larger than the polymer particle size.
Figure 11. Normalized fiber length vs. critical volume fraction of samples
with/without emulsion particles (D = 0.005).
4.4. Electrical Conductivity
According to B. I. Shklovskii and Al. L. Efros [20] and D. Stauffer [8], electrical conductivity of nano-fiber network composites after the percolation threshold is expressed in Eq. (19):
(
)
tc o f fc
σ =σ − (19) where σc is the overall electrical conductivity of the
polymer composites; σo is the pre-exponential coefficient that is usually equal to the conductive phase (nano-fiber here);
c
f is the critical volume fraction and f is the volume fraction; t is the conductive exponent. This power law expression has been validated analytically (D. Stauffer, (1985) [8]) and experimentally (Y. Hernandez et al. (2007) [21], C. Yu and J. Granlan (2008) [22]). More recent work can be found in [23], [24] and [25]. The exponent t is a universal value for two-phase composites. According to C. Yu and J. Granlan (2008) [22], the value of t is set to be 3.44 and σo equals to 1.26
×
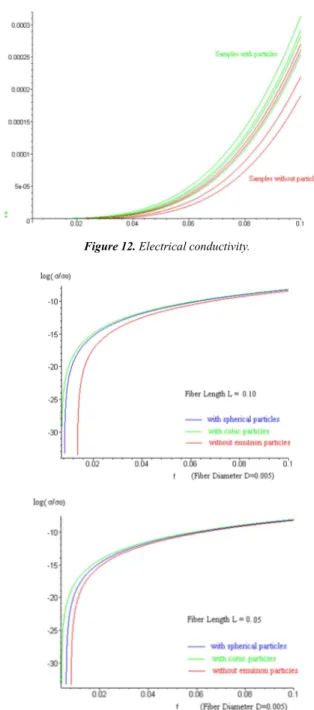
106 S/m. Then calculated volume fractions inthe previous sections are inserted into Eq. (19) and plotted the results in Fig. 12. The results show that the electrical conductivity increases with the fiber length. And also the conductivity curves of samples with particles are above those without particles. It is concluded that the larger electrical conductivities also attributes to the addition of particles. But in Fig. 12, there is no implication that there is a sharp change in the electrical conductivity, so instead, Fig. 13 (a), (b) use the logarithm plotting of the electrical conductivity, which also increases with the volume fraction. It is of interests to find that the curves become parallel to the Y-axis when it approaches to the zero point. The offset between the curve and Y-axis is equal to the critical volume fraction. This indicates that the at the percolation threshold there is a sharp increase in the electrical conductivity.
Figure 12. Electrical conductivity.
Figure 13. Logarithm plotting of electrical conductivity of samples
with/without emulsion particles (a) fiber length L = 0.10 (b) fiber length L = 0.05.
5. Conclusion
In this study, mathematical model is set up for a cubic nano-fiber network polymer matrix composites sample of unity length. The fibers are considered as line segments in a spherical coordinate system. Monte Carlo method is then used to generate the model by fill the randomly distributed and orientated fibers into the cube. The fibers are located by assigning random numbers between 0 and 1 to the coordinates of the fiber center point. Connection criterion is used to judge the connectivity of each fiber and its neighbors. Critical volume fractions are calculated for different fiber lengths and aspect ratios. Power-law function is used to predict the electrical conductivity after the percolation threshold. The numerical simulation reveals the effects of fiber length, aspect ratio and existence of the emulsion particles on the percolation threshold.
Acknowledgements
The thoughtful discussions with Dr. Raymundo Arroyave and Dr. Hae-Kwon Jeong at Texas A&M University were appreciated and very helpful to this work. The support from the supercomputing center at Texas A&M University is also highly acknowledged.
References
[1] Eletskii AV, Knizhnik AA, Potapkin BV, Kenny JM. Electrical characteristics of carbon nanotube-doped composites. Physics-Uspekhi. 2015; 8 (3): 209.
[2] Liu J, Rad IY, Sun F, Stansbury JW. Photo-reactive nanogels as a means to tune properties during polymer network formation. Polymer chemistry. 2014; 5 (1): 227-33.
[3] Awasthi K, Awasthi S, Srivastava A, Kamalakaran R, Talapatra S, Ajayan PM, Srivastava ON. Synthesis and characterization of carbon nanotube–polyethylene oxide composites. Nanotechnology. 2006 Oct 13; 17 (21): 5417.
[4] Xu Z, Li H, Cao G, Zhang Q, Li K, Zhao X. Electrochemical performance of carbon nanotube-supported cobalt phthalocyanine and its nitrogen-rich derivatives for oxygen reduction. Journal of Molecular Catalysis A: Chemical. 2011 Feb 1; 335 (1): 89-96.
[5] Ma C, Chen L, Xu J, Fehrenbacher A, Li Y, Pfefferkorn FE, Duffie NA, Zheng J, Li X. Effect of fabrication and processing technology on the biodegradability of magnesium nanocomposites. Journal of Biomedical Materials Research Part B: Applied Biomaterials. 2013 Jul 1; 101 (5): 870-7. [6] Zhang J, Koo B, Subramanian N, Liu Y, Chattopadhyay A. An
optimized cross-linked network model to simulate the linear elastic material response of a smart polymer. Journal of Intelligent Material Systems and Structures. 2015 Jul 21: 1045389X15595292.
[7] Bigg DM. Mechanical, thermal, and electrical properties of metal fiber-filled polymer composites. Polymer Engineering and Science 1979; 19 (16): 1188-1192.
8 Heng Gu et al.: Three-dimensional Modeling of Percolation Behavior of Electrical Conductivity in Segregated Network Polymer Nanocomposites Using Monte Carlo Method
[8] Stauffer D. 2nd ed. Introduction of percolation theory, Taylor and Francis; London 1992.
[9] Pike GE, Seager CH. Percolation and conductivity - computer study. I. Physical Review B 1974; 10: 1421-1434.
[10] Balberg I, Binenbaum N, Anderson CH. Critical behavior of the two-dimensional sticks system. Physical Review Letters 1983; 51: 1605–1608.
[11] Natsuki T, Endo M, Takahashi N. Percolation study of orientated short-fiber composites by a continuum model. Physica A 2005; 352: 498-508.
[12] Taya, M. and Ueda, N. Prediction of the in-plane electrical conductivity of a misoriented short fiber composite: fiber percolation model versus effective medium theory. Journal of Engineering Materials and Technology 1987; 109: 252–256. [13] Lee YH. Three-dimensional electrical percolation behavior in
conductive short-fibre composites. Journal of Materials Science 1995; 30: 3033-3036.
[14] Yi YB, Berhan L, Satry AM. Statistical geometry of random fibrous networks, revisited: waviness, dimensionality, and percolation. Journal of Applied Physics 2004; 96: 1318-1327. [15] Dalmas F, Dendievel R, Chazeau L, Cavaille JY, Gauthier C,
Carbon nanotube-filled polymer composites. Numerical simulation of electrical conductivity in three-dimensional entangled fibrous networks, Acta Materialia 2006, 54: 2923-2931.
[16] Allen MP, Evans GT, Frenkel D and Mulder BM. Hard Convex Body Fluids. Advances in Chemical Physics 1993; 86, 1. [17] Park SK, Miller KW. Random number generators: good ones
are hard to find. Communications of the ACM 1988; 1192-1201.
[18] Anderson SL. Random number generators on vector supercomputers and other advanced architectures. SIAM Review 1990; 32: 221-251.
[19] Foygel M, Morris RD, Anez D, French S, Sobolev VL. Theoretical and computational studies of carbon nanotube composites and suspensions: electrical and thermal conductivity. Physical Review B 2005; 71: 104201.
[20] Sur A, Lebowitz JL, Marro J, Kalos MH, Kirkpatrick S. Monte Carlo studies of percolation phenomena for a simple cubic lattice. Journal of Statistical Physics 1976; 15: 345-353. [21] Hernandez YR, Gryson A, Blighe FM, Cadek M, Nicolosi V,
Blau YJ, Gun’ko Y, Coleman JN. Comparison of carbon nanotubes and nanodisks as percolative fillers in electrically conductive composites. Scripta Materialia 2008; 58: 69-72. [22] Yu C, Kim YS, Kim D, Grunlan J. Thermoelectric behavior of
segregated-network polymer nanocomposites. Nano Letters 2008.
[23] Narayanunni V, Gu H, Yu C. Monte Carlo simulation for investigating influence of junction and nanofiber properties on electrical conductivity of segregated-network nanocomposites. Acta Materialia. 2011 Jun 30; 59 (11): 4548-55.
[24] Yan H., & Kou K. Enhanced thermoelectric properties in polyaniline composites with polyaniline-coated carbon nanotubes. Journal of Materials Science 2014, 49 (3), 1222-1228.
[25] Wang H., Yi S. I., Pu X., & Yu C. Simultaneously Improving Electrical Conductivity and Thermopower of Polyaniline Composites by Utilizing Carbon Nanotubes as High Mobility Conduits. ACS applied materials & interfaces 2015.