HAL Id: hal-01378588
https://hal.archives-ouvertes.fr/hal-01378588
Submitted on 10 Jan 2017
HAL is a multi-disciplinary open access
archive for the deposit and dissemination of
sci-entific research documents, whether they are
pub-lished or not. The documents may come from
teaching and research institutions in France or
abroad, or from public or private research centers.
L’archive ouverte pluridisciplinaire HAL, est
destinée au dépôt et à la diffusion de documents
scientifiques de niveau recherche, publiés ou non,
émanant des établissements d’enseignement et de
recherche français ou étrangers, des laboratoires
publics ou privés.
Didier Grondin, Sandra Geara, Philippe Breuil, Philippe Vernoux, Jean-Paul
Viricelle
To cite this version:
Didier Grondin, Sandra Geara, Philippe Breuil, Philippe Vernoux, Jean-Paul Viricelle. Influence of
electrodes polarization on the response of resistive soot sensor . EUROSENSORS 2016, Hungarian
Academy of Sciences; Akadémiai Kiadó / AKCongress, Sep 2016, Budapest, Hungary. pp.31 à 34,
�10.1016/j.proeng.2016.11.124�. �hal-01378588�
30th Eurosensors Conference, EUROSENSORS 2016
Influence of Electrodes Polarization on the Response of Resistive
Soot Sensor
D. Grondin
a,b, S. Geara
a, P. Breuil
a, J. P. Viricelle
a1, P. Vernoux
ba
Ecole Nationale Supérieure des Mines, SPIN-EMSE, CNRS:UMR5307, LGF, 42023 Saint-Etienne, France
bUniversité de Lyon, Institut de Recherches sur la Catalyse et l’Environnement de Lyon, UMR 5256, CNRS, Université Claude Bernard Lyon
1,
2 avenue A. Einstein, 69626 Villeurbanne, France
Abstract
This study reports on the influence of the polarization applied between platinum electrodes of a resistive soot sensor. The conductance measured between these electrodes represents the sensor response which increases during soot deposition over time at fixed parameters (soot flow, polarization). It is observed that a maximum response is obtained for an optimum polarization. This behavior is explained by equilibrium between the creation and destruction of inter-electrodes soot bridges. © 2016 The Authors. Published by Elsevier Ltd.
Peer-review under responsibility of the organizing committee of the 30th Eurosensors Conference.
Keywords: Soot sensor, On-board diagnostics (OBD), Diesel particulate filter monitoring
1. Introduction
The negative effect of the vehicles exhaust on the health and the environment has clearly been demonstrated. The world health organization has classified the diesel engine exhaust to be carcinogenic [1]. In order to limit these pollutants, emission legislations for diesel engine become more and more stringent. From Euro 5, limits take in consideration the particulate number (PN) of emitted soot. To lower the PM emission, diesel light-duty vehicles have been equipped with diesel particulate filter (DPF). Due to the extreme conditions that take place in the DPF, it can be deteriorated. An on-board diagnostic sensor able to detect diesel particulate filter (DPF) failures is required.
* Corresponding author. Tel.: 04 77 42 02 52.
Therefore, the development of a cheap sensor effective for the measurement of both mass and PN concentration is necessary.
A resistive soot sensor for diesel particulate filter (DPF) failure detection was developed in a previous work [2]. The sensor consists in an alumina substrate with two platinum interdigitated electrodes. A platinum resistance heater on the other side is used for periodic regeneration. In reason of the carbon content of soot, these particles are electrically conductive. The conductance between the platinum electrodes (sensor response) as a function of time increases under a particulate matters (PM) flow during soot deposition.
When a polarization voltage is applied, soot bridges form between the electrodes, contrary to a continuous soot layer deposited without polarization (figure 1) [2].
a) 0 V b) 30 V
Figure 1: Scanning electron Microscopy of a sensor with soot deposited during 2 hours under a) no polarization and b) a polarization of 30 V.
Sensor response versus time shown in figure 2 strongly depends on the polarization voltage, and an optimum polarization corresponding to a maximum response can be seen, 30 V for given conditions. It was also demonstrated that this optimum value is dependent on the soot characteristics [3]. The objective of this study is the comprehension of this phenomenon.
Figure 2: Conductance variation versus time for fixed operating point at different polarization voltages and conductance versus polarization at 10 minutes (insert).
Experimental
Soot was produced in a synthetic gas bench by the combustion of a mixture of propane/air thanks to a mini Combustion Aerosol Standard (CAST) burner (Jing Ltd. Switzerland). A more complete description of the bench and of the characterization of the produced soot can be found elsewhere [3,4].
Polarization was applied between the sensor electrodes with a Keitley 6430 equipped with remote pre amplification. An avalanche photodiode module Hamamatsu H6956 was used to measure flash emissions that are observed during a polarization voltage ramp. The measurements of the conductance and of the photodiode were synchronized by homemade LabVIEW program that monitors the instruments and records the sensor response.
The sensing element of the sensor was back on the stream to avoid direct impacts. The sensor was preloaded at steady state condition under a polarization voltage of 30 V. Then, it was removed from the bench, placed in a black box including the photodiode, and polarization voltage was continuously increased.
Results and discussion
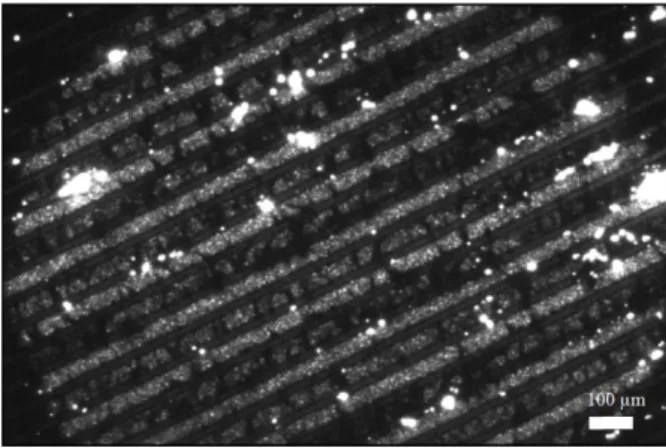
Some observations were made in ambient air at fixed temperature of 200°C imposed by the heater, on soot preloaded sensors with optimum polarization (30 V for considered operating point). Then, electrode polarization was increased up to 200 V. Optical microscope image (figure 3) reveals flashes interpreted a soot combustion occurring at 200 V polarization.
Figure 3: Optical microscopy image showing flashes on a soot pre-loaded sensor (30V) in ambient air with 200 V polarization.
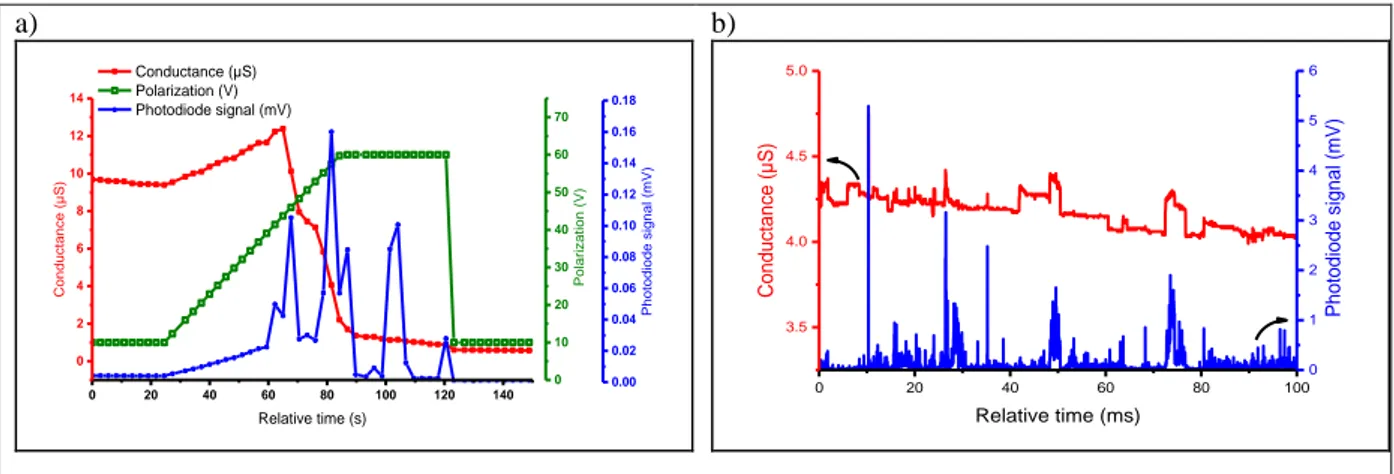
To confirm such visual observation, a similar experience with the simultaneous record of both the conductance and the signal of an avalanche photodiode was performed (figures 4a). When polarization voltage ramp starts from 10 V, the conductance first increases without flash emission, corresponding to soot heating by Joule effect. Indeed, with increasing polarization tension U applied to the sensors, and thus to the inter-electrodes
soot bridges of a given resistance R, an electrical power U2/R is supplied to them, leading to soot bridge heating
and consequent conductance increase due to the carbon soot negative temperature coefficient.
Then, for polarization above 40 V, the conductance decreases simultaneously with flash emissions recorded by the photodiode. This result proves the destruction of soot bridges by combustion ignited by Joule effect and also explains the optimum value observed previously (fig. 2) during soot deposition [3]. Effectively, from a certain value of polarization, as part of the formed soot bridges begins to burn, this value corresponds to an optimum for the soot collection in the fixed operating conditions.
a) 0 20 40 60 80 100 120 140 0 2 4 6 8 10 12 14 Con du c ta nc e (µ S) Conductance (µS) Polarization (V) Photodiode signal (mV) Relative time (s) 0 10 20 30 40 50 60 70 Pol ar iz at io n (V) 0.00 0.02 0.04 0.06 0.08 0.10 0.12 0.14 0.16 0.18 Pho to di od e s ig na l (mV) b) 0 20 40 60 80 100 3.5 4.0 4.5 5.0 Relative time (ms) Con ductance (µS) 0 1 2 3 4 5 6 Pho todiod e signa l (m V)
Figure 4: Measurement of conductance and of the photodiode signal over a polarization voltage ramp with pre-loaded soot sensor a) Low frequency sampling 1 Hz and b) zoom around 60 V with high frequency sampling (10kHz).
The interpretation made at the macro time scale was reinforced by the observations made with high sampling frequency (10 kHz) during previous experiment at around 60 V (figure 4b). It can be seen that each light flash, corresponding to soot combustion coincides momentarily to a positive conductance switch related to brief local temperature increase due to combustion heat.
To conclude, analysis of polarization voltage influence on sensor response allowed to understand the sensing mechanism. An optimum polarization voltage can be attributed to equilibrium between soot bridges creation promoted by polarization effect, and their destruction by combustion ignited at high voltage.
2. Acknowledgements
The authors wish to acknowledge “Arc Environnement” from Region Rhone-Alpes for the funding and EFI Automotive car supplier for sensors manufacture.
References
[1] International Agency for Research on Cancer, Diesel and Gasoline Engine Exhausts and Some Nitroarenes, vol. 105, 2013.
[2] O. Brunel, F. Duault, J. Lavy, Y. Creff, B. Youssef, SAE International Journal of Passenger Cars - Electronic and Electrical Systems 6 (2013) 307–327.
[3] D. Grondin, A. Westermann, P. Breuil, J.P. Viricelle, P. Vernoux, Sensors and Actuators B: Chemical (2016), http://dx.doi.org/10.1016/j.snb.2016.05.049.
[4] D. Lopez-Gonzalez, M.N. Tsampas, A. Boréave, L. Retailleau-Mevel, M. Klotz, C. Tardivat, B. Cartoixa, K. Pajot, P. Vernoux, Top Catal 58 (2015) 1242–1255.