HAL Id: hal-01257904
https://hal.archives-ouvertes.fr/hal-01257904
Submitted on 18 Jan 2016
HAL is a multi-disciplinary open access
archive for the deposit and dissemination of
sci-entific research documents, whether they are
pub-lished or not. The documents may come from
teaching and research institutions in France or
abroad, or from public or private research centers.
L’archive ouverte pluridisciplinaire HAL, est
destinée au dépôt et à la diffusion de documents
scientifiques de niveau recherche, publiés ou non,
émanant des établissements d’enseignement et de
recherche français ou étrangers, des laboratoires
publics ou privés.
Selecting points of interest in traces using patterns of
events
François Trahay, Elisabeth Brunet, Mohamed Mosli Bouksiaa, Jianwei Liao
To cite this version:
François Trahay, Elisabeth Brunet, Mohamed Mosli Bouksiaa, Jianwei Liao. Selecting points of
interest in traces using patterns of events. PDP 2015 : 23rd Euromicro International Conference
on Parallel, Distributed and Network-Based Processing, Mar 2015, Turku, Finland. pp.70 - 77,
�10.1109/PDP.2015.30�. �hal-01257904�
Selecting points of interest in traces using patterns
of events
Franc¸ois Trahay
∗, ´
Elisabeth Brunet
∗, Mohamed Mosli Bouksiaa
∗, Jianwei Liao
†∗T´el´ecom SudParis Institut Mines-T´el´ecom
[email protected] †College of Computer and Information Science
Southwest University of China [email protected]
Abstract—Over the past few years, the architecture of su-percomputing platforms has evolved towards more complexity: multicore processors attached to multiple memory banks are now combined with accelerators. Exploiting such architecture often requires to mix programming models (MPI + CUDA for instance). As a result, understanding the performance of an application has become tedious. The use of performance analysis tools, such as tracing tools, now becomes unavoidable to optimize a parallel application. However, analyzing a trace file composed of millions of events requires a tremendous amount of work in order to spot the cause of the poor performance of an application.
In this paper, we propose mechanisms for assisting application developers in their exploration of trace files. We propose an algorithm for detecting repetitive patterns of events in trace files. Thanks to this algorithm, a trace can be viewed as loops and groups of events instead of the usual representation as a sequential list of events. We also propose a method to filter traces in order to eliminate duplicated information and to highlight points of interest. These mechanisms allow the performance analysis tool to pre-select the subsets of the trace that are more likely to contain useful information. We implemented the proposed mechanism in the EZTrace performance analysis framework and the experiments show that detecting patterns in various benchmarking applications is done in reasonable time, even when the trace contains millions of events. We also show that the filtering process can reduce the quantity of information in the trace that the user has to analyze by up to 99 %.
I. INTRODUCTION
In the petascale era, the evolution of the computing systems leads to the complexification and the massification of com-ponents both on hardware and software sides. The massive growth of computing units potentially heterogeneous with hierarchical specific memories highlights challenges of HPC: parallelism granularity, cohabitation of programming models, data sharing, data movements, technical exploitation, etc. Thus, application codes couple an increasingly large number of distinct middlewares in order to hide all this complexity from top to low level of the software stack: combination of scientific computing libraries (BLAS, etc.), runtime systems (MPI implementations, thread scheduling, etc.). In this context, the libraries and application codes are more error-prone and it becomes really challenging to understand the bad performance of end-user parallel applications.
Tracing tools assist application developers in this process. Basically, the scope of this tool category is to register various
events (sending or receiving an MPI message, calling a func-tion, etc.) of an application during its effective execution. The generated global trace of those events is then analyzed post-mortem in order to observe what happened during the run. Analyzing the trace allows users to search for bottlenecks or unexpected behaviors. Nevertheless, while exploiting a trace composed of a few thousands events requires little effort, the growing number of computing flows complicates the analysis. Since even medium-scale applications now run on thousands of processors, the post-mortem analysis now necessitates to search through millions of events. Displaying a trace generated from a large-scale application does not provide anymore accu-rate help: developers are flooded by the mass of information and need to find by themselves the interesting parts of the trace.
In this paper, we propose a method for assisting users in their search for information in trace files. This method relies on an algorithm that we propose for finding repetitive patterns of events in execution traces. While the usual representation of a trace is a sequential list of events, this algorithm permits to organize the trace by grouping events into loops and sequences, which reflects the program structure. The second part of the method consists of selecting the parts of the traces that may contain useful information for the user. This way, the application developer can start his performance analysis by focusing on a small subset of the trace in the first place.
The remainder of this paper is organized as follows: Sec-tion II presents the related work; SecSec-tions III and IV constitute the contribution of this paper by presenting respectively the pattern detection and the trace filtering algorithm. Section V deals with implementation details. Section VI consolidates the paper through evaluation. Finally, Section VII concludes the paper and discusses future work.
II. RELATED WORK
The need to extract useful information from execution traces has been studied for a long time now. Since parallel applications massively rely on MPI, several researches have focused on the detection of communication patterns based on MPI messages [1], [2], [3]. The communication patterns can provide a high level understanding of the application [2]. Besides, the communication schemes of multiple applications can be compared in order to detect similarities in their access
patterns [3]. Several studies have focused on using communi-cation patterns to assess the scalability of a parallel applicommuni-cation: by running a program on a small number of nodes, the communication pattern can be extrapolated in order to estimate the performance of the application when it is run on a large number of nodes [4], [5].
Searching for a set of pre-defined patterns is another recent trend. For instance, some tools try to detect inefficient behavior of an application by searching for some execution patterns [6]. Classical parallel programming problems (such as late sender) can be detected using this technique. The identification of such pre-defined patterns in an application can be combined with compilation techniques to automatically transform the application in order to improve its performance [7].
While most of these pattern detection mechanisms are performed post-mortem, specific communication patterns can also be identified at runtime and replaced with semantically equivalent but faster communication (such as collective com-munication primitives) [8].
Apart from communication patterns, multiple works have shown that studying memory access patterns can be useful. Analyzing the memory access patterns of an application per-mits to predict future memory accesses and thus to prefetch data and to improve the cache-hit rate [9]. Memory accesses also provide a profile for applications and permit to model the program performance [10]. Access patterns are also used for predicting future disk accesses in file systems, allowing to prefetch blocks of data [11]. A similar mechanism can be used in parallel file systems for predicting future client accesses [12] or disk accesses [13].
Pattern mining techniques are used in several works in order to detect patterns of events [17], [18]. However, the per-formance of the proposed algorithms are prohibitive: detecting patterns in small traces takes dozens of seconds [19]. In this paper, we propose a simplier pattern mining algorithm that can be used during the performance analysis without expensive computation.
The need for a tool able to process large execution traces has led to the design of distributed systems able to analyze traces in parallel and to provide a visualization client with processed data [14]. The scalability of performance analysis tools is also limited by the size of trace files that can be compressed [15]. Another way to reduce the size of a trace consists of removing some of its events when it becomes too large [16]. To the best of our knowledge, most of the research effort on the processing of execution traces has focused on the ability of tools to process large traces. However, little effort has been made on helping users analyze traces. Our intent in this paper is to provide a way to select the parts of a trace that are the more likely to contain useful information for the user.
III. DETECTING PATTERNS
When visualizing the execution trace of parallel applica-tions, developers may have difficulties finding the parts of the trace that reveal the application flaws responsible for the poor performance. The main difficulty comes from the size of the group of events that can reveal the problem compared to the size of the trace: while an execution trace can be composed of
P#0
P#1
P#2
P#3
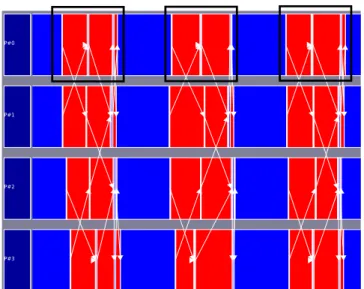
Fig. 1. Example of a sequence of events (in black) that appears several times in a trace
millions of events, the interesting part of the trace may contain only a few tens or hundreds of events.
The difficulty of this search for a needle in a haystack comes from the way of representing execution traces: while a program is composed of functions, loops or other building blocks, a trace is viewed as a sequential list of events that does not reflect the structure of the program. Understanding the global structure of the program and spotting the problematic part of the trace thus require to browse the whole list of events, which necessitates the expertise from the application developer. We intend to help program developers in their search for interesting events in the execution trace. Due to the structure of programs, traces usually include sequences of events that are repeated at several moments of the execution. For instance, in Figure 1, a sequence of events (in black) is repeated several times in process #0. We propose to detect automatically these patterns and to filter them in order to restrict the number of events that the user has to examine.
In this Section, we propose an algorithm that converts a sequential list of events into a more structured list that reflects the structure of the program. This list is composed of sequences of events, loops and single events. Such a structured list is then used in Section IV for detecting points of interest that are likely to contain useful information for the application developer.
A. Definitions
We define an event as something that happens at a precise date. It can be the program entering or leaving a function, the application sending or receiving an MPI message, or any other event that can be timestamped. When comparing two events e1 and e2, we state that e1= e2 if:
• both e1 and e2 enter (or leave) the same function.
• both e1and e2send (or receive) the same type of MPI
message. The source process, the destination process, the message tag and the message length have to be equal for both events.
a b c d a b c e 1 2 3 4 5 6 7 8 a b c d a b c e 1 2 3 4 5 6 7 8 P #1 P #1
Fig. 2. Step 1: find a sequence of two consecutive events that appears several times to form a pattern
c d e 3 4 8 P #1 P #1 P #1 P #1 c3 d4 e 8 P #1 P #1 P #1 2 x c d e 3 4 8 P #1 P #1 3 x
Fig. 3. Step 2: compare each occurrence of a pattern with the following event and form loops
A pattern is defined as a sequence of consecutive events that appears in the same order and occurs several times in a trace.
B. Pattern detection algorithm
The detection of patterns within a sequential list of events can be viewed as a variation of a compression algorithm [20] that consists of finding sequences of events that appear several times in the trace.
The first step of the pattern detection consists of finding a sequence of two consecutive events (a, b) that appears several times. As depicted in Figure 2, when such a sequence is found, (a, b) is replaced with a pattern p1that refers to (a, b). It is to
be noted that the occurrences of the events (a, b) are not freed as each event has its own particularities (timestamp, function parameters, etc.) that need to be kept for further analysis of the trace.
Once a pattern p1is found, the next step consists of finding
loops composed of p1. As depicted in Figure 3, this is done
by comparing each occurrence of p1 with p1 → next and
grouping them into a loop if both terms are equal.
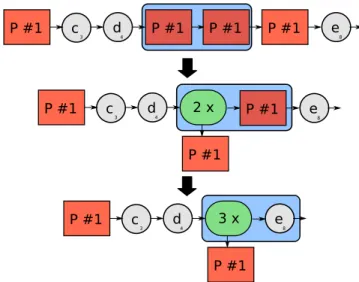
The next step is to try to expand pattern p1. To this end,
we compare the event that follows each occurrence of p1. As
depicted in Figure 4, this can lead to three possibilities:
• If p1→ next is always c (case 1), c can be integrated
in p1
• If multiple occurrences of p1→ next are c but some
are different (case 2), we define a new pattern p2that
refers to (p1, c)
• If p1 → next is c only once, then pattern p1 cannot
be expanded
If step 3 successfully expands p1 (case 1) or creates p2
(case 2), we apply recursively step 2 and step 3 to the newly defined pattern. Thus, steps 2 and 3 are repeated as long as p1
or p2 (or any new pattern) can be expanded or combined into
loops. When steps 2 and 3 leave p1and p2unchanged, we use
step 1 to find another pattern within the sequence of events.
C. Discussion
Our proposed algorithm relies on the temporal order of events for defining patterns of events. Thus, unlike other pattern detection mechanisms, this algorithm focuses on find-ing patterns within a sfind-ingle execution flow: the detection of patterns in the execution trace of an MPI+OpenMP application with 32 processes, each running 4 threads, thus requires to run the pattern detection algorithm on each of the 128 threads.
While the detection of patterns within a thread is sequen-tial, it is independent from the detection of patterns in other threads, that is to say the detection can be run in parallel.
The theoretical complexity of the algorithm is dominated by the complexity of step 1 (O(n2), where n is the number of events in the trace). However, in practice, step 1 is not called for each event in the trace since some events (such as those that are already included in a pattern) can be skipped. The duration of step 1 thus depends on the size of patterns.
Once a pattern is found, the complexity of steps 2 and 3 depend on the number of occurrences of the pattern, which is usually negligible compared to the number of events in the trace.
IV. FILTERING PATTERN OCCURRENCES
When analyzing the performance of scientific parallel applications using tracing tools, users have to find useful information among millions of events. In this Section, we present a filtering method for assisting users by selecting the parts of the trace that are more likely to contain useful information. The intent of this filtering mechanism is not to avoid the need for the user to analyze the whole trace, but to detect points of interest that should be analyzed in the first place.
Due to the structure of parallel application, a trace file usually contains a large number of sequences of events that have similar properties. For instance, applications that rely on iterative kernels (such as Jacobi) execute the same sequence of instructions for each step of the algorithm. When each step of the algorithm processes the same quantity of data, it is likely that all the steps have more or less the same duration. Thus, the trace files of a program that iterates over 200 identical steps probably contains information that is almost duplicated: most of the sequences of events that correspond to the iterations
a b c d 1 2 3 6 P #1 a b c 7 8 9 P #1 a b c d 1 2 3 6 P #1 a b c 7 8 9 P #1 (a) Case 1 a b c a b d 1 2 3 4 5 6 P #1 P #1 a b c 7 8 9 P #1 a b c a b d 1 2 3 4 5 6 P #1 P #1 a b c 7 8 9 P #1 P #2 P #2 (b) Case 2 Fig. 4. Step 3: expanding patterns
1 10 0 10 20 30 40 50 60 70 Count Pattern duration (µs) CG.A.16 Pattern #112
Fig. 5. Distribution of the occurrences of pattern 112 from CG.A.16.
have approximately the same duration. We propose to detect such duplicated information and to select only the iterations that differ significantly from the others in order ro reduce the number of events that application developers have to analyze. The iterations of a parallel application can be interpreted as patterns of events by the algorithm presented in Section III. Comparing each occurrence of a pattern permits to select the occurrences that may be of interest for users. Analyzing the distribution of the duration of the occurrences of a pattern permits to detect duplicated information and to find points of interest.
A. Regular patterns
Some applications, such as those which rely on stencil kernels, tend to have very regular iterations. In such appli-cation, all the iterations have roughly the same duration. The distribution of the duration of the occurrences of the pattern corresponding to the iteration thus usually shows one “peak”. Figure 5 depicts the distribution of the pattern correspond-ing to the main loop in the CG kernel from the NAS Parallel benchmarks suite executed on 16 MPI processes for class A. The resulting distribution shows one peak: in this distribution,
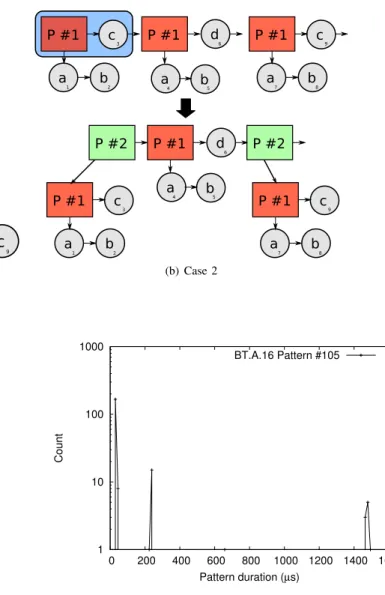
1 10 100 1000 0 200 400 600 800 1000 1200 1400 1600 Count Pattern duration (µs) BT.A.16 Pattern #105
Fig. 6. Distribution of the occurrences of pattern 105 from BT.A.16.
all the occurrences of the pattern have a duration comprised between 60 µs and 63 µs. Since all the occurrences of this pattern have approximately the same duration, visualizing only one of these occurrences is probably enough to understand the behavior of the pattern: the difference between an occurrence that lasts 61 µs and another whose duration is 63 µs is neglictible.
B. Regular patterns with multiple duration profiles
In some applications, the distribution of the duration of the occurrences of a single pattern may show multiple “peaks”. This may be caused by a function processing multiple data sizes. Another explanation could be an interaction between the pattern and another thread that is holding a lock in some cases.
Figure 6 depicts the distribution of the pattern correspond-ing to the main loop of the BT kernel from the NAS Parallel benchmarks suite executed on 16 MPI processes for class A. The resulting distribution shows three peaks: 87 % of the occurrences of this pattern have a duration comprised between 39 µs and 47 µs, 8 % of the occurrences have a duration comprised between 236 µs and 250 µs, and 5 % of the
P#0
P#4
Fig. 7. “Short” occurrence of the main pattern (in black) from NPB BT kernel (CLASS=A, NPROCS=16)
occurrences have a duration comprised between 1464 µs and 1493 µs. In this case, selecting the predominant occurrence (that has a duration comprised between 39 µs and 47 µs) would not allow users to understand what happens in the application in some cases. However, selecting one occurrence per detected peak and comparing them permits to understand the root of the application problem.
Figures 7 and 8 depict respectively one “short” occurrence (ie. an occurrence whose duration is comprised between 39 µs and 47 µs) and one “medium” occurrence (ie. an occurrence whose duration is comprised between 236 µs and 250 µs). Some of the MPI processes were removed from the figures in order to improve their readability. Comparing the two occurrences permits to see that the difference comes from the process #4 that takes a long time to receive a message in the “medium” case.
Selecting one occurrence of a pattern per peak in its distribution thus permits to select points of interest that allow the user to quickly analyze the trace: instead of analyzing all the iterations of the pattern, the user only needs to visualize three occurrences.
C. Irregular patterns
Among the detected patterns, some may show an irregular distribution of the duration of their occurrences. This may happen, for instance, when a function processes differents block sizes or in irregular applications.
Figure 9 depicts the distribution of the pattern corre-sponding to the communication phase that happens at each iteration of an LU decomposition. While most occurrences of the pattern have a duration comprised between 0 and 1 µs, some occurrences have a longer duration (up to 14 µs). Such irregular distribution may happen when a function of the application processes data with a varying size.
In the case of such irregular pattern, finding peaks may permit to detect a number of occurrences with similar duration (in the case of LU, around the 0 µs peak), but other occurrences remain. In order to reduce the number of occurrences to
P#0
P#4
Fig. 8. “Medium” occurrence of the main pattern (in black) from NPB BT kernel (CLASS=A, NPROCS=16)
1 10 100 1000 10000 0 2 4 6 8 10 12 14 Count Pattern duration (µs) LU Pattern #7
Fig. 9. Distribution of the occurrences of pattern 7 from LU.
examine without losing too much information, the filtering process searches for peaks and removes the occurrences that have a similar duration as the peak. For instance, if there is a peak at n µs, occurrences whose durations are comprised between n − 10 % and n + 10 % can be considered as similar to the reference occurrence. The [−10 % + 10 %] window is chosen arbitrarily: it allows to reduce the number of occurrences that user should analyze while allowing a variation of the occurrences duration.
V. IMPLEMENTATION
In order to evaluate the mechanisms that we propose, we implemented the pattern detection algorithm and the filtering mechanism in the EZTrace framework for performance analy-sis [21]. However, it could be used in any performance analyanaly-sis tool.
EZTrace is a modular framework designed for performance analysis that is available as open source. It is able to instrument functions and record events in trace files. Several modules are provided that contain function instrumentation for standard libraries like MPI or pthread. In addition to the pre-defined
modules, EZTrace provides simple means to generate user-defined modules.
EZTrace uses a two-phase mechanism for analyzing appli-cations. During the execution of the application, functions are intercepted and events are recorded in trace files. In the case of an MPI application, each MPI process generates a trace file. After the execution of the application, the post-mortem analysis phase is in charge of interpreting the recorded events. During this phase, EZTrace can generate a trace file viewable with visualization tools such as ViTE [22] or Vampir [23], or it can compute statistics in order to analyze the overall characteristics of the application (communication scheme, OpenMP parallel regions, etc.)
The pattern detection algorithm that we propose is imple-mented in the post-mortem phase. The algorithm is executed over each event list (one list per thread in the application). We consider all the available events collected by EZTrace: MPI events, OpenMP events, CUDA events, etc. Since the detection of patterns in a list is independent of other lists, the algorithm is parallelized with OpenMP: each thread of the application can be processed in parallel. The filtering algorithm is then applied to each process independantly. EZTrace detects sequences that have similar durations and removes them from the generated trace. The list of points of interest is also given to the user so that he can compare similar sequences with different durations. It is to be noted that currently, the detection of the pattern in all the MPI processes is performed in a single process parallelized with OpenMP. The scalability of the parallelization of the pattern detection is thus limited since it is executed on a single node. Our future work includes improving the scalability of this process by executing it at the end of the first phase (ie. just before the application calls MPI_Finalize). This would allow us to exploit multiple nodes and thus to increase the parallelism.
VI. EVALUATION
In this Section, we propose to evaluate the algorithms we described in the previous Sections. We first evaluate the time needed to apply the algorithm of pattern detection by tracing programs with various number of events to register. We consider a simple MPI ping-pong, a strictly regular pattern repetition, and then NAS parallel benchmarks that present more realistic patterns.
We then evaluate the efficiency of the filtering algorithm: various traces from the NAS parallel benchmarks are filtered in order to detect their points of interest.
It is to be noted that both the pattern detection algorithm and the filtering process are performed offline. Thus, they do not affect the performance of the analyzed applications.
A. Platform
The experiments were conducted on a cluster of four compute nodes. Each of them is a 4-core Intel Xeon E5-2603 (Sandy Bridge) 1.80GHz with 10MB cache and 8GB of memory running under Linux, with kernel version 3.2.0. The compute nodes are interconnected through a gigabit Ethernet network. During the generation of traces, up to four nodes of the cluster were used, while only one node was used for detecting patterns in traces.
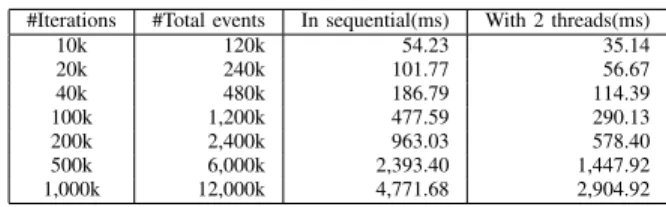
#Iterations #Total events In sequential(ms) With 2 threads(ms)
10k 120k 54.23 35.14 20k 240k 101.77 56.67 40k 480k 186.79 114.39 100k 1,200k 477.59 290.13 200k 2,400k 963.03 578.40 500k 6,000k 2,393.40 1,447.92 1,000k 12,000k 4,771.68 2,904.92
TABLE I. DURATION OF THE PATTERN DETECTION ON A PING-PONG.
B. Pingpong
To evaluate the performance of the pattern detection, we first run a simple MPI ping-pong program between two processes. After the master first sending, each pro-cess basically enters a loop where it does a blocking re-ception (MPI_Recv()) followed by the blocking emission (MPI_Send()) of a 16-bytes message, small enough not to trigger an acknowledged exchange. In term of traces, each process records 6 different events : enter mpi_send, send message, leave mpi_send, enter mpi_recv, receive messageand leave mpi_recv. Thus, by run-ning a 100k-iteration ping-pong, 600k events have been reg-istered per process and 1,200k in total. The pattern detection algorithm described in Section III runs over each of the two event lists. Due to the extremely regular execution scheme of the application, EZTrace detects only one pattern in each event list. Each list is composed of a loop that iterates over the following pattern:
• Enter function MPI_Recv • Receive a message from process x • Leave function MPI_Recv • Enter function MPI_Send • Send a message to process x • Leave function MPI_Send
This case represents the ideal case for our algorithm as the step 1 is performed only once: the first iteration of this step detects all the iterations of the pattern. Results of the experiments are reported in Table I.
The results show that the pattern detection is performed in reasonable time: a few seconds for the trace that contains 12 millions events. Moreover, the pattern detection time linearly increases with the number of events. The theoretical complex-ity of step 1 (O(n2), where n is the number of events in the trace) thus does not affect the actual performance of the algorithm in this case. The results also show that the pattern detection can be performed in parallel by employing OpenMP threads.
C. NAS Parallel Benchmarks
To go further in our evaluation, we study the patterns of the MPI version of NAS Parallel Benchmarks (NPB). NPB are constituted of several SPMD benchmarks that present regular but more scattered patterns as described in [24]. As we benefit from four quad-core nodes, each test case is run with 16 MPI processes, generating 16 event lists. Nevertheless, we centralized the pattern detection on one node. Thus, the 16 traces are processed by using 4 OpenMP threads.
kernel #events #patterns pattern detection(ms) #step 1 pattern size #iterations occupation(%) EP 3,090 32 3.51 1136 31 5 96.9 FT 10,256 80 9.44 1360 31 6 91.2 IS 18,552 48 35.43 1482 96 11 91.0 CG 284,754 160 178.23 2816 1,104 16 99.2 MG 118,688 2728 186.17 14455 31 101 42.2 SP 557,318 174 596.84 2681 86 401 99.0 BT 399,944 112 951.50 4048 122 201 98.1 LU 4,568,002 210 4,564.80 8540 756 248 98.6
TABLE II. DURATION OF THE PATTERN DETECTION ONNPB (CLASS=A, NPROCS=16)
Table II reports, for each NAS Parallel benchmark kernel, the total number of events (#events), the number of detected patterns (#patterns), the duration of the pattern detection, the number of times that step 1 was invoked (#step 1). The number of events that constitute the outermost pattern in each trace is also reported (pattern size), as well as the number of iterations of this pattern (#iterations) and the percentage of events that are included in the outermost patterns (occupation(%)).
These results show that the duration of the pattern detection remains reasonable: in the worst case (when the trace consists of 4.5 millions events) it only takes a few seconds to process the trace files.
While the duration of the detection tends to increase with the number of events in the traces, it is to be taken only as a rule of thumb. For instance, while the trace of the BT kernel contains 400 thousands events and is processed in 930 ms, the trace of the SP kernel is larger (550 thousands events) but is processed faster (620 ms). As discussed in Section III, this is due to the complexity of the pattern detection algorithm that is dominated by step 1. Since each invocation of step 1 causes to browse the event list, the approximate cost of step 1 is thus the number of calls to step 1 multiplied by the number of events. The approximate cost of step 1 for SP (ie. 2,681 calls to step 1 * 557,318 events = 1,494,169,558) and for BT (1,618,973,312) partially explains the performance difference.
In terms of accuracy, the pattern detection algorithm suc-cessfully captures the structure of the tested programs: the iterations of the outermost patterns correspond to the iterations in the application in all cases. In most cases, the outermost patterns include almost all the events of the trace. The results also show that the number of detected patterns in each trace remains low (except for the MG kernel): a pattern being specific to a process, less than 15 patterns are detected for each process.
The results for the MG kernel are different from the results of the other kernels: the detection algorithm reports 2728 different patterns and the outermost pattern only represents 42 % of the trace size. This can be explained by the structure of the MG program: the initialization phase of the application includes a large number of MPI communications compared to the computational core of the application.
D. Filtering traces
In addition to the evaluation of the pattern detection algo-rithm, we evaluate the efficiency of the algorithm described in Section IV for filtering traces. The experiment consists of filtering the NPB traces presented in the previous subsection and computing the reduction ratio.
kernel #events #events after filtering #events per process reduction(%)
EP 3,090 2,873 179.6 7.0 % FT 10,256 6,704 419 34.6 % IS 18,552 15,948 996.7 14.0 % MG 118,688 41,031 2,564.4 65.4 % CG 284,754 11,724 732.7 95.8 % BT 399,944 24,338 1,521.1 93.9 % SP 557,318 68,287 4,267.9 87.7 % LU 4,568,002 42,881 2,680.1 99.0 %
TABLE III. FILTERING EVENTS ONNPB (CLASS=A, NPROCS=16)
Table III shows the results of this experiment. The table reports, for each kernel, the number of events before filtering (#events), the number of events in the filtered trace (#events after filtering), the number of events per process in the filtered trace (#events per process) and the corresponding reduction percentage (reduction (%)). These results show that EZTrace successfully reduces the number of events that user should analyze.
The percentage of reduction depends on the trace size. The small traces (for instance kernels EP, FT and IS) have a smaller relative reduction. This is mainly due to the small number of iterations combined with a high variation of the patterns occurrences for these applications. This prevents EZTrace from finding occurrences with similar duration that can be filtered. On the contrary, the large traces (for instance, kernels CG, BT, SP or LU) can be reduced by up to 99 %. Indeed, these kernels iterate over more than 100 steps. Moreover, the variation of these steps is low. Most iterations are thus similar and can thus be filtered.
The behavior of the filtering process for the MG trace reflects the problem reported in the previous subsection. The initialization and termination phases of this trace generate a lot of patterns that have a low number of occurrences. These patterns are hard to filter efficiently, which causes the low reduction ratio.
The result also show that the number of events per process that user have to analyze is low in all the tested applications: in the worst case (SP), only 4268 events per process are selected during the filtering process, reducing the complexity for the user to analyze the traces.
VII. CONCLUSION
The evolution of hardware architecture as well as the complexification of the software stack have made it almost mandatory to use performance analysis tools in order to understand the performance of a parallel application. While tracing tools permit to analyze precisely the behavior of a
program, the size of trace files – that can be composed of millions of events – makes it difficult for developers to find useful information. Understanding the global behavior of the program or spotting the group of events that shows the cause of the poor performance require an arduous work.
In this paper, we proposed an algorithm for selecting points of interest that the user should examine first when analyzing an execution trace. The first step of this algorithm consists of detecting repetitive patterns in trace files. While a trace is usually represented as a sequential list of events, this algorithm aims at representing it as a program composed with functions, loops, etc. Grouping events according to the detected pattern permits to get an overview of the program global behavior. The filtering process is then applied in order to find points of interest that are more likely to contain useful information to the user. By analyzing the distribution of sequences of events, our method detects and filters sequences of events that present a similar behavior. Thus, if a pattern occurs several hundreds times in the trace, most of the occurrences of the pattern are similar and can thus be set aside. This permits to select a restricted number of groups of events that should be examined in priority when visualizing a trace file. Developers thus do not need to analyze millions of events to find useful information. We have implemented the proposed mechanisms in the EZTrace performance analysis platform. The experiment re-sults we have conducted on multiple benchmarks demonstrate that the implementation successfully detects patterns in all the tested traces. Our approach completes the pattern detection in a few seconds in the worst case. The parallelization of the pattern detection permits to exploit multicore processors efficiently. Moreover, the evaluation shows that large traces can be filtered efficiently and the number of events to analyze reduced by up to 99 %.
In the future, we plan to enhance the parallelism of the pattern detection: analyzing the trace while using MPI (instead of the current OpenMP implementation) should improve the parallelism of the analysis as well as its scalability. We also plan to study the visualization of patterns. While traditional visualization tools depict traces as sequences of events, it should be interesting to use the pattern structure in order to present the trace in a more logical way.
REFERENCES
[1] L. Alawneh and A. Hamou-Lhadj, “Pattern recognition techniques applied to the abstraction of traces of inter-process communication,” in Software Maintenance and Reengineering (CSMR), 2011 15th European Conference on. IEEE, 2011, pp. 211–220.
[2] R. Preissl, T. Kockerbauer, M. Schulz, D. Kranzlmuller, B. Supinski, and D. J. Quinlan, “Detecting patterns in MPI communication traces,” in Parallel Processing, 2008. ICPP’08. 37th International Conference on. IEEE, 2008, pp. 230–237.
[3] C. Ma, Y. M. Teo, V. March, N. Xiong, I. R. Pop, Y. X. He, and S. See, “An approach for matching communication patterns in parallel applications,” in Parallel & Distributed Processing, 2009. IPDPS 2009. IEEE International Symposium on. IEEE, 2009, pp. 1–12.
[4] X. Wu and F. Mueller, “ScalaExtrap: Trace-based communication extrapolation for SPMD programs,” ACM SIGPLAN Notices, vol. 46, no. 8, pp. 113–122, 2011.
[5] J. Panadero, A. Wong, D. Rexachs del Rosario, and E. Luque Fad´on, “Predicting the communication pattern evolution for scalability anal-ysis,” in XVIII Congreso Argentino de Ciencias de la Computaci´on, 2013.
[6] F. Wolf, B. Mohr, J. Dongarra, and S. Moore, “Efficient pattern search in large traces through successive refinement,” in Euro-Par 2004 Parallel Processing. Springer, 2004, pp. 47–54.
[7] R. Preissl, M. Schulz, D. Kranzlm¨uller, B. R. de Supinski, and D. J. Quinlan, “Using MPI communication patterns to guide source code transformations,” in Computational Science–ICCS 2008. Springer, 2008, pp. 253–260.
[8] T. Hoefler and T. Schneider, “Runtime detection and optimization of collective communication patterns,” in Proceedings of the 21st interna-tional conference on Parallel architectures and compilation techniques. ACM, 2012, pp. 263–272.
[9] J. Lee, C. Park, and S. Ha, “Memory access pattern analysis and stream cache design for multimedia applications,” in Design Automation Conference, 2003. Proceedings of the ASP-DAC 2003. Asia and South Pacific. IEEE, 2003, pp. 22–27.
[10] A. Snavely, N. Wolter, and L. Carrington, “Modeling application per-formance by convolving machine signatures with application profiles,” in Workload Characterization, 2001. WWC-4. 2001 IEEE International Workshop on. IEEE, 2001, pp. 149–156.
[11] X. Ding, S. Jiang, F. Chen, K. Davis, and X. Zhang, “DiskSeen: Exploiting Disk Layout and Access History to Enhance I/O Prefetch.” in USENIX Annual Technical Conference, vol. 7, 2007, pp. 261–274. [12] S. Byna, Y. Chen, X.-H. Sun, R. Thakur, and W. Gropp, “Parallel
I/O prefetching using MPI file caching and I/O signatures,” in High Performance Computing, Networking, Storage and Analysis, 2008. SC 2008. International Conference for. IEEE, 2008, pp. 1–12. [13] J. Liao, X. Liu, and Y. Chen, “Dynamical re-striping data on storage
servers in parallel file systems,” in Proceedings of the 2013 IEEE 37th Annual Computer Software and Applications Conference. IEEE Computer Society, 2013, pp. 65–73.
[14] H. Brunst, D. Kranzlm¨uller, and W. E. Nagel, “Tools for scalable parallel program analysis-vampir ng and dewiz,” in Distributed and Parallel Systems. Springer, 2005, pp. 93–102.
[15] M. Noeth, P. Ratn, F. Mueller, M. Schulz, and B. R. de Supinski, “Scalatrace: Scalable compression and replay of communication traces for high-performance computing,” Journal of Parallel and Distributed Computing, vol. 69, no. 8, pp. 696–710, 2009.
[16] M. Wagner, A. Knupfer, and W. E. Nagel, “Hierarchical memory buffering techniques for an in-memory event tracing extension to the open trace format 2,” in Parallel Processing (ICPP), 2013 42nd International Conference on. IEEE, 2013, pp. 970–976.
[17] H. Safyallah and K. Sartipi, “Dynamic analysis of software systems using execution pattern mining,” in Program Comprehension, 2006. ICPC 2006. 14th IEEE International Conference on. IEEE, 2006, pp. 84–88.
[18] P. L´opez Cueva, A. Bertaux, A. Termier, J. F. M´ehaut, and M. Santana, “Debugging embedded multimedia application traces through periodic pattern mining,” in Proceedings of the tenth ACM international confer-ence on Embedded software. ACM, 2012, pp. 13–22.
[19] N. R. Mabroukeh and C. I. Ezeife, “A taxonomy of sequential pattern mining algorithms,” ACM Computing Surveys (CSUR), vol. 43, no. 1, p. 3, 2010.
[20] J. Ziv and A. Lempel, “A universal algorithm for sequential data compression,” IEEE Transactions on information theory, vol. 23, no. 3, pp. 337–343, 1977.
[21] F. Trahay, F. Rue, M. Faverge, Y. Ishikawa, R. Namyst, and J. Dongarra, “EZTrace: a generic framework for performance analysis,” in IEEE/ACM International Symposium on Cluster, Cloud and Grid Computing (CCGrid), Newport Beach, CA ´Etats-Unis, 05 2011. [Online]. Available: http://hal.inria.fr/inria-00587216/en/ [22] K. Coulomb, A. Degomme, M. Faverge, and F. Trahay, “An
open-source tool-chain for performance analysis.” Springer, 2011. [Online]. Available: http://hal.archives-ouvertes.fr/hal-00707236
[23] M. S. M¨uller, A. Kn¨upfer, M. Jurenz, M. Lieber, H. Brunst, H. Mix, and W. E. Nagel, “Developing scalable applications with vampir, vampirserver and vampirtrace.” in PARCO, 2007, pp. 637–644. [24] R. Riesen, “Communication patterns,” in Proceedings of the 20th
International Conference on Parallel and Distributed Processing, ser. IPDPS’06. Washington, DC, USA: IEEE Computer Society, 2006, pp. 275–275.