Science Arts & Métiers (SAM)
is an open access repository that collects the work of Arts et Métiers Institute of
Technology researchers and makes it freely available over the web where possible.
This is an author-deposited version published in:
https://sam.ensam.eu
Handle ID: .
http://hdl.handle.net/10985/13303
To cite this version :
Imade KOUTIRI, Etienne PESSARD, Patrice PEYRE, Ouafae AMLOU, Thibaut DE TERRIS
-Influence of SLM process parameters on the surface finish, porosity rate and fatigue behavior of
asbuilt Inconel 625 parts Journal of Materials Processing Technology,. Vol. 255, p.536546
-2018
Any correspondence concerning this service should be sent to the repository
In
fluence of SLM process parameters on the surface finish, porosity rate and
fatigue behavior of as-built Inconel 625 parts
Imade Koutiri
a,⁎, Etienne Pessard
b, Patrice Peyre
a, Ouafae Amlou
a, Thibaut De Terris
a aArts et Métiers ParisTech, CER Paris-Laboratoire PIMM– UMR 8006 CNRS – ENSAM – CNAM, 151 Bd de l’hôpital, 75013 Paris, France bArts et Métiers ParisTech, CER Angers - Laboratoire LAMPA - 2 Bd du Ronceray, 49035 Angers Cedex 1, FranceA R T I C L E I N F O
Keywords: SLM Particle Fatigue Inconel 625 Porosity SurfacefinishA B S T R A C T
This paper is dedicated to understanding fatigue crack initiation for an Inconel 625 manufactured by SLM, using a hatching + contour procedure. In thefirst part of the paper, an optimum set of parameters was found to deliver the best surface roughness combined with low porosity. This process optimization, mostly focused on adjusting the volume energy density aimed atfinding a compromise between an optimum densification state and a minimum number of contaminating spatters. Secondly, a fatigue test campaign has been conducted on as-built SLM samples or polished samples. The analysis of failure surfaces allowed identifying different heterogeneities at the origin of the fatigue damage for each configuration. The embedded particles on the surface of as-build specimens have been shown to play an important role in fatigue and need to be optimized or taken into account in the fatigue strength design of SLM components.
1. Introduction
Additive Layer Manufacturing (ALM) currently impacts several in-dustrial sectors, ranging from medical to aerospace and energy. Since 2003, there has been a 42% increase of parts produced by additive manufacturing. ALM processes, generating mechanical parts layer by layer, allow realizing complex shapes which are not achievable by traditional processes at significantly reduced cost. A limitation for the development of this process is still considered to be the mechanical properties obtained of as-built ALM parts, and the possible occurrence of defects, allowing the direct use-or not- of these parts in an industrial environment.
Static properties of ALM materials have been the subject of a tre-mendous number of works in the past 3 years, and it has been shown that ALM alloys could exhibit correct static mechanical resistance compared to wrought or cast alloys. For instance, Chastanda et al. (2016)show that fatigue properties of Titanium Ti6Al4V parts built by SLM are comparable to casting after stress relieving and comparable to wrought processes after an HIP heat treatment.
The durability of ALM parts has become an important topic to ad-dress for many applications, fatigue failure of materials being one of the most common damage modes in cyclically loaded metallic materials. Many works have resulted in a better knowledge of the phenomena involved. These studies contributed to a better understanding of the mechanisms of crack initiation involved on ALM materials and
proposed new models to predict the material fatigue behavior. In many papers, it appears that high cycle fatigue cracks, for part with as-built surface, usually initiate on:
- porosities on the surface or sub-surface, generated by ALM process for different materials like Ti6AL4V (Ellyson et al., 2017), AlSi10Mg (Brandl et al., 2012), AlSI12 for very high cycle fatigue (Siddique et al., 2017) and 630 stainless steel (Akita et al., 2016). Such sub-surface porosities are mostly located in the transition zone between contour path and hatching path.
- Elevated surface roughness, especially on inclined parts, that tends to generate stress concentration factors and favor crack's initiation. - Un-melted particles located close to the surface of specimens. Such particles have been observed already on a Ti6AL4V (Fatemi et al., 2017) and on a AlSi10Mg (Brandl et al., 2012).
Following this last statement, one of the well-known issues in SLM is the contamination of the powder bed surface by large spatters (Khairallah et al., 2016) generated during laser– powder bed – melt-pool interaction. The generation of such spatters is usually favored by high volume energy densities VED = P/ (S. V) (high power P, low scan velocity V, small laser-irradiated surface S) that tend to destabilize melt-pools and surrounding powder beds. However, it is also well known that high VED values are required to obtain an optimum den-sification state. For this reason, and because a compromise is hard to
⁎Corresponding author.
E-mail address:imade.koutiri@ensam.eu(I. Koutiri).
find, most of SLM parts are systematically submitted to post-machining steps (sand blasting, electro-polishing, grinding) to improve surface finish. Such machining steps are not easy to carry out on complex shapes, and in some specific cases, as-built SLM samples can be en-visaged for parts submitted to reduced static or cyclic loading. Conse-quently, mechanical investigations on as-built samples are still of im-portance.
The current study focuses mainly on the effects of material's het-erogeneities (surface roughness and porosity) generated in an Inconel 625 part by the SLM process. In afirst step, process parameters such as laser power P, beam diameter D, scanning speed V and orientation angleθ of the piece versus the building platform will be varied in order to optimize surface roughness and porosity rate (considered as the percentage of void spaces in a material over the total volume). In a second step, as-built specimens manufactured with optimum SLM conditions will be submitted to cyclic loading in order to evaluate fa-tigue limits and to detect the origin of the crack initiation.
2. Experimental procedure: Inconel 625 and SLM conditions
Selective Laser Melting (SLM) is one of the two powder bed method (with EBM) for the additive manufacturing of metallic alloys. It allows the processing of a large range of metals including Ni-based alloys, stainless steels, cobalt-chromium, aluminum and titanium alloys.
2.1. Inconel 625
A wide range of Ni-based superalloys, like Inconel 718, Nimonic 623 has been manufactured already with additive layer process, including Inconel 625. This nickel based superalloy is widely used in applications like supercritical water reactors or engine with high temperatures. It combines high mechanical properties with good corrosion resistance due to its high Cr content. Nickel is the principal element of this alloy and the principal constituent of the austenitic matrixγ. Ni participates also in the composition of secondary phases (γ′, γ″ and δ) and gives to the material a good resistance on a large range of temperature (from cryogenic temperatures to 900 °C).
The following table summarizes literatures data for mechanical properties of Inconel 625 in a wrought or SLM state (for horizontal and vertical direction). Our results and literature data show a variability in the mechanical properties (especially in elongation rate) depending on the set of process parameters and the building direction.
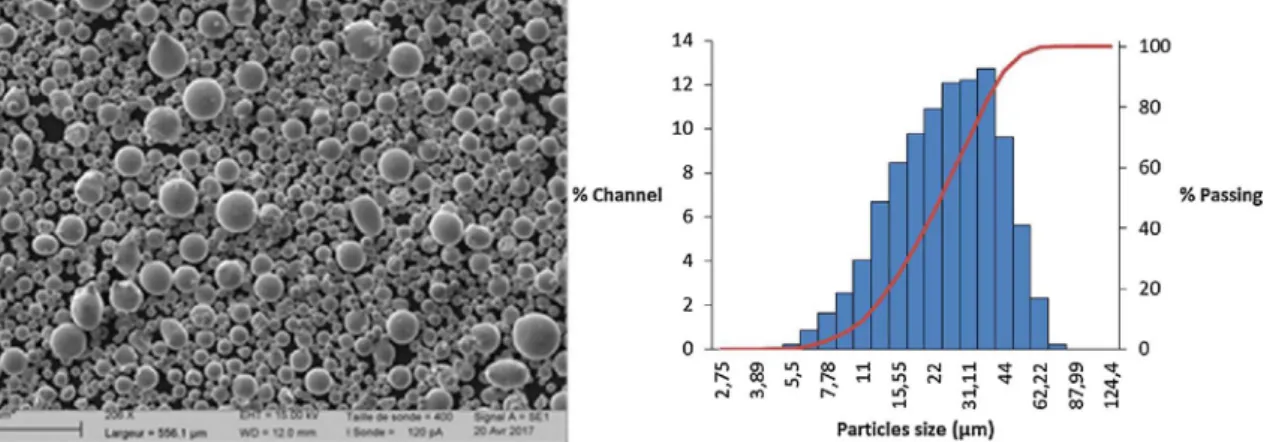
The Inconel 625 powder, obtained by inert gas atomization, was supplied by PRAXAIR with a 10–45 μm particle range. This particle distribution was confirmed by a laser granulometer device (CILAS) as shown inFig. 1. The particle shape has also been observed by Scanning Electron Microscopy (SEM). Particles present a mostly spherical shape with no satellites (Fig. 1), and no agglomeration.
Prior to SLM, the powder was systematically heated for 24 h at 50 °C in order to remove the residual moisture adsorbed on particles. This heating stage allows improving the powder spreading in order to have homogeneous powder layers.
2.2. SLM conditions
All the specimens investigated in this study are manufactured by a SLM 125HL machine provided by the SLM Solutions GmbH company. In thefirst part of the study, we will vary the irradiation parameters: laser power P (between 100 and 400 W), scanning velocity V (0.5–1.8 m/s), beam diameter D (70–160 μm), for both the contour and hatching parameters (Table 2). A specific focus will also be given to the influence of tilt angleθ (0° to 35°) between the platform and the part. The other process parameters (hatch distance, hatching strategy = stripes…) will befixed and will not be considered. The objective of this optimization step is to obtain parts with the best surface roughness and the lower porosity ratio, which are both known to promote fatigue crack initia-tion. In thisfirst stage, dedicated to the parametric study, only blocks of 10 × 18 × 4 mm were manufactured. For each set of parameters, a volume energy density (VED) has been calculated using Eq. (1). Such an equation allows considering the amount of energy induced by the laser scanning on the powder bed as an unified process parameter. This specific analytical formulation of laser energy input VED can be directly correlated to penetration depths of beads as shown analytically by (Fabbro et al., 2017) and confirmed experimentally in (Gunenthiram et al., 2018).
=
VED J m( / 3) P W( ) /V m s( / ) .A m( ²) (1)
With A = spot area (π. D²/4)
All the process parameters (Contour and hatching parameters) are reported inTable 2.
The second part of the study is dedicated to the production of tensile and fatigue samples (Fig. 2), using optimized process parameters (P, V, D). The geometry of tensile and fatigue specimens are shown inFig. 3. A rounded edge was carried out to avoid local fatigue crack initiation.
3. Influence of SLM parameters on surface finish 3.1. Influence of laser power (contour stage) and building angle
All the samples were characterized using a VEECO Dektak 150 profilometer, using a 12 μm curvature radius stylus and a 1 mg weight to scan the surfaces. The measurement technique is based on contact stylus profilometry. The non-filtered surface finish values Sa presented here below (Table 2) are the mean values of three scan surfaces of 1 × 1 mm.
Wefirst focus here on the effect of the tilt angle and contour laser
power on the surface roughness, at constant beam diameter (70μm) (samples 1–6). Even if the hatching stage is also known to affect surface roughness by varying the average temperature of parts, only contour parameters have been addressed whereas hatching parameters have been kept constant (P = 175 W and V = 0.6 m/s). Two tilt anglesθ (10° and 35°) and three laser powers (100, 140 and 180 W) have been tested. 35° was selected as the threshold angle above which supporting is usually required in SLM, due to heat accumulation in bottom sides (because of the low conductivity of powder bed). The scanning velocity isfixed and equal to 0.6 m/s. Finally, six blocks (specimen 1–6), pre-sented inTable 2have been obtained. For specimen 1–6, the VED va-lues are related only to contour parameters contrary to the other spe-cimens.
Results are presented in Figs. 4 and 5 considering Sa average roughness, which measures the arithmetic average deviation of the non-filtered measured profile from the centerline of the measured profile. Globally, Savalues are comprised between 6 and 11μm and tend to
decrease with heat input (=laser power), indicating a smoothing effect, except for the 35° angle, for which specific boundary conditions (lower heat dissipation) tend to provoke a roughness increase between 140 W and 180 W (Fig. 4). This result confirms afterwards that supporting is mandatory above θ = 35° to favour heat dissipation and limit
Table 1
Mechanical properties of Inconel 625 (Literature data).
Ref. Process UTS (MPa) Yield strength (MPa) Elongation (%) P (W) V (m/s) Powder thickness (μm)
(Yadroitsev et al., 2007) Wrought Inconel 625 930 517 40
(Yadroitsev et al., 2007) SLM Horizontal samples 1030 800 8–10 50 0.13 50 (Yadroitsev et al., 2007) SLM Vertical samples 1070 720 8–10 50 0.13 50 (Wang et al., 2016) SLM Horizontal samples 878 641 30 360 0.4 50
Table 2
Process parameters (laser power, scan speed, spot diameter and tilt angle) and resulting surfacefinish.
Number of specimen θ (°) Contour parameters VED (contour)) Hatching parameters Roughness*
P (W) V (m/s) D (μm) J/mm3 P (W) V (m/s) D (μm) Sa (μm)
Tests for Surface roughness 1 10 100 0.5 70 52 175 0.6 70 11/14
2 10 140 0.5 70 72.8 175 0.6 70 7.5/11.8 3 10 180 0.5 70 93.6 175 0.6 70 5.9/6.2 4 35 100 0.5 70 52 175 0.6 70 11/16.5 5 35 140 0.5 70 72.8 175 0.6 70 7.5/20.5 6 35 180 0.5 70 93.6 175 0.6 70 10.6/23 7 0 400 1 70 104 400 1 70 10.5 8 0 400 1.4 70 74.3 400 1.4 70 12.3 9 0 400 1.8 70 57.8 400 1.8 70 12.4 10 0 400 2 70 52 400 2 70 9.5 11 0 400 1 160 19.9 400 1 160 21 12 0 400 1.4 160 14.2 400 1.4 160 18.9 13 0 400 1.8 160 11.1 400 1.8 160 17.1 14 0 400 2 160 10 400 2 160 15.2 15 0 400 1 240 8.8 400 1 240 21 16 0 400 1.4 240 6.3 400 1.4 240 20.3
(*bold = upper surface, normal = lower surface).
Fig. 2. Workflow of the SLM pre-processing. Fig. 3. Geometry of the specimens tested in fatigue.
deleterious surfacefinish.
As shown in Fig. 5, even for low building angles (θ = 10°) a
roughness difference is systematically found between top and bottom sides of the specimen. (Leary, 2017) and (Triantaphyllou et al., 2015) observed the same behaviour in a Ti6Al4V. This indicates different temperature ranges between up and bottom sides, whatever the building angle. Thesefirst results confirm that both the angle between the platform and the part and the laser power influence the surface roughness, which can be modified by a factor 2 depending on process parameters. To explain these results, it can be assumed that the in flu-ence of laser power is two-fold: on the one hand, higher powers tend to favour layer re-melting and provoke a smoothing effect, and on the other hand excessive laser powers, combined with large anglesθ favour sticking of surrounding particles on overhanging parts in the powder bed (Fig. 6).
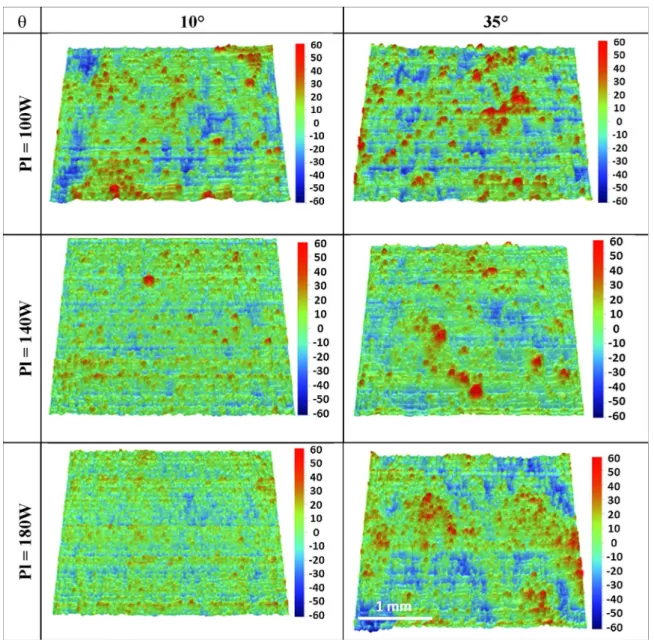
3D scans corresponding to six tests presented inFig. 4confirm the
results already presented.
- Forθ= 10°, a decrease of the surface ratio of large “red” agglom-erates on the surface with laser power is obtained. Such agglomer-ates disappear for P = 180 W.
- Forθ = 35°, large agglomerates decrease between 100 and 140 W then increase-again for P = 180 W.
This confirms that an increase of laser power tends to increase the size of the melted area, allowing a better re-melting of previous layers and a better spreading of large particles stuck and incrusted onto the surface (θ = 10°). Therefore, the quantity of agglomerated powder decreases, which improves the surface roughness. Such macro-ag-glomerates can mostly be attributed to the combination of two factors: (1) liquid spatters formed during laser-powder-melt-pool interaction, which tend to increase with VED values and contaminate powder beds and manufactured parts, or (2) to the surrounding powder bed where powder grains located in the close vicinity of the fused walls can coa-lesce, grow and stick onto the surface. Those incrusted particles are susceptible to play a dominant role during the cyclic tests and favor fatigue crack initiations as they are fully embedded in the surface as shown inFig. 7.
3.2. Influence of contour scan speed and beam diameter
In a second stage, we addressed the effect of scanning velocity and focus diameter of the contour phases on the resulting surface roughness considering a unique building angleθ = 0°. The objective was to check if the use of a single and unified energy parameter, including P, V, and D was sufficient to represent roughness variations. For these specific trials (samples 7–16 inTable 2), the laser power was increased and set constant to 400 W, the maximum available laser power of our SLM machine. Three beam diameters (70, 160 and 240μm), plus four scanning velocities (1, 1.4, 1.8 and 2 m/s) were tested. With such conditions, the VED range was larger than previously used with a 100–180 W laser power, and similar contour / hatching process para-meters were used.
At P = 400 W, one can observe (Fig. 8):
Fig. 4. Sa Roughness vs Laser Power for a tilt angle equal to 10° and 35° (upper surface) and a scan speed of 0.5 m/s.
Fig. 5. (a) Average roughness Sa measured on bottom and top surfaces for aθ = 10° building angle, (b) SEM image for P = 140W, V = 0.5 m/s (sample 2, upper side), (c) SEM image for sample 2 (lower side).
- A global decrease of Sa with VED, indicating that high energy contour conditions promote surface smoothing.
- An increase of the surface roughness value with the increase of the beam diameter.
- For a constant beam diameter, an increase of Sa with the decrease of scan velocity. However, for the low and high beam diameter value (D = 70μm and D = 240 μm), the variation of surface roughness is low, whereas for D = 160μm, a clear increase of surface roughness
is shown with an increase of the energy density, coming from a scan velocity decrease.
Even if a clear smoothing effect is globally obtained with an increase of VED, if we consider similar building angles (≈0–10°), beam dia-meters (70μm) and VED values (75–100 J/mm3), better surfacefinishes
are obtained for P = 140–180 W than for P = 400 W (samples 2,3 with Ra 6–7 μm versus samples 7,8 with Ra = 10–12 μm inTable 2). This is
Fig. 6. 3D maps (2.5 mm × 3 mm) of the SLM surfaces for P = 100, 140, 180 W andθ = 10, 35° (top surfaces) (V = 0.6 m/s).
Fig. 7. Non-melted particle (D≈ 100 μm) on a SLM surface (a) 3D scan and (b) SEM image.
assumed to be due to an increase of spattering effect for P = 400 W. The clear difference evidenced between surface finishes obtained with similar VED (for specimens 11–16 with VED between 6–20 J/ mm3) but different beam diameters mostly indicate that VED values are not sufficient to represent correctly the influence of SLM parameters on surfacefinish. Sa results presented here above mostly traduce the in-fluence of scan speed at constant laser power: lower scan speed promote large but turbulent melt-pools which deteriorate surfacefinish, by in-creasing the amount of agglomerated spatters particles on the built surfaces (Khairallah et al., 2016).
Finally, such results clearly show that the correlation between sur-face roughness, which depends mostly on sursur-face temperatures achieved on SLM part, and process parameters, is not a simple task, and that the use of VED as a representative factor is not fully satisfactory, when considering a large range of laser spot diameters. This could be attributed to a balance between the density of spatters contaminating SLM surfaces, which tend to increase with smaller scan speeds (at constant beam diameters) and to the global surface smoothing effect with smaller spot-diameters.
4. Influence of hatching process parameters on porosity rate The second part of this study addresses the variation of porosity rate with hatching parameters, with the objective to minimize the void fraction, porosity being one of the microstructural heterogeneity which can initiate a fatigue crack. Various hatching parameters were used (Laser power, scanning velocity and angle of building), while keeping constant contour parameters (P = 140 W, V = 0.5 m/s).
According to previous works (Spierings et al., 2011), different techniques can be used for measuring densities on additive manu-factured metallic parts: Archimedes’ method, microscopic analysis of cross-sections and X-ray scanning, with up to 1% gap at elevated por-osity rate.
Provided that wetting of metallic surfaces in the selected liquid is optimized, the Archimedes method is supposed to deliver more reliable and more global results as the whole sample volume is taken into ac-count instead of some single cross sections. Moreover, this method is very easy to use, fast and cheap. Based on these results, density mea-surements have been carried out with the Archimedes’ double weighing method to measure the density of parts. The basic principle consists of measuring the mass in normal air and in thefluid (water in the current paper). In the present configuration, the measuring accuracy of the Mettler Toledo MS104TS balance is 0.0001 g.
The following equation allows the calculation of the densityρp of the part: = − − + ρ m m m . (ρ ρ) ρ p a a fl fl a a (2)
With ma= mass in the air, mfl mass in the fluid, ρa= air density,
ρfl=fluid density
In the current study, we have investigated the possible link between porosity rate and volume energy density. Eight conditions have been tested including various hatching parameters (Laser power, scan velo-city) (Table 3).
Two building angles (10° and 35°) have also been tested as a pos-sible contributor to densification rate. A “stripe” scanning strategy has been chosen for the building of the different samples, with a constant hatch distance of 140μm. For each specimen, three measurements have been performed. Results are presented inTable 3.
Fig. 8. Effect of beam diameter on the Sa parameter (P = 400 W, contour strategy, 0° angle).
Table 3
Set of SLM Parameters and porosity ratios.
Test θ (°) Contour parameters Hatching parameters VED (hatching) Porosity
P (W) V (m/s) D (μm) P (W) V (m/s) D (μm) J/mm3 (%)
Tests for porosity 7 0 400 1 70 400 1 70 104 0,51 ± 0.05
8 0 400 1.4 70 400 1.4 70 74.3 1,17 ± 0.4 9 0 400 1.8 70 400 1.8 70 57.8 1,85 ± 0.34 10 0 400 2 70 400 2 70 52 2,43 ± 0.9 11 0 400 1 160 400 1 160 19.9 0,36 ± 0.09 12 0 400 1.4 160 400 1.4 160 14.2 0,91 ± 0.12 13 0 400 1.8 160 400 1.8 160 11.1 2,96 ± 0.8 14 0 400 2 160 400 2 160 10 2,7 ± 0.4 15 0 400 1 240 400 1 240 8.8 1,16 ± 0.09 16 0 400 1.4 240 400 1.4 240 6.3 1,30 ± 0.6 17 0 400 1.8 240 400 1.8 240 5,1 5,06 ± 0.2 18 0 400 2 240 400 2 240 4,6 7,20 ± 0.3 19 0 180 0,5 70 175 0,6 70 79,3 1,44 ± 0,4 20 0 140 0,5 70 175 0,6 70 79,3 0,7 ± 0,16 21 0 140 0,5 70 175 0,7 70 68 1,29 ± 0,22 22 10 140 0.5 70 150 0.6 70 68 0.2 ± 0.08 23 10 140 0.5 70 200 0.6 70 90,7 0.37 ± 0.18 24 10 140 0.5 70 175 0.7 70 68 2.1 ± 0.51 25 10 140 0.5 70 175 0.8 70 59,5 6.32 ± 1.26 26 35 140 0.5 70 150 0.6 140 17 0.36 ± 0.04 27 35 140 0.5 70 200 0.6 140 22,6 0.12 ± 0.02 28 35 140 0.5 70 175 0.7 140 17 0.66 ± 0.06 29 35 140 0.5 70 175 0.8 140 14,8 1.61 ± 0.30
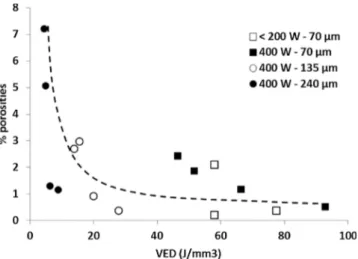
For a constant building angle (0°), the results (Fig. 9) corresponding to specimens 7–21 indicate that the mean porosity rate value globally decreases with VED values (J/mm3) above a VED threshold (≈7 J/ mm3). The main explanation is that high VED promote larger
melt-pools susceptible to better re-melt inter-layer porosities. For 3 different beam diameters, and various (P,V) values a similar evolution is shown with VED. Moreover, for all the (P, V, D) conditions considered, a correct densification (to less than 0.5% porosity rate) is shown above a similar VED threshold (close to 30–40 J/mm3
).
The inclination of parts (from 10 to 35°) has a clear effect on den-sification rates because higher inclinations increase average tempera-tures due to heat concentration in the lower sides of SLM walls (Fig. 10) for specimens 22–29. This explains why, in % porosities versus VED curves the densification starts for 2 times lower VED on 35° inclined parts (Fig. 10).
All these data globally tend to confirm the possibility to use VED as a rather reliable process parameter combining P, V and D, for a constant building angleθ and layer height Δh.
However, the variation of laser beam spatial distribution with z-defocusing may explain why the use of VED is not fully sufficient to predict porosity rate with a good accuracy for a large range of dia-meters (variations of the porosity rates are shown).
Finally, for optimized conditions, a 0.1–0.25% minimum porosity rate is achievable with SLM, to be compared with the values obtained by (Spierings et al., 2011) with SLM on a 316L stainless steel, which are comprised between 0.3 and 0.5%. (Tang et al., 2017) has summarized
different values of porosity rate for different material, which are com-prised between 0.8 and 3%, in order to propose a geometry based si-mulation to predict porosity caused by insufficent overlap of melt pools in powder bed fusion.
An interesting point to notice on cross-sections micrographs (Fig. 11) is the change of size and geometry of pores in the volume and close to the surface. Two different geometries of pores are clearly shown on cross-sections:
- In the sample volume, the geometry of pores is circular and their size is between 10 to 40μm (0.3% of porosity).
- Close to the surface of the specimen, their sphericity decreases and their mean diameter increases up to 150 and 200μm (2.2% of porosity). This last family of porosity can be explained by the overlap between the two strategies, (contour + hatching), or by decelerating-accelerating issues of the scan head near the contour, which favor deeper beads, and possible key-hole closure effects, similar to welding issues (Sames et al., 2016).
(Kasperovich et al., 2016) has done a similar study in a Ti6AlV4 produced by SLM with the effect of more parameters. The scan-strategy used is the zigzag scan vectors. They observed that the velocity exerts the most dominant influential parameter (with porosity between 0,1% at 125 J/mm² and 3,2% at 300 J/mm²) as obtained in our study.
5. Fatigue behavior of as-built and re-polished SLM samples
The aim of this part is to better understand the fatigue mechanisms for parts manufactured by the SLM process. The originality of this study is to compare specimens with skin-process (as built SLM surface) and polished specimen (without skin-process), using a 220 SiC paper re-sulting in a smoothing effect (Sa ≈ 0.8 μm for polished samples com-pared with 7μm for the as-built condition).
5.1. Selection of optimum SLM parameters
Following process investigations carried out in the previous two parts, SLM parameters were chosen for manufacturing fatigue samples, mostly considering the reduction of porosity rate and surface finish which are both expected to be major contributors to fatigue crack in-itiation. For this reason, SLM parameters, corresponding to high VED values (93 J/mm3for the contour and 87 J/mm3for the hatching), and
a low building angle (10°) were used (Table 4).
5.2. Tensile tests
Prior to fatigue tests, two tensile tests were carried out under quasi-static load conditions (10−3s−1) directly on as-built SLM samples with the orientation shown inFig. 2. Results presented here below, are at least as good than previous ALM works on Inconel 625 (Table 1), de-spite the presence of≈0.3% porosity rate (Table 5).
5.3. Fatigue tests
Seven fatigue tests were conducted to determine the number of cycles to failure for as-built and polished specimens, at different stress amplitudes (with a 25 MPa increment). Even if the number of speci-mens is limited, the results and the failure surface obtained give im-portant information and ways of improving SLM materials for fatigue applications.
All tests were carried out at a test frequency of 20 Hz with a load R-ratio equal to−1 using the specimen geometry presented inFig. 3. Specimens that survived 2 × 10⁶cycles have been retested at a higher stress level, increased by 25 MPa, to estimate the fatigue strength and to observe the fatigue damage mechanism on the failure surfaces. The results are summarized inTable 6and plotted as a S-N Wöhler curve
Fig. 9. Dependence of porosity content versus process parameters in In625 for P < 200 W and P = 400 W (10° angle).
Fig. 10. Dependence of porosity content versus process parameters in In625 for two distinct building angles (10° and 35°).
(Fig. 12).
The estimated fatigue limits are between 175 and 200 MPa (i.e. approximately 20% of the UTS). This is much lower than the fatigue strengths obtained with other manufacturing processes (Koutiri et al. 2013). Considering previous“SLM and fatigue” studies on other classes of materials, like an AlSI10Mg (Brandl et al., 2012) with a fatigue limit equal to approximately 30% of the UTS for the same building or-ientation, the fatigue strengths determined here can also be considered to be very low.
The fatigue results clearly indicate an increase in the number of cycles to failure (i.e. an average of approximately +2 × 10⁵cycles for
stress amplitudes of 225, 250 and 275 MPa) for the polished specimens, even if a higher difference could have been expected between the two conditions, due to the difference in surface roughness. However, for the same number of cycles, the difference in stress amplitude, observed between both conditions remains low. Despite the high surface rough-ness of as-built specimen, the difference in the fatigue strength between the polished and the as-built specimens is not pronounced (about 10%).
This low difference can be explained by the similar defect size observed at the initiation sites for the two studied batches. This point is devel-oped in next section.
5.4. Analysis of failure mechanisms on SLM + re-polished specimens
The failure surface of polished specimens has been observed using a Scanning Electron Microscopy (SEM) in order to address the fatigue mechanisms.
Observations of specimens P1, P6 and P4 (Fig. 13) show that the
initiation of the fatigue crack occurs on sub-surface without any defects like inclusions or porosity at the initiation site. For these specimens, initiation is localized in the material matrix and is controlled by local plasticity, according to the less favorably crystal orientation (Dang Van, 1999). (Nicoletto, 2017) has observed the same mechanisms on smooth specimens in a Ti6Al4V obtained by powder bed laser fusion.
Fig. 11. 2D quantification of the voids fraction a) in the cross-section (0.3% of spherical porosities) b) close to the surface (2.2% of porosity) (sample 24: 150 W-0.6 m/s-10°).
Table 4
SLM Process parameters carried out on static tensile and fatigue samples. θ (°) Contour parameters Hatching parameters
P (W) V (m/s) D (μm) P (W) V (m/s) D (μm)
10 180 0.5 70 175 0.6 70
Table 5
Results of tensile tests on as-built SLM samples.
E (GPa) σY(MPa) A (%) UTS (MPa)
Sample 1 177 711 35 976
Sample 2 179 727 35 971
Table 6
Fatigue data, fully reversed tensile loads (R =−1).
Polished specimens As-built specimens
Specimen Name σa(MPa) N (cycles) Specimen Name σa(MPa) N (cycles) Sa (μm)
P1 300 678 663 B1 275 403 887e 8.56 P2 275 662 916p B2 250 573 095p 9.85 P3 250 779 395p B3 225 901 787e 10.69 P4 225 1 641 598 B4 200 2 000 000 5.46 P5 200 1 373 450p B4 225 1 069 045e P6 175 2 000 000 B5 200 2 000 000 4.82 P6 200 1 190 074 B5 225 2 000 000 P7 175 2 000 000 B5 250 35 5349 P7 200 261 270p
pinitiation from a porosity. einitiation from an embedded particle.
Other fatigue initiation mechanisms are observed in samples P2, P3,
P5 and P7 where cracks initiate from pores created during the SLM
process. InFig. 13(sample P3), a 60μm diameter pore is located at 150
microns below the surface. It is believed that the associated porosity (which is not fully spherical) can be correlated to the sub-surface pores shown inFig. 13, and attributed to a key-hole like welding mode or a lack of inter-layer dilution. (Konecna et al., 2016) observed the same mechanism in an Inconel 718 on smooth specimens.
It is therefore concluded that fatigue damage in this material is controlled by two different fatigue mechanisms: one is associated with relatively large pores and the other is controlled by local plasticity within the material matrix.
5.5. Failure mechanisms of as-built SLM specimens
In order to characterize the fatigue mechanisms on specimens car-ried out with a skin (“contour”) process, failure surfaces have also been observed on as-built SLM samples to explain the difference obtained with polished specimens.
The initiation site in specimen B2is at a large pore in which some
un-melted particle powder can be observed (seeFig. 14). This initiation mechanism is the same as that observed for the polished specimens P2,
P3, P5and P7. For the specimen B5which has a particular high fatigue
strength there are no pores observed at the initiation site, as per the polished specimens P1, P4and P6.
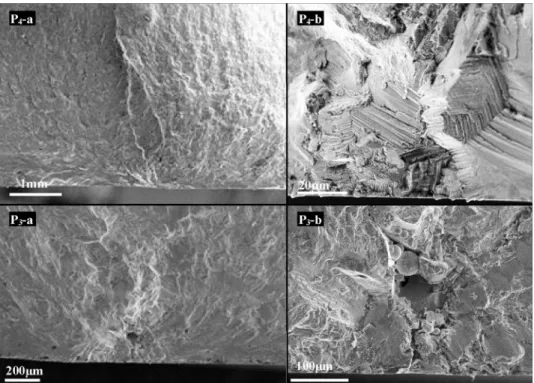
The observations show that for specimens B1, B3, and B4a similar
crack initiation mode occurs, controlled by the presence of large em-bedded particles, and localized on the surface of the specimen (Fig. 15
for specimen B1 andFig. 16for specimen B3). These particles have a diameter of about 150μm which seems large compare to the grain size distribution (Fig. 1). Spatter ejection, generated during the powder bed laser beam melting process, discussed in recent papers (Wang et al., 2017,Gunenthiram et al., 2018) could explain the origin of this kind of defect.
Specimen B1shows an unusual failure surface, in which a
compe-tition between two different heterogeneities can be observed (Fig. 15B1
-b) and B1-c)). This promotes the formation of two fatigue crack
initia-tion sites (one at a sub-surface pore and the other at a 150μm em-bedded particle).
The specimen B3was analyzed in greater detail prior to and after
fatigue testing. Prior to fatigue tests, a 3D surface scan was carried out to detect and visualize the position and the size of embedded particles. It can be seen inFig. 15B3-C that approximately twenty particles are
present on the specimen surface. The critical defect can be identified on
Fig. 13. SEM images of fracture surfaces showing the crack initiation location for the polished samples.
Fig. 14. SEM images of fracture surfaces showing the crack initiation location for the as-Built specimen B1.
the surface scan using the fracture surface analysis.Fig. 15shows the surface scan and a close-up of the critical defect of the as-built specimen B3.
On the failure surface, it can be observed that the interface between the particle and the material matrix is not completely smooth. A par-tially embedded particle seems to create an initial defect which could be very critical in fatigue. It can be observed in Fig. 16that the 3D profilometer can be used to detect this kind of heterogeneity, as shown inFig. 14B3-c/d.
Finally, three different fatigue damage mechanisms are observed. The most damaging is probably due to particle ejected during the SLM process and embedded on the surface. The second one is controlled by the degree of porosity, created during the process close to the surface. The third and least damaging fatigue crack initiation mechanism ob-served is crack initiation due to local plasticity which appears in the material matrix.
These observations tend to show that the usual roughness para-meters like Sa or St, which gives a more global description of the
surface are probably not suitable to characterize the surface effect on fatigue. It seems to be more efficient to quantify and optimize the particle population in term of density, size or geometry in order to better assess the fatigue strength of a SLM material. New surface parameters must also be developed to propose a link between the sur-face state and the fatigue strength of this type of material.
6. Conclusion and future work
The SLM manufacturing of Inconel 625 samples has been carried out with a double objective: (1) determining optimum process parameters leading to reduced surfacefinish and porosity rate and understanding underlying physics, and (2) investigating the fatigue behavior and failure mechanisms on as-built and (as-built + re-polished) samples.
Thefirst part was focused on parameters to deliver the best surface finish. It appears that the correlation between surface roughness, which depends mostly on surface temperatures achieved on SLM part, and process parameters, is not a simple task, and that the use of VED as a
surfaces showing the crack initiation location for the as-Built specimen B1.
Fig. 16. B3-a and B3-b: SEM images of fracture surfaces showing the crack initiation located at a surface particle; B3-c and B3-d: Surface scan at different scale of the as-built specimen showing the critical particle at the origin of the failure initiation.
representative factor is not fully satisfactory, especially when con-sidering a large range of laser spot diameters. Globally, Sa was shown to increase with lower scan speeds, to decrease with higher powers, and to increase severely on down-skin sides for large building angles.
In a second part, hatching parameters have been optimized to reach an optimum densification state. For a constant building angle (10°), the porosity rate globally decreases with VED values (J/mm3) above a VED
threshold. Logically, high enough VED promote large melt-pools sus-ceptible to better re-melt inter-layer porosities. The inclination of parts (from 10 to 35°) also has a clear effect on densification rates because higher inclinations increase average temperatures due to heat con-centration in the lower sides of SLM walls. Contrary to the surface roughness, the possibility to use VED as a rather reliable process parameter combining P, V and D, for a constant building angleθ and layer heightΔh is confirmed.
Finally, this process optimization was found to be a compromise between an optimum densification state and a minimum number of contaminating spatters which degrade the surface roughness.
An experimental fatigue campaign has been conducted on as-built specimens and polished specimens. Despite the poor surface roughness of as-built specimen, the polished and the as-built fatigue batches ex-hibit similar fatigue strength. This can be explained by the defects as-sociated with crack initiation sites which are similar in size for the studied specimens.
Three different fatigue damage mechanisms have been observed and described:
- Particles probably ejected during the SLM process, which stick to and become embedded on the surface.
- Porosity created during the SLM process, located on the surface or sub-surface of the material.
- Local plasticity which appears in the matrix material, depending on material microstructure.
This study provides an initial step for future modeling work to de-scribe the fatigue behavior of as-built SLM specimens. For instance, in the future, a probabilistic approach using the weakest link concept (Pessard et al., 2011) could be introduced to model the competition between the three damage mode that have been observed.
Acknowledgement
This work was carried out under the framework of the PSPC project FAIR. Authors thank BPI forfinancial support.
References
Akita, M., Uematsu, Y., Kakiuchi, T., Nakajima, M., 2016. Defect-dominated fatigue be-havior in type 630 stainless steel fabricated by selective laser melting. Mater. Sci.
Eng. A 666, 19–26.
Brandl, E., Heckenberg, U., Holzinger, V., Buchbinder, D., 2012. Additive manufactured AlSi10Mg samples using selective laser melting (SLM): microstructure, high cycle fatigue and fracture behavior. Mater. Des. 34, 159–169.
Chastanda, V., Tezenasa, A., Cadoreta, Y., Quaegebeurb, P., Wilson, M., Charkaluk, E., 2016. Fatigue characterisation of titanium Ti-6Al-4V samples produced by additive manufacturing. Procedia Struct. Integrity 2, 3168–3176.
Dang Van, K., 1999. Introduction to fatigue analysis in mechanical design by the multi-scale. High Cycle Metal Fatigue CISM Courses and Lectures. SpringerWienNewYork.
Ellyson, B., Brochu, M., Brochu, M., 2017. Characterisation of bendig vibration fatigue of SLM fabricated Ti6Al4V. Int. J. Fatigue 99, 25–34.
Fabbro, R., Dal, M., Peyre, P., Coste, F., Schneider, M., Gunenthiram, V., 2017. Analysis and possible estimation of keyhole depths evolution using laser operating parameters and materials properties. Proceedings of ICALEO2017.
Fatemi, A., Molaei, R., Sharifimehr, S., Shamsaei, N., Phan, N., 2017. Torsional fatigue behavior of wrought and additive manufactured Ti6Al4V by powder bed fusion in-cluding surfacefinish effect. Int. J. Fatigue 99, 187–201.
Gunenthiram, V., Peyre, P., Schneider, M., Dal, M., Coste, F., Koutiri, I., Fabbro, R., 2018. Experimental analysis of spatter generation and melt-pool behavior during the powder bed laser beam melting process. J. Mater. Process. Technol. 376–386.
Kasperovich, G., Haubrich, J., Gussone, J., Requena, G., 2016. Correlation between porosity and processing parameters in TiAl6V4 produced by selective laser melting. Mater. Des. 160–170.
Khairallah, S.A., Anderson, A.T., Rubrnvich, A., King, W.E., 2016. Laser powder bed fu-sion aditive manufacturing : physics of complex meltflow and formation mechanisms of pores, spatter and denudation zones. Acta Mater. 108, 36–45.
Konecna, R., Nicoletto, G., Kunz, L., Baca, A., 2016. Microstructure and directional fa-tigue behavior of Inconel 718 produced by selective laser melting. Procedia Struct. Integrity 2, 2381–2388.
Koutiri, I., Bellett, D., Morel, F., Pessard, E., 2013. A probabilistic model for the high cycle fatigue behaviour of cast aluminium alloys subject to complex loads. Int. J. Fatigue 47, 137–147.
Leary, M., 2017. Surface roughness optimisation for selective laser melting (SLM): ac-commodating relevant and irrelevant surfaces. Laser Addditve Manufacturing. pp. 99–118.
Nicoletto, G., 2017. Anisotropic high cycle fatigue behavior of Ti-6Al-4V obtained by powder bed laser fusion. Int. J. Fatigue 94.
Pessard, E., Morel, F., Morel, A., Bellett, D., 2011. Modelling the role of non metallic inclusions on the anisotropic fatigue behaviour of forged steel. Int. J. Fatigue 33, 568–577.
Sames, J., List, F.A., Pannala, S., Dehoff, R.R., Babu, S.S., 2016. The metallurgy and processing science of metal additive manufacturing. International Materials Review.
Siddique, S., Imran, M., Walther, F., 2017. Very high cycle fatigue and fatigue crack propagation behavior of selective laser melted AlSi12 alloy. Int. J. Fatigue 94, 246–254.
Spierings, A.B., Schneider, M., Eggenberger, R., 2011. Comparison of density measure-ment techniques for additive manufactured metallic parts. Rapid Prototyp. J. 380–386.
Tang, M., Chris Pistorius, P., Beuth, J.L., 2017. Prediction of lack-of fusion porosity for powder bed fusion. Addit. Manuf. 14, 39–48.
Triantaphyllou, A., Giusca, C.L., Macaulay, G.D., Roering, F., Hoebel, M., Leach, R.K., Tomkta, B., Milne, K.A., 2015. Surface texture measurement for additive manu-facturing. Surf. Topogr. Metrol. Prop. 3, 1–8.
Wang, D., Wu, S., Fu, F., Mai, S., Yang, Y., Liu, Y., Song, C., 2017. Mechanisms and characteristics of spatter generation in SLM processing and its effect on the proper-ties. Mater. Des. 121–130.
Wang, P., Zhang, B., Cheh Tan, C., Raghavan, S., Lim, Y.-F., Sun, C.-N., Wei, J., Chi, D., 2016. Microstructural characteristics and mechanical properties of carbon nanotube reinforced inconel 625 parts fabricated by SLM. Mater. Des. 112, 290–299.
Yadroitsev, I., Thivillon, L., Ph, Bertrand, Smurov, I., 2007. Strategy of manufacturing components with designed internal structure by selective laser melting of metallic powder. Appl. Surf. Sci. 254, 980–983.