HAL Id: hal-02333013
https://hal.inria.fr/hal-02333013
Submitted on 25 Oct 2019
HAL is a multi-disciplinary open access
archive for the deposit and dissemination of
sci-entific research documents, whether they are
pub-lished or not. The documents may come from
teaching and research institutions in France or
abroad, or from public or private research centers.
L’archive ouverte pluridisciplinaire HAL, est
destinée au dépôt et à la diffusion de documents
scientifiques de niveau recherche, publiés ou non,
émanant des établissements d’enseignement et de
recherche français ou étrangers, des laboratoires
publics ou privés.
Deep learning for inter-observer congruency prediction
Alexandre Bruckert, Yat Hong Lam, Marc Christie, Olivier Le Meur
To cite this version:
Alexandre Bruckert, Yat Hong Lam, Marc Christie, Olivier Le Meur. Deep learning for inter-observer
congruency prediction. ICIP 2019 - IEEE International Conference on Image Processing, Sep 2019,
Taipei, Taiwan. pp.3766-3770, �10.1109/ICIP.2019.8803596�. �hal-02333013�
DEEP LEARNING FOR INTER-OBSERVER CONGRUENCY PREDICTION
Alexandre BRUCKERT*, Yat Hong LAM*
†, Marc CHRISTIE, Olivier LE MEUR
Univ Rennes, IRISA, CNRS, France
†
Nokia Technologies, Tampere, Finland
ABSTRACT
According to the literature regarding visual saliency, observers may exhibit considerable variations in their gaze behaviors. These vari-ations are influenced by aspects such as cultural background, age or prior experiences, but also by features in the observed images. The dispersion between the gaze of different observers looking at the same image is commonly referred as inter-observer congruency (IOC). Predicting this congruence can be of great interest when it comes to study the visual perception of an image. In this paper, we introduce a new method based on deep learning techniques to predict the IOC of an image. This is achieved by first extracting features from an image through a deep convolutional network. We then show that using such features to train a model with a shallow network regression technique significantly improves the precision of the prediction over existing approaches.
Index Terms— visual dispersion, gaze patterns, prediction, deep features
1. INTRODUCTION
The prediction of human gaze patterns and viewing behaviors has been a hot topic in the computer vision community these past years. Numerous models have been proposed, either for automatically iden-tifying salient regions in an image or a video, or for studying the impact of different factors on gaze patterns. Usually, such factors are classified into two categories: stimulus-dependent (bottom-up) and observer-dependent (top-down). For instance, the age of the ob-server is a crucial top-down factor as shown by Le Meur et al. [1] since extreme discrepancies appear between the gaze patterns of children and adults. Cultural differences [2, 3] could also be an im-portant factor, even if discussed by Rayner et al. [4]. On the con-trary, bottom-up factors are only linked to the implicit properties of the stimuli, such as presence of faces in the image. Such features are so influential that, for example, Cerf et al. incorporated specific face detection techniques in their model [5].
In this work, we focus on a phenomenon that contributes to the study of human gaze patterns and visual saliency, called inter-observer congruency (IOC). IOC is a characterization of the disper-sion of gazes between different users observing the same image and is measured using an IOC score (lower scores representing a higher dispersion). While IOC scores are easy to measure using gaze track-ing, very few contributions address the problem of predicting the IOC score, despite its interest when it comes to explain in which conditions humans tend to have similar gaze behaviors or not.
Two main prior efforts have examined the influence of bottom-up and top-down features on the IOC score prediction problem. In Le Meur et al. [6], a regression-based learning approach is used to
* Equal Contributions
predict those scores from features such as color harmony measur-ing the dispersion in saturation within the image, a face detector described in Viola and Jones [7], the depth of field and the scene complexity. In Rahman and Bruce [8], a similar regression model is trained, using both simple diagnostic features and more complex bottom-up and top-down features. Among the diagnostic features, we can note the entropy over the image, the visual clutter as de-scribed in Rosenholtz et al. [9] and the JPEG image size, indicating the compression level. Bottom-up and top-down features from sev-eral popular saliency models are also used, such as the representation of the holistic scene envelope described in Oliva and Torralba [10], the histogram of oriented gradients (HoG) [11], but also deep top-down features extracted from the BVLC Reference CaffeNet archi-tecture [12]. Finally, the features from 12 different saliency algo-rithms are combined using an histogram-based algorithm to create a feature set called Histogram of Predicted Salience (HoPS) features.
In this study, we present a new way to automatically predict IOC scores, solely based on deep bottom-up features, extracted by a pre-trained convolutional neural network. The results of this work show that such a model can outperform other approaches that take into account observer-dependant features, and gives a reasonably good approximation of the IOC only based on the stimulus.
The paper is composed as follows. Section 2 introduces the inter-observer congruency score and the way it is measured. Sec-tion 3 describes the architecture of the proposed model as well as the training conditions and the databases that were used. Section 4 presents the performances, and confronts the model to previous work. Finally, in Section 5, we discuss the implications of our re-sults and the benefit they may have on future work.
2. INTER-OBSERVER CONGRUENCY 2.1. Method for computing IOC from eye data
Inter-observer congruency, or the visual dispersion between ob-servers, can be measured thanks to eye tracking techniques. An image is displayed onscreen while eye movements of an observer are recorded. If we assume that an image is seen by Noobservers,
and that the scanpath for any i ∈ Nois of length LN, a
leave-one-out approach [13] can be used to compute the IOC scores of the image. The first step consists in convolving the raw fixation maps of (No− 1) observers with a 2-D Gaussian kernel. The σ for the
Gaus-sian is set to one degree, which roughly estimates the fovea size. The convolution step provides a 2-D distribution map in which each pixel represents the probability for a fixation to be here. We then use two well known saliency measures, comparing each individual to the rest of the observers, to get the IOC scores, namely area under curve (AUC) and normalized scanpath saliency [14] (NSS). Since the different approaches of AUC (Judd’s approach [15] and Borji’s approach [16]) are highly correlated, we will only focus on one of
them, AUC-Borji (AUCB).
In this paper, we compute the IOC scores for two well-known datasets, i.e. Judd/MIT dataset [17] and CAT2000 dataset [18]. The former dataset includes 1000 images with different resolutions and contents. The CAT2000 includes 2000 images, split into 20 different categories. One key difference between these datasets is the viewing duration, 3s for Judd/MIT and 5s for CAT 2000. Considering that the time given to the observers to look at the images is different, we set an arbitrary threshold to limit the number of fixations per scanpath. Short scanpaths (number of fixations below the threshold) are removed. In addition, any fixation points above that threshold are also discarded. We also define a fixed number of observers No
to compute the IOC: if an image has less than Novalid observers (i.e.
with scanpath lengths long enough), this image will be left out. If an image has n > Noobservers, we randomly sample Noobservers
among those and compute the IOC based on those Noindividuals.
This sampling is done several times for the sake of robustness and relevance; the number of random samplings is a fixed parameter of the model. The IOC scores per observer are then averaged to give the final IOC.
2.2. Results on CAT2000 and Judd/MIT
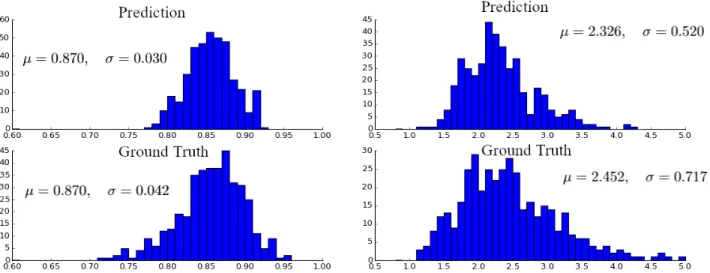
Using the AUCB metric, the final IOC score is between 0 (i.e. very low congruency) and 1 (i.e. very high congruency). For the NSS, there is no upper bound, scores can span between 0 (i.e. very low congruency) and +∞ (i.e. very high congruency). Figure 1 illus-trates images from CAT2000 database for which we observe a very low and very high inter-observer congruency. Figure 3 illustrates the IOC distributions computed by using AUCB and NSS metrics. The AUCB scores are usually within the range 0.75 − 0.95. The NSS scores are usually within 1.5 − 4.5. Since the Judd/MIT database only consits in natural images, the range of both AUCB and NSS scores is a bit shorter (typically between 0.85 - 0.95). NSS scores also usually span within the range 2.5 - 4.5.
Intuitively, there are many ”simple” factors that can easily ex-plain a low or a high IOC score. For instance, if an image has no salient regions, it is quite straightforward to assume that the IOC will be low, since no particular detail should catch the attention of a free-viewing observer. The opposite might also be true: an image with many salient regions could also produce a low IOC score if the viewing time is not long enough. We can observe that phenomenon when looking at the images of the dataset when ranked with their IOC score. On the other hand, high IOC scores can often be qual-itatively explained by the presence of faces, written characters, or isolated objects, that tend to attract the gaze.
3. DEEP-LEARNING FOR IOC SCORE PREDICTION In this paper we propose to rely on a learning approach to predict the inter-observer congruency score of an image. We exploit the IOC scores computed the CAT2000 and Judd/MIT databases to train a network in a two-staged approach: first (i) by designing an encoder based on VGG19 [19] to extract deep features, and second (ii) by designing a straightforward shallow network as a decoder to perform the regression.
3.1. A two-staged model architecture
The lack of images labeled with eye tracking data makes the cre-ation of a reliable and robust model challenging. This is why we used
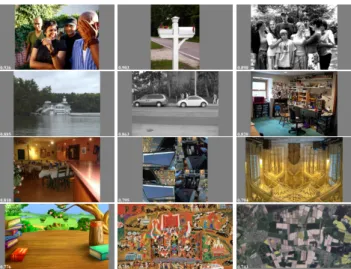
Fig. 1. Examples of pictures from the CAT2000 database sorted based on their IOC scores (top-left: highest congruency, bottom-right: lowest congruency).
Fig. 2. Architecture of the proposed CNN. The upper part is the encoder based on VGG19, the lower part is the shallow decoder (for NSS prediction, we remove the two first max-pooling layers).
transfer learning, using the pre-trained weights from a feature extrac-tor architecture. Moreover, the shallow regression network seemed a good compromise between that lack of data, that precludes any kind of learning that uses too many parameters, and the capacities of a method that is more complex and efficient than simple linear regression.
The overall architecture is presented in Figure 2. The model first uses VGG19 network [19] for extracting a set of deep features. We chose that architecture for its excellent performances in the field of visual attention, especially through popular models such as DeepGazeII [20] and MLNET [21]. VGG-based networks are well-known for their very good generalization properties, as well as their simplicity. The particularity of that structure is the use of multiple convolution layers with small kernel size (3 × 3). The layer stacking is then more discriminative due the multiple non-linear rec-tification layers. It also decreases the number of parameters, hence easing the training process. We used two different versions of that encoder, one for AUCB-based IOC score, and one for NSS-based NSS score. The first is the full VGG19 feature extractor, containing
Datasets Judd CAT Memo. Bruce Methods MIT 2000 [23] [24] SVM 0.101 0.124 – – Random Forest -0.162 -0.088 – – Perceptron 0.073 0.139 – – Le Meur [6] 0.340 – – – Bruce [8] 0.456 – 0.519 0.506 Proposed 0.611 0.642 0.537 0.473 Table 1. Pearson correlation coefficient between predicted IOC scores and ground truth IOC for several models and databases.
5 max-pooling layers. In that case, the output of the encoder is a tensor of size [37 × 50 × 1472]. For the NSS score, we observed better performances when removing two of the five max-pooling layers, leaving the output dimensions as [37 × 50 × 1280].
We then design a simple shallow network as a decoder to per-form the regression task. After the input, a dropout layer is applied, followed by three convolution layers with [3 × 3] kernel sizes, re-ducing the number of features maps to 320, 64 and 1. Batch nor-malization is used to normalize the output, followed by a flattening layer, a second dropout and three fully connected layers, reducing the dimension from 1850 to 1024, 256 and 1. The final output is the predicted score of IOC. Best performances were achieved for AUCB by setting the dropout rate at 0.5, using sigmoid activation functions within the dense layers, and binary categorical entropy as a loss function. For NSS, the dropout rate is set as 0.2, with ReLU activation functions and mean squared error as a loss function. 3.2. Training database
To train our model and evaluate IOC prediction, we used the IOC scores (based on AUCB and NSS) computed over the Judd/MIT database [17] and the CAT2000 database [18], as described in Sec-tion 2.
The Judd/MIT database includes 1000 images with different res-olutions, 500 of them being used for training, 200 for validation along the training process, and 300 have been held out to evaluate the performances. For the CAT2000 we use 1200 images for the training process, 400 for the validation and 400 for the test. This database is also split into 20 different categories of images, which allows to compare the precision of the prediction in each category.
Since the Judd/MIT database only contains 500 training images, we performed a first training merging the two databases together. We also performed data augmentation by flipping the images hori-zontally, making the assumption that such a transformation should not disturb the IOC score. The images are then rescaled into [400 × 300 × 3] images. We used the pre-trained ImageNet weights [22] for the encoder network and froze those layers during the training. A fine-tuning phase has also been performed, during which we froze the first convolution layer of the decoder network.
4. RESULTS 4.1. Comparison with standard approaches
We first tested simple regression models (SVM regression, simple random forests, simple multi-layers perceptrons, correlation be-tween IOC and the entropy of predicted saliency maps) to ensure there was no easy way to deal with that problem, and that the rel-atively complex method in terms of parameters (around 6 million)
was justified. We performed a quantitative analysis, using the testing holdouts of the two databases on which the network was trained. We predicted the IOC scores and computed the Pearson correlation coefficient between those predictions and the IOC ground truth. Results are shown in Table 1. Correlation coefficients for the 3 aforementioned methods is extremely low.
4.2. Performances of the proposed method
The distribution of prediction result of AUCB and NSS IOC scores are shown in Figure 3. For the AUCB prediction, the prediction mean is exactly the same as the ground truth mean, but its standard deviation is smaller. There is a tendency that the prediction value is closer to the mean, meaning that the prediction of outliers is more difficult. Similar effects can also be noticed with NSS score. When the global prediction mean is slightly smaller than that of the ground truth, the spreading of prediction NSS is significantly smaller than that of the ground truth. We also observe that when the ground truth AUCB distribution is almost symmetric along the mean value, the ground truth NSS is more right-skewed and has a long tail at high NSS values. It may explain the poorer performance in NSS predic-tion. This is most probably due to the regularization and dropout we used in the decoder network, in order to prevent overfitting issues. The range of the predictions, for both scores, are also smaller than the ground truth, which is due to the capacity of the model to gener-alize properties and to perform really well when averaged over a few images.
Overall, Table 1 indicates that the correlation coefficient be-tween ground truth and prediction is 0.611 and 0.642 on Judd/MIT and CAT2000 databases, respectively. On Judd/MIT database, the proposed method significantly outperforms Le Meur [6] and Bruce [8] methods.
We also applied our model on two other databases, namely the Memorability [23] and Bruce’s database [24]. Compared to Bruce method [8], the proposed model is better on Memorability database while Bruce method provides the best results on Bruce database. Note that the proposed method has not been trained over neither Memorability nor Bruce database. Both results suggest that the pro-posed method has good generalizing properties.
To confirm these deductions, we performed a study of the IOC per image catagory based on the CAT2000 database. The mean ground truth IOC scores we computed consolidated our original in-tuitions about what kind of images should have a higher (or lower) IOC score. For example, the category getting the lowest IOC score is composed of satellite images, in which it is hard to distinguish specific objects. On the opposite, the highest IOC scores are per-formed by sketch drawings, that offer very specific locations to look at, a very high contrast between the drawing and the background, and display familiar objects. It also appears that the predicted mean IOC scores are really close to the ground truth (r = 0.953, pval<<
10−5for AUCB, r = 0.845, pval << 10−5for NSS). IOC
val-ues are therefore partly correlated with the high level information of the scene (categories), and partly on the low level information in each individual image. When the effect of individual features is lowered due to the averaging, the categorical visual information be-comes more important and leads to an improvement in correlation. This reflects that our model has a capacity to partially understand high-level features common in each category.
Fig. 3. Distribution of the IOC scores for (left) AUCB and (right) NSS over CAT2000 database.
Fig. 4. Mean AUCB-based IOC scores for each categories of CAT2000.
5. CONCLUSION
In this paper, we introduced a new model to predict an estimation of the visual congruence between observers. We showed that we can improve substantially the performances for such a task solely based on deep bottom-up features, provided that the right regression model is used. For that regression model, we proposed a shallow convolutional network, that performed better than previous models.
The information given by the IOC can also easily be used, at least as a sanity check to compare a predicted saliency map to its ground truth. IOC scores can also be of great use for image recom-mendation systems, as it gives an information on the possibility that an observer will focus on the same areas as another observers. It could also be very useful for outliers management in any visual at-tention problem: if a viewer exhibits very different gaze patterns that the others on images with high IOC, it could be easier to leave him out of the survey, or to note significant differences in top-down fea-tures. Finally, IOC can intuitively be linked to many other properties, such as the memorability, or the response time in task-dependant viewing. We plan to expand those questions to dynamic models, where IOC is of even greater interest, for advertisement or film
mak-ing.
6. REFERENCES
[1] Le Meur O., Coutrot A., Liu Z., R¨am¨a P., Le Roch A., and Helo A., “Visual attention saccadic models learn to emulate gaze patterns from childhood to adulthood,” in Proceedings of the IEEE, 2017, vol. 26.
[2] Chua H., Boland J., and Nisbett R., “Cultural variation in eye movements during scene perception,” in Proceedings of the National Academy of Sciences, 2005, vol. 102.
[3] Nisbett R., “The geography of thought: how asians and west-erners think differently... and why,” New York : Free Press, 2003.
[4] Rayner K., Catelhano M., and Yang J., “Eye movements when looking at unusual-weird scenes: are there cultural differ-ences?,” Journal of Experimental psychology: learning, mem-ory and cognition, vol. 35(1), 2009.
[5] Cerf M., Harel J., Einh¨auser W., and Koch C., “Predicting hu-man gaze using low-level saliency combined with face detec-tion,” in Advances in Neural Information Processing Systems, 2007, vol. 20.
[6] Le Meur O., Baccino T., and Roumy A., “Prediction of the inter-observer visual congruency (iovc) and application to im-age ranking,” in Proceedings of the 19th ACM international conference on Multimedia, 2011.
[7] Viola P. and Jones M., “Rapid object detection using a boosted cascade of simple features,” in CVPR, 2001.
[8] Rahman S. and Bruce N.D.B., “Factors underlying inter-observer agreement in gaze patterns : Predictive modelling and analysis,” in Proceedings of the Ninth Biennial ACM Sympo-sium on Eye Tracking Research and Applications, 2016. [9] Rozenholtz R., Li Y., and Nakano L., “Measuring visual
clut-ter,” Journal of vision, vol. 7(2), 2007.
[10] Oliva A. and Torralba A., “Modeling the shape of the scene: A holistic representation of the spatial envelope,” International Journal of Computer Vision, vol. 42(3), 2001.
[11] Felzenszwalb P.F., Girshick R.B., McAllester D., and Ramanan D., “Object detection with discriminatively trained part-based models,” in IEEE Transactions on Pattern Analysis and Ma-chine Intelligence, 2010, vol. 32(9).
[12] Jia Y., Shelhamer E., Donahue J., Kaarayev S., Long J., Gir-shick R., Guadarrama S., and Darrell T., “Caffe: Convolutional architecture for fast feature embedding,” in Proceedings of the 22nd ACM international conference on Multimedia, 2014. [13] Torralba A., Oliva A., Castelhano M.S., and Henderson J.M.,
“Contextual guidance of eye movements and attention in real-world scenes: The role of global features in object search,” Psychological Review, vol. 113(4), 2006.
[14] Peters R.J., Iyer A., Itti L., and Koch C., “Components of bottom-up gaze allocation in natural images,” Vision Research, vol. 45(18), 2005.
[15] Tilke Judd, Fr´edo Durand, and Antonio Torralba, “A bench-mark of computational models of saliency to predict human fixations,” in MIT Technical Report, 2012.
[16] Borji A., Tavakoli H.R., Sihite D.N., and Itti L., “Analysis of scores, datasets, and models in visual saliency prediction,” in IEEE International Conference on Computer Vision, 2013. [17] Judd T., Ehinger K., Durand F., and Torralba A., “Learning to
predict where humans look,” in IEEE International Conference on Computer Vision (ICCV), 2009.
[18] A. Borji and L. Itti, “Cat2000: A large scale fixation dataset for boosting saliency research,” CVPR 2015 workshop on Future of Datasets, 2015, arXiv preprint arXiv:1505.03581.
[19] Simonyan K. and Zisserman A., “Very deep convolutional networks for large-scale image recognition,” CoRR, vol. abs/1409.1556, 2014.
[20] Matthias K¨ummerer, Thomas SA Wallis, and Matthias Bethge, “Deepgaze ii: Reading fixations from deep features trained on object recognition,” arXiv preprint arXiv:1610.01563, 2016. [21] Cornia M., Baraldi LL., Serra G., and Cucchiara R., “A deep
multi-level network for saliency prediction,” in International Conference on Pattern Recognition (ICPR), 2016.
[22] Russakovsky O., Deng J., Su H., Krause J., Satheesh S., Ma S., Huang Z., Karpathy A., Khosla A., Bernstein M., Berg A.C., and Fei-Fei L., “Imagenet large scale visual recognition chal-lenge,” International Journal of Computer Vision (IJCV), vol. 115, no. 3, 2015.
[23] Mancas M. and Le Meur O., “Memorability of natural scenes: The role of attention,” 2013 IEEE International Conference on Image Processing, 2013.
[24] Bruce N.D.B. and Tsotsos J.K., “Saliency, attention and visual search: an information theoretic approach,” Journal of vision, vol. 9(3), 2009.