Série Scientifique
Scientific Series
95s-48 Is Workers' Compensation Disguised Unemployment Insurance?Bernard Fortin, Paul Lanoie, Christine Laporte
Montréal novembre 1995
Ce document est publié dans l’intention de rendre accessibles les résultats préliminaires de la recherche effectuée au CIRANO, afin de susciter des échanges et des suggestions. Les idées et les opinions émises sont sous l’unique responsabilité des auteurs, et ne représentent pas nécessairement les positions du CIRANO ou de ses partenaires.
This paper presents preliminary research carried out at CIRANO and aims to encourage discussion and comment. The observations and viewpoints expressed are the sole responsibility of the authors. They do not necessarily represent positions of CIRANO or its partners.
CIRANO
Le CIRANO est une corporation privée à but non lucratif constituée en vertu de la Loi des compagnies du Québec. Le financement de son infrastructure et de ses activités de recherche provient des cotisations de ses organisations-membres, d’une subvention d’infrastructure du ministère de l’Industrie, du Commerce, de la Science et de la Technologie, de même que des subventions et mandats obtenus par ses équipes de recherche. La Série Scientifique est la réalisation d’une des missions que s’est données le CIRANO, soit de développer l’analyse scientifique des organisations et des comportements stratégiques.
CIRANO is a private non-profit organization incorporated under the Québec Companies Act. Its infrastructure and research activities are funded through fees paid by member organizations, an infrastructure grant from the Ministère de l’Industrie, du Commerce, de la Science et de la Technologie, and grants and research mandates obtained by its research teams. The Scientific Series fulfils one of the missions of CIRANO: to develop the scientific analysis of organizations and strategic behaviour.
Les organisations-partenaires / The Partner Organizations
•Ministère de l’Industrie, du Commerce, de la Science et de la Technologie. •École des Hautes Études Commerciales.
•École Polytechnique. •Université de Montréal. •Université Laval. •McGill University.
•Université du Québec à Montréal. •Bell Québec.
•La Caisse de dépôt et de placement du Québec. •Hydro-Québec.
•Fédération des caisses populaires de Montréal et de l’Ouest-du-Québec. •Téléglobe Canada.
•Société d’électrolyse et de chimie Alcan Ltée. •Avenor.
•Service de développement économique de la ville de Montréal. •Raymond, Chabot, Martin, Paré
Financial support from the Institut de recherche en santé et sécurété du travail (IRSST) is gratefully %
acknowledged. We thank John Cockburn, Georges Dionne, Jean-Yves Duclos, Pierre Fortin, François Gardes, Denis Guindon, Christian Gouriéroux, Jonathan Gruber, David Prescott and two anonymous referees for very useful comments on an earlier version. We also benefited from the excellent research assistance of Claude Bilodeau, France Labrecque and Mark Thomas. Finally, we are grateful to the members of the Groupe interdisciplinaire de recherche sur l'organisation, la santé et la sécurité du travail (GIROSST) of Université Laval for providing us with the data and their helpful advice. Any remaining errors are our own.
Respectively professor and research associate, Département d'économique and CRÉFA, Université †
Laval, Canada, G1K 7P4. E-mail : [email protected]
Professor, École des Hautes Études Commerciales Commerciales, Montréal, Canada, H3T 1V6. ‡
Is Workers' Compensation Disguised Unemployment
Insurance?
%%Bernard Fortin , Paul Lanoie , Christine Laporte† ‡ †
Résumé / Abstract
Ce texte examine comment l'assurance contre les lésions professionnelles (ALP) et l'assurance-chômage (AC) interagissent pour influencer la durée des réclamations pour lésions professionnelles. Nous utilisons des micro-données administratives longitudinales couvrant plus de 30 000 travailleurs du secteur de la construction pour la période 1976-1986. Nos résultats montrent qu'une réduction du taux de remplacement salarial de l'assurance-chômage est associée à une augmentation de la durée des accidents majeurs difficiles à diagnostiquer (cette catégorie inclut les maux de dos majeurs). De plus, un accroissement du taux de remplacement salarial de l'ALP entraîne un accroissement de la durée des accidents mineurs difficiles à diagnostiquer (cette catégorie inclut les lombalgies). Enfin, il semble y avoir un effet saisonnier lié à la durée des périodes d'indemnisation est plus élevée de 21.2% lorsqu'un accident survient en décembre plutôt qu'en juillet.
This paper examines how yhe Workers' Compensation (WC) and the Unemployment Insurance (UI) programs interact to influence the duration of claims due to workplace accidents. We use longitudinal WC administrative micro-data on more than 30,000 workers in the Quebec construction industry for the period 1976-1986. Our results show that a reduction in the UI wage replacement ratio is associated with an increase in the duration of claims due to serve accidents that are difficult to diagnose (this category includes severe back-related problems). Also, an increase in the WC replacement ratio leads to an increase in the average duration of claims due to minor accidents that are difficult to diagnose (this category includes minor low-back injuries). Moreover, there seems to be an important seasonal effect in the duration of claims; i.e., the average duration of spells on WC is estimated to be 21.2% higher when an accident occurs in December rather than in July.
Mots-clés : durée, accidents du travail, lésions professionnelles, assurance-chômage, construction, hazard
Keywords : duration, worplace accidents, construction, worker's compensation, unemployment insurance,
1. Introduction
The social cost of workplace accidents is large. In a typical year in the United States, from one-third to one-half as many working days are lost to work injuries as are lost to unemployment (see Krueger 1988). Recently, economists have paid more attention to the economic issues involved in occupational safety and health (see Lanoie, 1994, for a survey). In particular, they have investigated the di®erent e®ects of government intervention in this area. For example, it has been found that, in general, safety regu-lations and their enforcement had little impact on the incidence of workplace accidents. There also seems to be a consensus on the fact that an increase in the generosity of work-ers'compensation (WC) bene¯ts is associated with an increase in both the frequency and the duration of claims due to workplace accidents. In this connection, some researchers have raised a potentially important issue: the possibility of substitution between WC and unemployment insurance (UI). In most countries, WC is more generous than UI in terms of wage replacement1, and there may therefore be an incentive for workers about
to be laid o® to try to bene¯t from WC instead of UI. Workers su®ering from a work-place accident may also be tempted to take action in order to obtain a longer period of recovery compensated by WC. These ex ante and ex post moral hazard problems are likely to be particularly important when injuries are hard-to-diagnose (e.g., low-back injuries) and in industries where the level of unemployment is such that many work-ers may expect to be unemployed and to receive UI bene¯ts after their recovery (e.g., in seasonal industries such as the Canadian construction industry, which is less active during winter because of weather constraints).
Fortin and Lanoie (1992) were the ¯rst authors to investigate these issues and to provide empirical evidence of substitution between the two insurance regimes. In par-ticular, from Quebec aggregate data at the industry level, they found that a reduction in the generosity of UI was associated with an increase in the average duration of work absences compensated by WC following a workplace accident. Before policy makers be convinced to take action in order to alleviate this problem, more investigation is required to provide further support for this initial result. In this paper, we estimate the e®ect of WC and UI bene¯ts on the expected duration of claims due to workplace accidents using a unique panel dataset that allows us to investigate more fully the issues raised above, and to control for some individual characteristics. The database is composed of
1For instance, in most American states, accident victims receive on average 67% of their gross
wage (non-taxable), while unemployed workers receive on average 50% of their gross wage (taxable). In Canada, the Quebec Workers' Compensation Board (WCB) provides accident victims with 90% of their net average wage (non-taxable), while the Canadian UI regime provides unemployed workers with 57% of their gross wage (taxable). The reader is referred to Fortin and Lanoie (1992) for more institutional details about these programs in Canada.
longitudinal WC administrative micro-data on more than 30,000 workers in the Quebec construction industry for the period 1976-1986.
Our theoretical discussion focuses on the hazard of returning to the labor market after an absence due to a workplace accident2. One prediction of the reduced form
model is that the UI replacement ratio has a positive impact on the hazard of leaving WC. Another is that this hazard is likely to be lower during months preceding the end of the construction season.
The empirical work tests our theoretical predictions. For this matter, we use a mixed proportional hazard model, devised by Meyer (1990), that does not impose a parametric form on the baseline hazard and that takes unobserved heterogeneity into account using a gamma distribution. Most previous work in this area has relied on parametric methods which assume, despite a lack of theoretical support, a speci¯c form for the baseline hazard (e.g., Weibull). This approach provides inconsistent estimates when the assumed baseline is incorrect. Examples of such work include Johnson and Ondrich (1990) who present three hazard models (a Weibull hazard without random e®ects, a Weibull hazard with a gamma-distributed random e®ect, and a Weibull hazard with a non parametric random e®ect) to analyze the duration of work absences in three American states among WC clients with diverse permanent partial disabilities. Furthermore, Butler and Worrall (1991) used the family of generalized gamma distributions, with parametric or non-parametric controls for heterogeneity, to investigate the duration of claims for temporary and permanent partial disability due to low-back injuries in twelve states (see also Butler and Worrall, 1985). These studies focused on the relation between WC bene¯ts and duration, and in general found the bene¯t elasticities of duration to be positive but small.
The rest of the paper is organized as follows. Section II presents our theoretical discussion and its implications. Section III discusses the estimation strategy and the data. Section IV analyzes the results. In brief, these results support the hypothesis that a reduction in the UI replacement ratio and an increase in that of the WC program are both associated with an increase in the duration of claims, especially in the case of workers with injuries that are di±cult to diagnose. Furthermore, there seems to be an important seasonal e®ect in the duration of claims; i.e., those occurring in December (at the end of the construction season for a majority of workers) are likely to last longer, ceteris paribus. This result is also consistent with the presence of a signi¯cant interaction between WC and UI in determining individuals' risk of accident. Section V provides concluding remarks and a discussion of the policy implications of our results.
2Fortin and Lanoie (1992) provide evidence that UI a®ects the duration but not the probability of
2. Theoretical discussion
The reduced form model to be estimated explains the instantaneous rate of exit from WC at time t, given that absence from work has lasted until t, i.e. the hazard, ¸t, of
the post-injury absence, as a function of a number of covariates3:
¸t= ¸(W CRt; UIRt; UNEMPt; W AGEt; D; MONTH; t; Xt) (2.1)
The following theoretical predictions are intuitive. A higher WC wage replacement ratio, W CRt, increases a worker's utility on WC. This e®ect reduces the hazard of
leaving WC (or increases the expected duration of the recovery period). Note that, in Quebec, in contrast to other jurisdictions, an injured worker is free to choose any physician to establish the validity of the accident. This tends to accentuate this moral hazard problem. On the other hand, when taking into account the employers' behavior, one can also argue that an increase in WC bene¯ts raises the opportunity cost of an accident for employers, who pay WC insurance premia. This may induce them to devote resources to reduce the risk of accidents. This e®ect may be especially acute when the degree of experience rating is high4. Therefore, the net e®ect of a change in the WC
wage replacement ratio is ambiguous and needs to be resolved empirically.
An increase in the UI wage replacement ratio, UIRt, (which is assumed to be smaller
than the corresponding WC ratio) raises a worker's expected utility in the labor market, given that he faces some risk of unemployment upon his return to work, thus increasing his incentive to leave WC5. In the same vein, an increase in the level of unemployment
(UNEMPt) reduces a worker's probability of ¯nding a job, thus reducing the expected
utility in the labor market and the probability of leaving WC. Moreover, the impact of the pre-injury W AGEton the probability of leaving WC is ambiguous, since it produces
a substitution and an income e®ect of opposite signs on the demand for non-market time. Moreover, for given levels of the wage replacement ratios, it is associated with an identical percentage increase in WC and UI bene¯ts, which raises both the worker's utility on WC and on the labor market.
Furthermore, Dionne and St-Michel (1991) have convincingly argued that the level of di±culty in making the diagnosis (D) is likely to amplify the e®ect of variables such
3This section summarizes a structural model developed in Fortin et al. (1994).
4In Quebec, as in the rest of North America, ¯rms are considered liable for workplace accidents
and pay WC insurance premia. Experience rating refers to the adjustment of WC insurance premia to re°ect claim experience.
5It is assumed that the individual has accumulated right to claim UI bene¯ts. In our empirical work,
we also tried variables re°ecting the regional minimum work requirement for eligibility to UI and the regional maximum duration of UI bene¯ts, as additional measures of UI generosity. However they were not statistically signi¯cant in any speci¯cation and have thus been excluded from the model. Note also that there is no experience rating under the Canadian UI scheme.
as the wage rate and the generosity of WC and UI bene¯ts on the rate of exit from WC. In terms of our model, these hypotheses imply the following inequalities:
j¸W AGEt;Dj; j¸UIRt;Dj; j¸W CRt;Dj ¸ 0:
One other implication of our model is that ¸t is likely to be lower, ceteris paribus, in
the months preceding winter, the lay-o® season in the construction sector. The reason is that a worker facing a workplace accident in December, for example, has a higher probability of being unemployed upon his return to the labor market after his recovery, than if the same accident occurs, say, in July. This is the case since the duration of claims is usually relatively short (31 days on average, in our sample). Therefore, he has a greater incentive to try to prolong his period on WC, given that the WC wage replacement ratio is greater than the UI ratio.
Lastly, the e®ect of the elapsed spell duration (t) on the rate of exit from WC is expected to be positive for two reasons: First, as time goes by, the worker is likely to have recovered from his injury, which increases his utility at work relative to his utility on WC. Second, the cost of obtaining extra days on WC is likely to be increasing, since a worker is less likely to ¯nd an accommodating doctor as this number increases. Note ¯nally that Xt denotes a vector of control variables.
3. Empirical methods and data
To estimate the reduced form model given by equation (2.1), we adopt the following mixed proportional hazard speci¯cation with unrestricted baseline hazard:
¸(z; t) = ¸0(t) exp(z0¯ + ²); (3.1)
where ¸0(t) is the baseline hazard (i.e., the part common to all individuals), z is a vector
of covariates, ¯ is a vector of parameters to be estimated and ² is a random variable re°ecting unobserved heterogeneity.
As argued by Meyer (1990), this semi-parametric procedure has the advantage of avoiding inconsistent estimation of parameters due to misspeci¯ed baseline hazard. Moreover, contrary to Cox's (1972) approach, it simultaneously provides a non-parametric estimate of the baseline hazard and easily accounts for the presence of unobserved het-erogeneity. As is well known, ignoring unobserved heterogeneity may lead to a dynamic selection bias in the parameter estimates and in the estimate of the baseline hazard. For example, as time goes by, it is possible that workers who do not return to the labor market are those with an intrinsic bad health condition. If one does not account for this
unobserved heterogeneity, one may end up having the false impression that the hazard declines over time (negative bias on the estimate of the baseline hazard).
A convenient and commonly used distribution for exp(²) is the gamma distribution6
with the mean normalized to one and variance ¾2. Under this assumption and given
observations of failure times over the discrete periods t = t0; t1; t2; : : : ; tT ¡1for individuals
i = 1; : : : ; N, the resulting log-likelihood is given by:
L(°; ¯; ¾2) = XN i=1 log 8 > < > : 2 41 + ¾2¢kXi¡1 j=0 expf°tj + z0i¯g 3 5 ¡¾¡2 ¡±i 2 41 + ¾2¢Xki j=0expf°tj+ z 0 i¯g 3 5 ¡¾¡29 > = > ;: (3.2) where °tj = ln( Rtj+1
tj ¸0(v)dv); ° = [°t0; °t1; : : : ; °tT ¡1], zi is a vector of covariates for
individual i, ±i = 1 if the duration for individual i is not (right) censored, = 0
other-wise, tki is the observed (censored or not) duration of individual i's spell on WC. The
expression exp(°tj)=(tj+1¡ tj) represents the average baseline hazard over the interval
[tj; tj+1].
3.1. Data and variables
The original data source for this study follows the evolution of 30,341 workers in the construction industry who worked at least one hour at the James Bay hydro-electric project (a major dam construction plan in northern Quebec) during the period 1976-86. We are able to track the work pattern (number of hours worked, occurrence of an accident, etc.) of the workers throughout this period as long as they were working in the construction industry. During the period, we count 8,523 workplace accidents with time lost in the sample involving 6,067 workers7. Descriptive statistics for the sample
are given in Table 1 at the end of the text. From this table, one can see that the average duration of claims is 31.2 days with a relatively large standard deviation of 66.1.
We now turn to the explanatory variables (the vector z) used in the estimations. Note that since the duration of spells on WC is usually short, we did not allow for time-dependent covariates. The WC replacement ratio (bene¯ts divided by the pre-WC net
6Other distributions could be used; in particular, the heterogeneity distribution could be
non-parametric, following the approach suggested by Heckman and Singer (1984). However, as conjectured by Meyer (1990, p.771), if the baseline hazard takes a °exible form, the choice of the heterogeneity distribution may be unimportant.
7An accident with time lost is an accident involving more than one day o® work. The permanent
marginal wage) has been calculated individually using information on the WC parame-ters and on the provincial and federal income tax systems in place in each year (see the details in Fortin et al., 1994, Appendix 1). In the literature, only Moore and Viscusi (1990) have a replacement ratio calculated individually. The mean WC replacement ratio in our sample (see Table 1) is 114 percent. One reason why it is greater than 100 percent is that, under the Quebec WC regulations, bene¯ts calculation is based on the earnings of the twelve months preceding the accident. In this calculation, the worker is imputed the same average weekly income for his period o® construction as the one he earns during the construction season, which tends to increase the numerator of the ratio. Second, since WC bene¯ts are not taxable and are based either on gross wages (before 1979) or on net average wages (after 1979), the (marginal) replacement ratio may be higher than 100 percent for workers with a marginal tax rate higher than a critical level. The expected e®ect of the WC replacement ratio on the hazard of leaving WC is ambigu-ous and depends on the level of experience rating that has been introduced in Quebec on a ¯rm-by-¯rm basis in 1979 (CSST, 1982). For this reason, in most speci¯cations, we introduce two variables to capture the generosity of WC: Log WCRB79 (log WCR times a dummy equal to one for each observation before 1979) and log WCRA79 (log WCR times a dummy equal to one for each observation in the years 1979-1986 inclusively). Given the introduction of experience rating in 1979, the latter is likely to have a less negative e®ect (or even a positive e®ect) on the hazard of leaving WC.
The UI replacement ratio is also calculated individually and is 0.57, at the mean of our sample. The variable UNEMP is de¯ned as the regional unemployment rate as determined by Statistics Canada. The WAGE is measured by the worker's hourly wage rate (in 1981 dollars). There is an important literature showing that the wage and the occupational safety level are the result of a simultaneous decision process (e.g., Garen, 1988), making the wage rate (and the replacement ratios) an endogenous variable8.
Moreover, individual unobservable characteristics that a®ect the wage rate (e.g., mo-tivation to work) may also in°uence the rapidity of return to work after an accident. For these reasons, in most speci¯cations, the wage variable and the two replacement ratios (all in log) have been replaced by generated regressors in the likelihood function, following a two-step approach suggested by Durbin (1970) and Pagan (1984)9.
The initial severity of the injury and the di±culty of the diagnosis are also part of the analysis. Of course, more severe injuries should be followed by longer recovery periods. Moreover, it may be easier for workers to extend their recovery period when they have a hard-to-diagnose injury (e.g., low-back injury), and one should also account
8For instance, according to the theory of compensating wage di®erentials, more dangerous jobs (with
longer duration of claims) lead to a higher wage rate, see Thaler and Rosen (1976).
9Note however that the standard errors of the corresponding estimated coe±cients are generally
inconsistent. While bootstrapping methods could theoretically be used to generate consistent standard errors estimates, such an approach would be highly time-consuming. One way to circumvent this problem is to interpret our analysis as conditional upon the value of the generated regressors.
for the fact that hard-to-diagnose injuries may be intrinsically more or less severe than others. For these reasons, and following Dionne and St-Michel (1991), we consider four categories of accident: 1) minor injuries with easy diagnosis, MINEASY; 2) minor injuries that are hard to diagnose, MINHARD; 3) major injuries with easy diagnosis, MAJEASY; and 4) major injuries that are hard to diagnose, MAJHARD. These are entered as dummy variables (MINEASY is default). As discussed in Dionne and St-Michel, this categorization was established in consultation with a physician specialized in work-related health problems10.
As discussed in the theoretical section, the di±culty of establishing the diagnosis may also interact with some other explanatory variables in in°uencing the individual's decision over the possible extension of his recovery period. For instance, it may be more tempting for a worker whose injury is hard to diagnose to seek such an extension when UI becomes less generous and when he knows that he will be laid o® if he goes back to work. Interaction terms between the dummies MINHARD and MAJHARD (which, in particular, refer to various categories of back disorders) and other covariates such as the wage rate and the replacement ratios have therefore been introduced in some speci¯cations. Initial investigation showed that four interaction terms persistently had a signi¯cant coe±cient:(log UIR)*MAJHARD, (log WCRB79)*MINHARD, (log WCRA79)*MINHARD and (log WAGE)*MINHARD.
In keeping with our theoretical discussion, we also consider monthly dummy variables to capture the fact that workers may have more incentive to extend their period of recovery if their accident happened just before the usual lay-o® season in the construction industry. Therefore, we expect the coe±cients of dummy variables for months like NOVEMBER and DECEMBER to be positive and signi¯cant (JULY is default).
Furthermore, three personal characteristics (Xt) are taken into account. First, the
AGE of the accident victim is introduced, since it is generally accepted (e.g., see Butler and Worrall, 1991) that, ceteris paribus, the capacity to recover physically from the e®ects of injuries declines with age. Second, a variable capturing the level of QUAL-IFICATION of the worker is included. It is de¯ned as the number of working years required to qualify as a registered member of a given occupation within the construction industry (e.g., carpenter). This variable is intended to capture the worker's skill level. As in Johnson and Ondrich (1990), it is expected that more skilled workers are better able to avoid severe accidents, or that they have more °exibility to re-integrate rapidly into the labor force than less skilled workers.
Third, a proxy for the number of dependent children (DEPENDENTS) is included. Our data set does not provide direct information on the latter variable. However, given
10The main types of occupational injuries that belong to each group are the following: (1) MINEASY:
contusion, poisoning, amputation without permanent partial disability and friction burn; (2) MIN-HARD: minor low-back injuries, bursitis; (3) MAJEASY: fracture and (4) MAJMIN-HARD: spinal disorders, severe low-back problems.
the age of each worker and general demographic information on the workers in the Que-bec construction industry (from the 1981 Canadian Census), we were able to calculate a variable approximating the number of dependent children. The expected sign of the coe±cient on this variable is positive. Indeed, if the worker provides an income support to a large family, he may be induced to leave WC rapidly.
In addition, we consider REGIONAL dummies to capture the fact that the nature of the construction projects may vary from one region to another (especially at James Bay), leading to di®erent types of accidents. After some experimentation, dummies for the regions of Quebec, James Bay and Abitibi have been used in estimations (other regions are default). Finally, we introduce year dummies to capture omitted ¯xed in°uences that vary across time, but not across individuals. These dummies may be useful to account for institutional changes in unemployment insurance and occupational safety policies (like changes in safety-enhancing measures) during the period that may not be captured with our WC and UI variables.
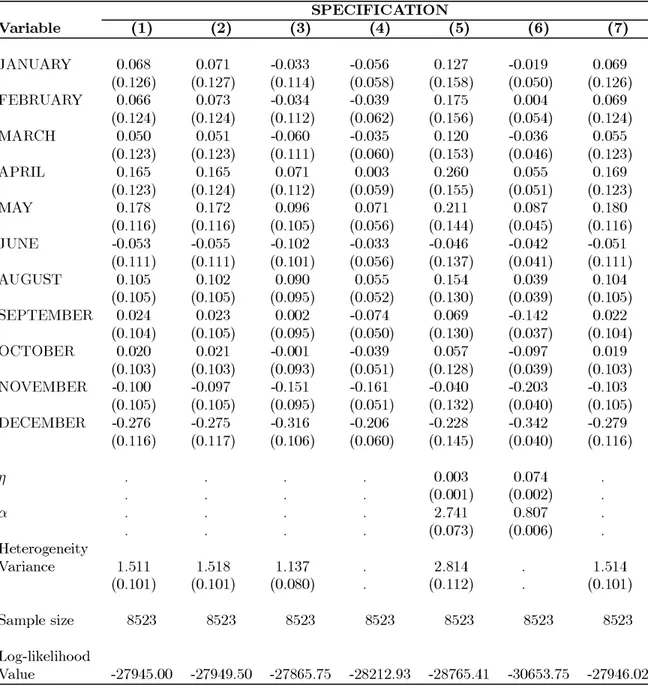
4. Empirical results
Our estimation results are presented in Table 2. The preceding discussion leads to a general speci¯cation using the two-step estimating method involving generated regressors for the wage and the replacement ratios 11. This speci¯cation is presented in column
(1). In order to assess the validity of the general speci¯cation and to test certain speci¯c restrictions, six other speci¯cations are presented. In particular, we examine how our main results are a®ected when the two-step estimating method is not used (speci¯cation (3)), when we do not account for unobserved heterogeneity (speci¯cation (4)), and when a standard parametric form (Weibull) is assumed for the baseline hazard (speci¯cations (5) and (6): with and without gamma-distributed heterogeneity e®ects). Speci¯cation (7) presents a slightly modi¯ed version of speci¯cation (1) where the coe±cients of UI and WC replacement ratios (non signi¯cant in speci¯cation (1)) are constrained to zero12.
11The variables used in the ¯rst-step regression to generate predicted wage rates (and, using a
tax-transfer computer program, the replacement ratios) are all the exogenous covariates used in the second
step and age2, age3, quali¯cation2, quali¯cation3, plus interaction terms between age and quali¯cation
(up to the second degree). These additional variables (which are all statistically signi¯cant) and the non-linearities in the tax-transfer system help identifying the model.
12Since there are more than 315 di®erent durations in our sample, we were unable to estimate a °
element for each of these durations. After some investigation, 36 elements of °, corresponding to di®erent time intervals, have been used in all speci¯cations considered. The 36 elements of ° correspond to the
following durations (in days): °i; i = 0; : : : ; 17 : i + 2 days; °18 : 20 ¡ 21; °19 : 22 ¡ 23; °20 : 24 ¡ 25;
°21 : 26 ¡ 27; °22 : 28 ¡ 29; °23 : 30 ¡ 31; °24 : 32 ¡ 33; °25 : 34 ¡ 35; °26 : 36 ¡ 37; °27 : 38 ¡ 39;
°28 : 40 ¡ 44; °29 : 45 ¡ 49; °30 : 50 ¡ 59; °31 : 60 ¡ 69; °32 : 70 ¡ 79; °33 : 80 ¡ 99; °34 : 100 ¡ 149;
°35 : 150 ¡ 199, °36 : 200 ¡ 2716. This last interval is censored. Over 10 intervals, the ¯ coe±cients
In general, the sign, the magnitude and the precision of the covariates coe±cients are robust across speci¯cations using the two-step estimation method, although slight di®erences appear in the Weibull speci¯cations. In discussing the results, we will ¯rst focus on speci¯cation (1) and (7) which are representative of the set of results.
The UI replacement ratio (when combined with MAJHARD) has a positive and signi¯cant coe±cient, indicating that a reduction in this variable induces workers with a major hard-to-diagnose injury to stay longer on WC. Using speci¯cation (7), our results imply that a reduction of 1% in the UI replacement ratio is associated with a decrease of 2.7% in the conditional hazard of leaving WC for these workers. Over all workers and at the sample mean of the covariates, the resulting elasticity of the expected duration of claims with respect to UI13 is estimated at -0.54. The magnitude of this result is close
to the elasticity of -0.5 reported in Fortin and Lanoie (1992).
Second, the WC replacement ratios before and after 1979, when combined with MIN-HARD, have negative and signi¯cant coe±cients, which means that WC induces workers su®ering from a minor hard-to-diagnose injury to go back onto the labor market later. Over all workers and based on results from speci¯cation (7), an increase of 1% in the generosity of WC is estimated to induce a 0.71% increase in the expected spell duration before 1979, and 1.09% after 1979, at the sample mean of the covariates. The stronger impact after 1979 than before is puzzling, given that an experience rating mechanism has been introduced in 1979. One possible explanation is that, at the same time, the Quebec WCB opened new regional o±ces to handle local compensation claims, an oper-ation which, until that date, was done centrally in Montreal and Quebec City. According to the WCB o±cials (see CSST, 1984), this has made accident reporting easier, thus enhancing any potential moral hazard e®ect that our WC variables are capturing. Note that in speci¯cation (2), where the WC replacement ratio is not divided into two com-ponents (before and after 1979), its e®ect on the hazard rate (when combined with MINHARD) is still negative, as in the rest of the literature, but less signi¯cant. More-over, a likelihood ratio test (with a Â2 statistic of 9.38) rejects the equality of the WCR
coe±cients before and after 1979. This suggests that it is warranted to account for the important policy changes occurring in 1979-1980.
The estimated impact of the WC ratio on duration for each sub-period is relatively strong compared to the rest of the literature. Typical WC duration elasticities vary between 0.2 and 0.6 (e.g., Meyer et al. 1995), although one study (Krueger 1990) ¯nds duration elasticities over 1.5. Three reasons could be advanced to explain such a result. First, the construction industry presents certain characteristics (regular lay-o®s) that make substitution between the two insurance regimes much more likely than in other sectors of economic activity. Moreover, it is likely that the intertemporal labor supply elasticity is higher in the case of individuals who choose to work in a seasonal industry.
13The expected spell duration for a given level of the covariates is obtained by evaluating the integral
Second, as mentioned earlier, in Quebec, in contrast with other jurisdictions, the role of the worker's doctor is crucial in determining the duration on WC. Therefore, moral hazard is likely to be more important than elsewhere. Third, the American studies do not account for the possible interaction between the two insurance regimes, which may bias their results14.
Furthermore, it is interesting to discuss why the two insurance regimes have a sig-ni¯cant e®ect when combined with di®erent types of hard-to-diagnose injuries (WC is signi¯cant when combined with MINHARD, while UI is signi¯cant when combined with MAJHARD). At least two reasons come to mind to explain this phenomenon. First, since major injuries that are hard-to-diagnose are intrinsically more severe and associ-ated with longer durations than minor injuries of the same type, recovery is statistically more likely to occur during the industry's dead season in which unemployment is higher, giving a stronger incentive to workers with MAJHARD injuries to stay on WC and avoid UI. Second, victims of major injuries that are hard-to-diagnose are more likely to be less employable and to face a period of unemployment at the end of their recovery period, giving them again a stronger incentive to stay on WC and avoid UI.
In addition, as predicted by the theoretical model, the fact that an accident occurs in DECEMBER (rather than in July) induces a reduction in the conditional hazard of leaving WC of 28%, which corresponds to an increase of 21.2% in the expected duration, at the mean of the other covariates. Such a ¯nding, as well as those described in the preceding paragraphs, indicates that ¯nancial incentives play a role in the determina-tion of duradetermina-tions, and is consistent with the existence of substitudetermina-tion between the two insurance regimes15.
It is also noteworthy that the coe±cient of the regional unemployment rate (UNEMP) is always signi¯cant, but never has the expected negative sign. One explanation for this phenomenon may be that, when unemployment increases, workers who quit the labor force are those with less seniority and experience, leaving in those who are less likely to have accidents involving a long recovery. This explanation is con¯rmed to some extent by the fact that, in all speci¯cations, our variable QUALIFICATION has a positive and signi¯cant coe±cient (except in speci¯cation (2)). Conversations with o±cials of the Association des entrepreneurs en construction du Qu¶ebec (AECQ) have provided us with further insight on this issue. They added that, during cyclical downswings, employers in the construction industry do not lay o® their \best" workers (like the foremen), with whom they have built a stronger relationship, and who are more likely
14Fortin and Lanoie (1992) actually show that the magnitude of the WC impact is reduced when one
does not account for the UI variables. This result is not surprising since, given that the UI and WC replacement ratios are positively correlated, omitting the UI ratio will produce a downward bias in the estimates of the e®ect of the WC ratio.
15None of the other monthly dummies is signi¯cant. NOVEMBER is negative and signi¯cant in the
speci¯cation (4) without unobserved heterogeneity, while SEPTEMBER, OCTOBER and NOVEMBER are negative and signi¯cant in the Weibull speci¯cation (6) without unobserved heterogeneity.
to go back to work quickly after an accident. In line with these arguments, one can add that, when unemployment is high, workers' status is more likely to be precarious, inducing them to re-integrate the labor force more rapidly after an accident.
Concerning the other variables, as in Meyer et al. (1995), the coe±cient of log WAGE is negative and signi¯cant (except in speci¯cation (3)). While a negative sign may partly be explained by the implied increase in the level of WC bene¯ts (since the WC ratio is assumed constant), this may also suggest the existence of an income e®ect such that high-income individuals can a®ord to "buy more leisure" and stay longer on WC. This argument may be particularly appealing given that our analysis focuses on an industry where the average wage is relatively high16, while other studies with converse
results (positive sign) are based on more heterogeneous samples (e.g., Butler and Worrall, 1991). Note however that the coe±cient of the interaction term (log WAGE)*MINHARD is always positive (except in speci¯cations (2) and (5)) and is signi¯cant in speci¯cations (1), (6) and (7), indicating that the negative wage e®ect is less important for workers experiencing minor hard-to-diagnose injuries.
Moreover, the coe±cient of the variable AGE is negative and signi¯cant, con¯rming that the capacity to recover from the e®ects of injuries declines with age. Furthermore, the behavior of the variable DEPENDENTS is somewhat erratic, its coe±cient being positive in certain speci¯cations and negative in others, but rarely signi¯cant. This may suggest that the variable is subject to measurement errors (recall that the number of dependents was constructed using general demographic data).
Finally, as regards REGIONAL dummies, it is noteworthy that workers who expe-rienced an accident at JAMES BAY are predicted to have longer duration of claims. Again, o±cials of the AECQ provided us with a convincing explanation for this phe-nomenon. Because the project was located in a remote area in Northern Quebec far away from the main urban centers of the province, the construction ¯rms working in the project had adopted an informal policy of reporting only the more severe accidents to the WC board. In doing so, the employers avoided returning workers with minor injuries to their families in southern Quebec, as such trips involve important expenses.
Let us now turn to the alternative speci¯cations ((2) to (6)) and the di®erent tests that can be made to assess the validity of our general speci¯cation. First, when the two-step estimating method is not used (speci¯cation (3)), the coe±cients of the vari-ables associated with the wage and the replacement ratios are relatively di®erent. In particular, the coe±cients of the WC replacement ratios become positive and signi¯cant, in contrast with all the other speci¯cations and with the rest of the literature. Also, the coe±cient of the interaction term between the WC replacement ratio before 1979 and MINHARD becomes positive and signi¯cant, again in contrast with all the other speci¯cations and with the rest of the literature, while the coe±cient of the variable (log
16For instance, during the period 1976-1986, the average weekly wage in the Canadian construction
UI)*MAJHARD is still positive, but much smaller in magnitude17. These results suggest
that the potential bias related to the endogeneity of the wage rate can be important. Second, regarding the heterogeneity issue, in all the speci¯cations estimated with the mixed proportional hazard model (speci¯cations (1), (2), (3), and (7)), the estimate of the heterogeneity variance is strongly signi¯cant. Speci¯cations (1) and (4) allow a direct comparison of estimates with and without unobserved heterogeneity. All the coe±cients in the heterogeneity speci¯cation tend to be larger in absolute values which is consistent with the theoretical prediction of Lancaster (1979, pp. 951-952). Furthermore, from Table 3, it is clear that, in speci¯cation (1) which accounts for unobserved heterogeneity, the average conditional hazard per day (at the sample mean of the covariates) is almost everywhere increasing with the duration on WC. However, it is noteworthy that the hazard rate is much lower (except in the ¯rst intervals) and tends in fact to decrease with duration, when one does not account for unobserved heterogeneity (see speci¯cation (4)). This provides particularly strong evidence of the negative heterogeneity bias in the estimate of the e®ect of duration on the hazard.
Third, along these lines, it is interesting to examine how the results are a®ected when one assumes a speci¯c form for the baseline hazard often encountered in the literature (Weibull with and without gamma-distributed random e®ects)18. Speci¯cations (5) and
(6) impose a Weibull baseline, while speci¯cations (1) and (4) estimate the baseline non-parametrically, allowing a comparison of the techniques with and without account taken for unobserved heterogeneity. In both cases, the likelihood ratio test strongly rejects the null hypothesis of a Weibull baseline, indicating that the Weibull model is misspeci¯ed. The Â2 statistics with 34 degrees of freedom are 1644.04 and 4860.2 for
speci¯cations (5) and (6) respectively. Also, it is noteworthy that ® is estimated at 2.746 in the Weibull speci¯cation (5) in which we allow for unobserved heterogeneity. This means that the hazard is monotonically increasing since ® is greater than 1. However, it is estimated at 0.808 when we do not allow for heterogeneity, which implies that the hazard is monotonically decreasing. This provides further evidence of the presence of a strong downward bias in the e®ect of duration on the baseline hazard when we do not account for unobserved heterogeneity.
17Furthermore, the coe±cient of QUALIFICATION is negative only in speci¯cation (3).
18Note that the conventional estimation of the Weibull was modi¯ed to allow for a comparison with the
Meyer's model, based on the same information set. More precisely, in contrast with usual calculations, in setting the likelihood function, we only take into account the information on the time intervals within which the actual durations in this sample are located. This allows the Weibull speci¯cation to be nested in the semi-parametric model. Thus, in the likelihood function (3.2), our Weibull formulation imposes
the °tj's to be equal to ln(
Rtj+1
tj (´®)v
®¡1dv) = ln ´ + ln(t®
j+1¡ t®j), where ´ and ® are the Weibull
5. Concluding remarks and discussion
In this paper, we have estimated the e®ect of Workers Compensation (WC) and Unem-ployment Insurance (UI) bene¯ts on the expected duration of claims due to workplace accidents using longitudinal WC administrative micro-data on more than 30,000 workers in the Quebec construction industry for the period 1976-1986. Our results show that increases in the generosity of WC in Quebec led to an increase in the average duration of claims due to minor accidents that are di±cult to diagnose. We also provided evidence that a reduction in the generosity of UI was associated with an increase in the duration of claims due to severe accidents that are hard-to-diagnose. Furthermore, there seemed to be a seasonal e®ect in the duration of claims: those occurring in December (at the end of the construction season for most workers) are likely to last longer. This is an-other important piece of evidence that there is substitution between WC and UI in the construction industry.
It is clear that this phenomenon produces both e±ciency and equity e®ects on the labor market. Thus, as long as the WC replacement ratio is higher than that of UI, this may induce some injured workers to invest ressources in order to prolong their period on WC, especially when they expect to be unemployed and receive UI bene¯ts upon their return to the labor market. This also can have the e®ect of increasing the dura-tion of (disguised) unemployment compensated by WC. Furthermore, this may involve higher payroll tax rates in order to fund the WC program, which may create additional distortions on the labor market. On the equity side, the presence of a substitution be-tween WC and UI implies a redistribution of income towards the unemployed who are compensated by WC instead of UI.
How can policy makers attenuate these e®ects? At ¯rst glance, one would consider equalizing the replacement ratios of the two regimes. However, there are at least two reasons why this should not be done. First, on e±ciency grounds, the moral hazard problem is likely to be more severe for unemployment insurance than for workers' com-pensation; workers are more likely to abuse UI than WC, ceteris paribus. Indeed, abusing WC probably imposes a higher cost on the individual (i.e., the cost of ¯nding an ac-commodating physician, etc.) than abusing UI. Basic insurance theory, which states that there exists a trade-o® between the extent of insurance coverage and moral hazard, would therefore recommend lower insurance coverage for UI than for WC. Second, on equity grounds, most of the time unemployed workers have the opportunity to get out of the "bad state of the world" by ¯nding another job, whereas this opportunity is more limited for injured workers.
It is di±cult, however, to ¯nd the optimal di®erence between the generosity of the two regimes. There exists a literature on the optimal rate of wage replacement under UI (e.g., Bailey, 1978 or Wright and Loberg, 1987) and, to our knowledge, one paper on the optimal rate under WC (Viscusi and Evans, 1991), but none takes into account
the interactions between these two insurance schemes. Presumably, one would have to extend the analytical framework present in these studies to account, not only for the trade-o® between insurance coverage and moral hazard within one regime, but also for cross-substitution e®ects between regimes. The literature on insurance of multiple risks (for instance, Arnott, 1991) generally suggests that, in such a case, there should only be one insurer to take into account, for example, the e®ect of a risk (e.g. unemployment) insured under a particular insurance regime (e.g. UI) on the behavior of individuals vis-a-vis another insured risk (e.g. workplace accidents). This means that the harmonization of both regimes could be useful in order to internalize the cross e®ects of each regime on the other. In Canada, such a solution would cause problems since, in contrast with the U.S., WC and UI are under di®erent jurisdictions (provincial in the case of WC and federal in the case of UI).
An international comparison of the generosity of the two regimes may serve as a start-ing point to determine the appropriate gap between the generosity of the two regimes. Lanoie (1994) provides a comparative analysis of the WC and UI systems in 14 countries of the OECD. It turns out that Canada is one of the countries (with Australia) where the gap between the generosity of the two regimes is the largest. This is especially true when one accounts for the waiting periods in the two regimes, and for the precise cal-culation of WC bene¯ts which allows, under certain circumstances discussed above, for a net replacement rate over 100% (due to the fact that WC bene¯ts are not taxable). Thus, the incentive for substitution should be larger in Canada.
The preceding discussion suggests a number of ways to alleviate this substitution problem. First, holding total expenditures on both regimes constant, there would prob-ably be less distortions and a potential welfare improvement if the replacement ratio under WC was lowered and that under UI increased. As a variation on this theme, one could lower the generosity of WC (e.g., by making bene¯ts taxable), leaving that of UI unchanged19. This reform would also allow to reduce the level of payroll taxes used to
fund the system, thus reducing tax distortions on the labor market. Lastly, the role of the worker's own physician, especially in Quebec, could be revised. As in other jurisdic-tions, an o±cial list of physicians specialized in work-related health problems could be used instead of relying on the worker's own choice of a physician. Along the same line, more attention should maybe be paid by the WCB to certain categories of accidents (those with di±cult diagnosis) that are more likely to lead to abuses. Altogether, this analysis raises an important issue for policy-makers: the necessity of considering the possible interaction between social insurance programs when studying the impact of key parameters in a given program. A useful extension to our research would be to inves-tigate whether UI parameters in°uence the frequency of accidents in the construction industry.
References
[1] Arnott, R. (1991), \Moral Hazard and Competitive Insurance Markets", in Con-tributions to Insurance Economics, ed. by G. Dionne, Boston: Kluwer Academic Publishers.
[2] Bailey, M.N. (1978), \Some Aspects of Optimal Unemployment Insurance", Journal of Public Economics, 10, 379-402.
[3] Butler, R.J. and J.D. Worrall (1985), \Work Injury Compensation and the Duration of Nonwork Spells", Economic Journal, 95, 714-724.
[4] Butler, R.J. and J.D. Worrall (1991), \Gamma Duration Models with Heterogene-ity", Review of Economics and Statistics, 73,161-166.
[5] CSST (1982), Annual Report 1982, Montreal: Quebec government.
[6] CSST (1984), Statistiques sur les lsions professionnelles 1980-84, Montreal: Quebec government.
[7] Cox, D.R. (1972), \Regression Models and Life-Tables", Journal of the Royal Sta-tistical Society, 34, 187-202.
[8] Dionne, G. and P. St-Michel (1991), \Workers' Compensation and Moral Hazard", Review of Economics and Statistics, 73, 236-244.
[9] Durbin, J. (1970), \Testing for Serial Correlation in Least-Squares Regression When Some of the Regressors are Lagged Dependent Variables", Econometrica, 38, 410-421.
[10] Fortin, B. and P. Lanoie (1992), \Substitution between Unemployment Insurance and Workers' Compensation: An Analysis Applied to the Risk of Workplace Acci-dents", Journal of Public Economics, 49, 287-312.
[11] Fortin, B., P. Lanoie and Christine Laporte (1994), \Te E®ect of Unemployment Insurance on the Duration of Workplace Accidents", Discussion Paper no IEA, 94-05, Montreal: Ecole des Hautes Etudes Commerciales.
[12] Garen, J. (1988), \Compensating Wage Di®erentials and the Endogeneity of Job Riskiness", Review of Economics and Statistics, 9-16.
[13] Heckman, J.J. and B. Singer (1984), \A Method for Minimizing the Impact of Dis-tributional Assumptions in Econometric Models for Duration Data", Econometrica, 52, 271-320.
[14] Johnson, W.G. and J. Ondrich (1990), \The Duration of Post-Injury Absences From Work", Review of Economics and Statistics, 72,578-586.
[15] Katz, L.F. and B. Meyer (1990), \The Impact of the Potential Duration of Un-employment Bene¯ts on the Duration of UnUn-employment", Journal of Public Eco-nomics, 41, 45-72.
[16] Krueger, A.B. (1988), \Moral Hazard in Workers' Compensation Insurance, Mimeo, Princeton University.
[17] Krueger, A.B. (1990), \Workers'Compensation Insurance and the Duration of Workplace Injuries", National Bureau of Economic Research Working Paper No. 3253.
[18] Lancaster, T. (1979), \Econometric Methods for the Duration of Unemployment", Econometrica, 47, 939-956.
[19] Lanoie, P. (1994), \Aspects ¶economiques de la sant¶e et s¶ecurit¶e au travail", Relations IndustriellesnIndustrial Relations, 49, 62-84.
[20] Meyer, B.D. (1990), \On Unemployment Insurance and Unemployment Spells", Econometrica, 58, 757-82.
[21] Meyer, B.D., W.K. Viscusi and D.L. Durbin (1995), \Workers' Compensation and Injury Duration: Evidence from a Natural Experiment", American Economic Re-view, 85, 322-40.
[22] Moore, M.J. and K.W. Viscusi (1990), Compensation Mechanisms for Job Risks, Wages, Workers' Compensation and Product Liability, Princeton: Princeton Uni-versity Press.
[23] Pagan, A. (1984), \Econometric Issues in the Analysis of Regressions with Gener-ated Regressors", International Economic Review, 25, 221-247.
[24] Thaler, R. and S. Rosen (1976), \The Value of Life Saving", in Household produc-tion and Consumpproduc-tion, ed. by N.E. Terleckyj. New York: NBER Press, Columbia University.
[25] Viscusi, W.K. and W.N. Evans (1990), \Utility Functions that Depend on Health Status: Estimates and Economic Implications", American Economic Review, 80, 353-374.
[26] Wright, R.D. and J. Loberg (1987), \Unemployment Insurance Taxes and Unem-ployment", Canadian Journal of Economics, 20, 36-54.
TABLE 1
DESCRIPTIVE STATISTICSa;b
Standard
Variable Mean Deviation Minimum Maximum
Duration (in days) on WC 31.22 66.12 2.00 1869.00
WC replacement ratio 1.14 0.11 0.47 1.43
UI replacement ratio 0.57 0.07 0.20 0.67
Real marginal weekly wage rate 288.99 114.77 5.33 1158.28
Real weekly WC bene¯ts 329.25 135.29 3.81 910.98
Real weekly UI bene¯ts (before tax) 272.48 122.72 4.08 680.65
Regional unemployment rate 12.55 2.81 6.90 21.60
Mineasy 0.40 0.49 0.00 1.00 Majeasy 0.12 0.33 0.00 1.00 Minhard 0.18 0.39 0.00 1.00 Majhard 0.29 0.45 0.00 1.00 Age 37.17 9.75 18.00 66.00 Dependents 0.52 0.17 0.03 0.65 Years of quali¯cation 1.41 1.50 0.00 4.00 Quebec 0.15 0.35 0.00 1.00 Abitibi 0.06 0.24 0.00 1.00 James Bay 0.22 0.42 0.00 1.00 January 0.05 0.22 0.00 1.00 February 0.05 0.23 0.00 1.00 March 0.06 0.23 0.00 1.00 April 0.06 0.23 0.00 1.00 May 0.08 0.26 0.00 1.00 June 0.09 0.28 0.00 1.00 July 0.08 0.26 0.00 1.00 August 0.12 0.32 0.00 1.00 September 0.12 0.32 0.00 1.00 October 0.13 0.33 0.00 1.00 November 0.11 0.31 0.00 1.00 December 0.07 0.25 0.00 1.00 Censored (=1 if right-censored) 0.01 0.11 0.00 1.00 a N=8523.
TABLE 2
HAZARD MODEL ESTIMATES
With generated regressorsa
(Standard errors in parentheses)
SPECIFICATION Variable (1) (2) (3) (4) (5) (6) (7) Log UI -0.940 0.134 -0.310 -0.579 -0.484 -0.702 . (0.906) (0.828) (0.208) (0.535) (1.017) (0.471) . (Log UI)*MAJHARD 4.333 4.340 0.523 1.273 7.427 0.937 3.766 (1.494) (1.494) (0.317) (0.867) (1.803) (0.743) (1.396) Log WC . -0.934 . . . . . . (1.287) . . . . . Log WCBE79 -5.114 . 1.859 -2.094 -6.724 -2.181 -4.205 (1.896) . (0.342) (0.940) (2.321) (0.834) (1.679) Log WCAF79 2.606 . 3.612 2.018 3.762 2.238 2.727 (1.786) . (0.264) (0.924) (2.208) (0.747) (1.758) Log WAGE -0.526 -0.620 -0.041 -0.003 -0.457 0.322 . (0.490) (0.489) (0.080) (0.232) (0.623) (0.180) . (Log WAGE)*MAJHARD 0.583 0.587 0.236 0.170 0.792 0.023 0.551 (0.153) (0.153) (0.101) (0.078) (0.189) (0.056) (0.152) Log UNEMP 0.437 0.457 0.432 0.204 0.585 0.200 0.395 (0.150) (0.150) (0.130) (0.069) (0.195) (0.058) (0.146) MAJHARD -2.926 -2.951 -2.346 -1.100 -3.032 -0.299 -2.996 (1.069) (1.071) (0.705) (0.552) (1.324) (0.446) (1.057) MAJEASY -2.191 -2.194 -1.881 -0.853 -3.335 -0.869 -2.194 (0.101) (0.101) (0.089) (0.045) (0.111) (0.030) (0.101) MINHARD -0.582 -0.583 -0.542 -0.320 -0.673 -0.382 -0.582 (0.064) (0.064) (0.057) (0.029) (0.081) (0.024) (0.064) DEPENDENTS 0.265 0.393 0.114 0.026 0.306 -0.027 0.216 (0.159) (0.153) (0.125) (0.079) (0.197) (0.067) (0.145) QUALIFICATION 0.034 0.041 -0.003 0.008 0.028 -0.010 0.015 (0.025) (0.025) (0.014) (0.012) (0.032) (0.009) (0.015) Log AGE -1.056 -0.944 -1.006 -0.595 -1.319 -0.696 -1.105 (0.120) (0.112) (0.085) (0.058) (0.147) (0.046) (0.105) QUEBEC 0.171 0.171 0.172 0.122 0.214 0.169 0.167 (0.070) (0.070) (0.063) (0.031) (0.091) (0.027) (0.070) ABITIBI -0.568 -0.562 -0.479 -0.277 -0.618 -0.252 -0.576 (0.099) (0.099) (0.089) (0.051) (0.125) (0.043) (0.099) JAMES BAY -1.473 -1.483 -1.349 -0.667 -2.071 -0.751 -1.570 (0.133) (0.133) (0.081) (0.064) (0.162) (0.052) (0.090) a Fixed e®ects for years have also been introduced.
TABLE 2 (ctd.) SPECIFICATION Variable (1) (2) (3) (4) (5) (6) (7) JANUARY 0.068 0.071 -0.033 -0.056 0.127 -0.019 0.069 (0.126) (0.127) (0.114) (0.058) (0.158) (0.050) (0.126) FEBRUARY 0.066 0.073 -0.034 -0.039 0.175 0.004 0.069 (0.124) (0.124) (0.112) (0.062) (0.156) (0.054) (0.124) MARCH 0.050 0.051 -0.060 -0.035 0.120 -0.036 0.055 (0.123) (0.123) (0.111) (0.060) (0.153) (0.046) (0.123) APRIL 0.165 0.165 0.071 0.003 0.260 0.055 0.169 (0.123) (0.124) (0.112) (0.059) (0.155) (0.051) (0.123) MAY 0.178 0.172 0.096 0.071 0.211 0.087 0.180 (0.116) (0.116) (0.105) (0.056) (0.144) (0.045) (0.116) JUNE -0.053 -0.055 -0.102 -0.033 -0.046 -0.042 -0.051 (0.111) (0.111) (0.101) (0.056) (0.137) (0.041) (0.111) AUGUST 0.105 0.102 0.090 0.055 0.154 0.039 0.104 (0.105) (0.105) (0.095) (0.052) (0.130) (0.039) (0.105) SEPTEMBER 0.024 0.023 0.002 -0.074 0.069 -0.142 0.022 (0.104) (0.105) (0.095) (0.050) (0.130) (0.037) (0.104) OCTOBER 0.020 0.021 -0.001 -0.039 0.057 -0.097 0.019 (0.103) (0.103) (0.093) (0.051) (0.128) (0.039) (0.103) NOVEMBER -0.100 -0.097 -0.151 -0.161 -0.040 -0.203 -0.103 (0.105) (0.105) (0.095) (0.051) (0.132) (0.040) (0.105) DECEMBER -0.276 -0.275 -0.316 -0.206 -0.228 -0.342 -0.279 (0.116) (0.117) (0.106) (0.060) (0.145) (0.040) (0.116) ´ . . . . 0.003 0.074 . . . . . (0.001) (0.002) . ® . . . . 2.741 0.807 . . . . . (0.073) (0.006) . Heterogeneity Variance 1.511 1.518 1.137 . 2.814 . 1.514 (0.101) (0.101) (0.080) . (0.112) . (0.101) Sample size 8523 8523 8523 8523 8523 8523 8523 Log-likelihood Value -27945.00 -27949.50 -27865.75 -28212.93 -28765.41 -30653.75 -27946.02
TABLE 3
AVERAGE (PER DAY) BASELINE HAZARD ESTIMATES (Standard errors in parentheses)
SPECIFICATION
Intervals (in days) (1) (3) (4)
2-3 0.066 (0.003) 0.068 (0.003) 0.083 (0.003) 3-4 0.078 (0.003) 0.075 (0.003) 0.079 (0.003) 4-5 0.106 (0.005) 0.099 (0.004) 0.088 (0.004) 5-6 0.143 (0.008) 0.127 (0.006) 0.097 (0.004) 6-7 0.118 (0.008) 0.102 (0.006) 0.068 (0.004) 7-8 0.123 (0.009) 0.103 (0.007) 0.062 (0.003) 8-9 0.104 (0.009) 0.085 (0.007) 0.047 (0.003) 9-10 0.120 (0.010) 0.097 (0.008) 0.050 (0.003) 10-11 0.142 (0.013) 0.112 (0.010) 0.054 (0.004) 11-12 0.152 (0.015) 0.118 (0.011) 0.052 (0.004) 12-13 0.162 (0.017) 0.123 (0.012) 0.051 (0.004) 13-14 0.171 (0.019) 0.128 (0.013) 0.050 (0.004) 14-15 0.267 (0.029) 0.196 (0.019) 0.070 (0.005) 15-16 0.209 (0.025) 0.150 (0.016) 0.050 (0.004) 16-17 0.182 (0.024) 0.128 (0.015) 0.040 (0.004) 17-18 0.185 (0.026) 0.129 (0.016) 0.039 (0.004) 18-19 0.163 (0.024) 0.113 (0.015) 0.032 (0.003) 19-20 0.195 (0.028) 0.133 (0.018) 0.037 (0.004) 20-22 0.225 (0.029) 0.151 (0.017) 0.039 (0.003) 22-24 0.235 (0.032) 0.155 (0.019) 0.037 (0.003) 24-26 0.240 (0.035) 0.155 (0.020) 0.034 (0.003) 26-28 0.245 (0.038) 0.155 (0.021) 0.032 (0.003) 28-30 0.271 (0.043) 0.169 (0.023) 0.032 (0.003) 30-32 0.283 (0.047) 0.173 (0.025) 0.031 (0.003) 32-34 0.317 (0.054) 0.190 (0.028) 0.032 (0.003) 34-36 0.356 (0.063) 0.210 (0.032) 0.033 (0.003) 36-38 0.295 (0.056) 0.172 (0.028) 0.026 (0.003) 38-40 0.392 (0.074) 0.224 (0.036) 0.032 (0.003) 40-45 0.420 (0.076) 0.233 (0.035) 0.030 (0.002) 45-50 0.444 (0.086) 0.237 (0.038) 0.026 (0.002) 50-60 0.576 (0.118) 0.290 (0.048) 0.027 (0.002) 60-70 0.713 (0.161) 0.334 (0.061) 0.024 (0.002) 70-80 0.894 (0.221) 0.393 (0.078) 0.023 (0.002) 80-100 1.110 (0.301) 0.446 (0.096) 0.020 (0.001) 100-150 2.050 (0.672) 0.683 (0.175) 0.017 (0.001) 150-200 3.508 (1.379) 0.956 (0.296) 0.013 (0.001)
Liste des publications au CIRANO
Cahiers CIRANO / CIRANO Papers (ISSN 1198-8169)
94c-1 Faire ou faire faire : La perspective de l’économie des organisations / par Michel Patry 94c-2 Commercial Bankruptcy and Financial Reorganization in Canada / par Jocelyn Martel 94c-3 L’importance relative des gouvernements : causes, conséquences, et organisations
alternatives / par Claude Montmarquette 95c-1 La réglementation incitative / par Marcel Boyer
95c-2 Anomalies de marché et sélection des titres au Canada / par Richard Guay, Jean-François L’Her et Jean-Marc Suret
Série Scientifique / Scientific Series (ISSN 1198-8177)
95s-34 Signaling in Financial Reorganization: Theory and Evidence from Canada / parJocelyn Martel
95s-35 Capacity Commitment Versus Flexibility: The Technological Choice Nexus in a Strategic Context / Marcel Boyer et Michel Moreaux
95s-36 Some Results on the Markov Equilibria of a class of Homogeneous Differential Games / Ngo Van Long et Koji Shimomura
95s-37 Dynamic Incentive Contracts with Uncorrelated Private Information and History Dependent Outcomes / Gérard Gaudet, Pierre Lasserre et Ngo Van Long
95s-38 Costs and Benefits of Preventing Worplace Accidents: The Case of Participatory Ergonomics / Paul Lanoie et Sophie Tavenas
95s-39 On the Dynamic Specification of International Asset Pricing Models / Maral kichian, René Garcia et Eric Ghysels
95s-40 Vertical Integration, Foreclosure and Profits in the Presence of Double Marginalisation / Gérard Gaudet et Ngo Van Long
95s-41 Testing the Option Value Theory of Irreversible Investment / Tarek M. Harchaoui et Pierre Lasserre
95s-42 Trading Patterns, Time Deformation and Stochastic Volatility in Foreign Exchange Markets / Eric Ghysels, Christian Gouriéroux et Joanna Jasiak
95s-43 Empirical Martingale Simulation for Asset Prices / Jin-Chuan Duan et Jean-Guy Simonato 95s-44 Estimating and Testing Exponential-Affine Term Structure Models by Kalman Filter /
Jin-Chuan Duan et Jean-Guy Simonato
95s-45 Costs and Benefits of Preventing Workplace Accidents : Going from a Mechanical to a Manual Handling System / Paul Lanoie et Louis Trottier
95s-46 Cohort Effects and Returns to Seniority in France / David N. Margolis
95s-47 Asset and Commodity Prices with Multiattribute Durable Goods / Jérôme Detemple et Christos I. Giannikos
95s-48 Is Workers' Compensation Disguised Unemployment Insurance? / Bernard Fortin, Paul Lanoie et Christine Laporte