Open Archive Toulouse Archive Ouverte (OATAO)
OATAO is an open access repository that collects the work of some Toulouse
researchers and makes it freely available over the web where possible.
This is
an author's
version published in:
https://oatao.univ-toulouse.fr/21398
Official URL :
https://doi.org/10.1016/j.msea.2017.11.051
To cite this version :
Any correspondence concerning this service should be sent to the repository administrator:
[email protected]
González-Martínez, Rodolfo and de la Torre, Urko and Ebel, André and Lacaze, Jacques and
Sertucha, Jon Effects of high silicon contents on graphite morphology and room temperature
mechanical properties of as-cast ferritic ductile cast irons. Part II – Mechanical properties.
(2017) Materials Science and Engineering: A, 712. 803-811. ISSN 0921-5093
OATAO
E
ffects of high silicon contents on graphite morphology and room
temperature mechanical properties of as-cast ferritic ductile cast irons.
Part II
– Mechanical properties
Rodolfo González-Martínez
a, Urko de la Torre
a, André Ebel
b, Jacques Lacaze
b, Jon Sertucha
a,⁎aInvestigación y Desarrollo de Procesos Metalúrgicos, IK4-Azterlan, Aliendalde Auzunea 6, E-48200 Durango, Bizkaia, Spain bCIRIMAT, Université de Toulouse, BP 44362, F-31030 Toulouse, France
Keywords:
High silicon ductile iron Mechanical properties Chunky graphite Chemical ordering
A B S T R A C T
In this second part of the investigation, room temperature mechanical properties and hardness evolution of cast irons with silicon contents ranging from 2.29 wt% to 9.12 wt% have been studied and related to structural results from thefirst part. Increasing silicon content increases ultimate tensile strength and yield stress until a maximum value of 719 MPa at around 5.0 5.2 wt% silicon for the former and 628 MPa at 5.2 5.4 wt% silicon for the latter. Brinell hardness remains increasing with silicon content with a maximum value of 396 at 9.12 wt% silicon. Elongation at rupture shows an opposite evolution and gradually decreases to zero at 5.3 wt% silicon. This evolution is related to chemical ordering of the ferritic matrix (embrittlement effect). Chunky graphite shows apparently no significant effect on the ultimate tensile strength and yield strength in cast irons with silicon contents higher than 4.0 wt%. However, it has a negative effect on elongation. This result contrasts with the negative effect of chunky graphite on mechanical properties of ductile irons reported in the literature for alloys with silicon contents lower than 3 wt%. It is suggested that this difference is due to the matrix strengthening effect of high silicon contents which overtakes the detrimental effect of chunky graphite. This study suggests that cast irons with silicon content as high as 5.0 wt% could be considered for industrial applications when high resistance and some ductility are requested.
1. Introduction
The interest for increasing silicon content in cast irons for better mechanical properties and higher corrosion resistance has been re cognized for long as reviewed by Fairhurst and Röhrig[1]. This has led to the development of the SiMo spheroidal graphite cast irons and there is still strong interest in further improving these latter alloys as shown with recent works[2 4]. Although further increase in silicon content is detrimental for impact properties of cast irons[5], there is a renewed interest for such high silicon alloys. This is because they show a good combination of tensile properties, a homogeneous microstructure and an expected excellent machinability with low tools wear when com pared to conventional ferritic or ferritic pearlitic alloys at similar levels of tensile strength [3,6 8]. Also, high silicon contents improve the corrosion resistance of cast irons against various environments[9,10]. However structural characteristics and mechanical properties of high silicon ferritic cast irons are still unclear for the highest silicon contents, i.e. above 3.5−4.0 wt%. These uncertainties are contributing to make it difficult the development of this group of ductile iron alloys for
different applications as customers commonly require highly controlled and low scattered casting properties.
Solid solution hardening with silicon is well known in ferritic cast irons and is associated with increased hardness, rupture stress and yield strength while elongation at rupture is progressively reduced
[6,8,11,12]. Impact resistance of ferritic ductile irons sharply decreases at increasing silicon content[13 16]though ductility is not reduced as much as it is commonly observed in ductile irons with increasing pearlite contents. When silicon content is further increased above most common practice, Stets et al.[12]and Glavas et al.[17]reported the existence of a maximum value for tensile strength and for yield strength at 4.2−4.3 wt% silicon in agreement with previous fragmentary knowledge [1]. Above this critical content they reported that both properties rapidly decrease. As reviewed by Wittig and Frommeyer
[18], there is a similar decrease in ductility in soft magnetic steels at about 4 5 wt% silicon. There is thus a clear interest in further studying this transition in cast irons and making it clear if the sharp drop in mechanical properties in this range of silicon contents has similar characteristics as those known for silicon steels.
⁎Corresponding author.
2. Experimental details
In this second part of the study, the room temperature mechanical properties of the 31 ductile iron alloys presented in thefirst part and of the 21 additional alloys are characterized. These additional alloys were prepared following the same procedure as that described in the first part of this work with some antimony addition to decrease chunky graphite formation. Data from the 25 ferritic alloys reported by de la Torre et al. [8]and from the three Ni free ferritic alloys reported by Lacaze et al.[15]have been also considered in the present study. The tensile parameters, ultimate tensile stress (UTS), yield strength (Y) and elongation (A), were measured using a Zwick Z250 tensile testing equipment at a controlled strain rate of 0.90 mm/min in the range where Y was determined. This rate was then increased to 24.12 mm/ min to determine UTS and A according to the standard ISO 6892 1 A224. Brinell hardness (HBW) was measured with a Instron Wolpert apparatus with a 10 mm diameter sphere and a load of 3000 kg. Vickers micro hardness (HV) measurements were performed using a Leica WMHT Auto workstation with a diamond pyramid and loads of 10 and 5 g for 10 and 5 s, respectively.
Scanning electron microscopy (SEM) characterization was carried out on the fracture surface of a few representative alloys using a Zeiss Ultra Plus microscope.
3. Results
Table 1shows tensile tests and Brinell hardness values together with chunky graphite fractions and the relevant amounts of significant ele ments for the same 31 alloys than in thefirst part of this work. All alloys were fully ferritic but alloy #26 which showed 3−5% pearlite because of its low Si content.Table 2lists the tensile mechanical properties and composition of the 21 additional alloys. Values of theΩSi parameter
that was defined in the first part of this study has been also included in
Tables 1 and 2to evaluate the risk of chunky graphite appearance.
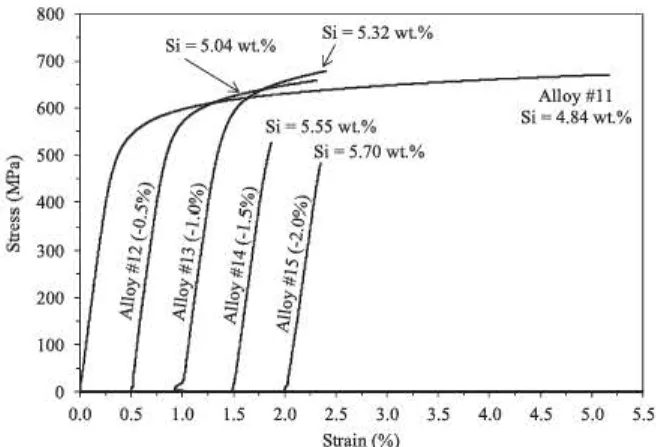
Fig. 1shows the tensile strain stress curves recorded onfive alloys with silicon content in between 4.84 wt% and 5.70 wt%. For read ability, the curves have been shifted along the abscissa as indicated
between brackets. In the high silicon range illustrated inFig. 1, it is observed that silicon does not significantly affect the Young's modulus, i.e. the slope of the curves in the elastic or pseudo elastic regime. In creasing the silicon content does increase the UTS value up to 5.21 wt% (see alloy #25 inTable 1) while it decreases at higher silicon contents. InFig. 1, this decrease is clearly related to a marked reduction of A up to a point where there is no plastic deformation for the highest silicon
Table 1
Tensile test results (UTS, Y and A), hardness values HBW, fraction of chunky graphite fCHGA (see part I), and carbon, silicon, antimony andΩ
Sicontents of the same 31 alloys as
in part I of this study.
Alloy UTS Y A HBW fCHGA C Si Sb ΩSi (MPa) (MPa) (%) (wt%) (wt%) (wt%) (wt%) 1 541 442 10.8 200 0.19 3.15 3.88 <0.0005 10.15 2 566 470 8.7 208 0.34 3.16 4.11 <0.0005 10.09 3 595 502 6.2 225 0.31 3.16 4.34 <0.0005 10.88 4 614 520 7.2 225 0.39 3.10 4.45 <0.0005 10.96 5 637 544 3.9 234 0.34 3.08 4.66 <0.0005 11.10 6 565 456 16.7 203 0.00 3.13 3.94 0.0038 7.15 7 587 485 10.2 217 0.30 3.13 4.25 <0.0005 10.66 8 631 516 10.9 228 0.04 3.10 4.45 0.0037 8.01 9 673 578 2.2 253 0.18 2.93 4.93 0.0028 9.46 10 701 592 2.5 265 0.02 2.93 5.11 0.0035 8.38 11 671 549 4.8 242 0.00 2.95 4.84 0.0040 7.41 12 659 577 1.4 256 0.04 2.91 5.04 0.0036 8.19 13 679 609 1.0 271 0.23 2.69 5.32 0.0040 8.70 14 526 0 0.0 282 0.03 2.72 5.55 0.0044 7.83 15 482 0 0.0 295 0.15 2.75 5.70 0.0039 9.70 16 681 603 2.1 263 0.04 2.71 5.15 0.0031 10.07 17 605 0 0.2 265 0.21 2.65 5.42 0.0031 9.93 18 661 625 0.5 269 0.15 2.75 5.36 0.0034 9.79 19 536 0 0.0 313 0.26 2.76 5.39 0.0029 10.42 20 397 0 0.0 285 0.33 2.77 5.56 0.0025 9.96 21 0 0 0.0 315 0.65 2.64 6.11 <0.0005 13.29 22 0 0 0.0 310 0.11 2.71 6.14 0.0042 10.16 23 615 517 10.1 225 0.43 2.96 4.61 <0.0005 10.89 24 636 518 15.5 220 0.00 2.90 4.60 0.0059 5.95 25 706 628 1.3 266 0.06 2.31 5.21 <0.0005 11.87 26 417 289 22.3 146 0.00 3.67 2.29 <0.0005 8.14 27 481 0 0.0 295 0.88 2.26 5.75 <0.0005 11.82 28 0 0 0.0 396 0.17 2.41 9.12 <0.0005 14.44 29 642 517 14.0 221 – 2.85 4.63 <0.0005 10.89 30 671 548 8.2 232 0.14 2.93 4.74 <0.0005 11.53 31 676 563 6.3 240 0.57 2.95 4.87 <0.0005 11.40 Table 2
Tensile test results (UTS, Y and A), carbon, silicon and Sb contents and value ofΩSifor the
21 additional alloys. Alloy UTS Y A C Si Sb Mg Ce ΩSi (MPa) (MPa) (%) (wt%) (wt%) (wt%) (wt%) (wt%) (wt%) 1-2 719 576 6.2 2.91 4.98 0.0025 0.037 0.0060 9.25 2-2 695 592 2.0 2.85 5.20 0.0032 0.034 0.0055 8.46 3-2 709 585 3.0 2.85 5.12 0.0041 0.035 0.0060 8.00 4-2 651 605 0.6 2.60 5.27 0.0047 0.031 0.0055 7.11 5-2 681 590 1.5 2.71 5.24 0.0035 0.038 0.0071 9.24 6-2 622 613 0.2 2.62 5.24 0.0033 0.033 0.0074 8.91 7-2 671 617 0.7 2.69 5.42 0.0037 0.036 0.0070 9.02 8-2 708 574 5.4 2.88 4.93 0.0028 0.037 0.0057 8.88 9-2 707 595 2.5 2.89 5.11 0.0030 0.036 0.0054 8.71 10-2 687 583 2.2 2.86 5.14 0.0038 0.033 0.0056 7.89 11-2 681 607 1.1 2.66 5.32 0.0045 0.029 0.0051 6.95 12-2 699 597 2.1 2.69 5.15 0.0033 0.034 0.0070 8.81 13-2 681 617 0.9 2.59 5.29 0.0032 0.034 0.0068 8.96 14-2 651 623 0.4 2.64 5.36 0.0039 0.033 0.0066 8.35 15-2 705 558 6.4 2.88 4.99 0.0027 0.037 0.0060 9.11 16-2 672 577 1.7 2.82 5.24 0.0032 0.034 0.0057 8.57 17-2 688 559 4.5 2.86 4.84 0.0042 0.035 0.0058 7.59 18-2 467 0 0.0 2.59 5.34 0.0049 0.033 0.0057 7.32 19-2 648 584 0.9 2.70 5.23 0.0035 0.037 0.0071 9.12 20-2 617 602 0.3 2.67 5.35 0.0037 0.036 0.0068 8.89 21-2 603 0 0.0 2.60 5.38 0.0035 0.035 0.0076 9.20
One of the reasons that could make difficult the analysis of the effect of silicon on mechanical testing is that this element is known to favor graphite degeneracy, i.e. decrease in nodularity and also appearance of chunky graphite [12,19 24]. Besides the influence on the matrix con
stituents, the nodule count, the size and the roundness of the graphite particles are determining factors with respect to mechanical properties
[11,25 31]. For alloys with silicon content lower than 3 wt%, it has
been reported that chunky graphite decreases elongation at rupture and ultimate tensile strength without affecting yield strength [25,32,33].
However, the most problematic effect for engineering applications is certainly that chunky graphite does also decrease fatigue resistance
[25,34 39].
In the first part of this study was presented the microstructure of 30 ferritic cast irons containing 3.88 6.11 wt% silicon, and one alloy at 9.12 wt% silicon. Chunky graphite formation could be observed and antimony was added to some of these alloys to limit the extent of this graphite degeneracy. An index denoted ΩSi that is based on the content
of the alloys in silicon, cerium, magnesium and antimony was proposed that shows a critical value around 7 wt%, over which the amount of chunky graphite increases steadily from zero. In this second part of the study, we report room temperature hardness and tensile properties of the alloys presented in part 1 and also from an additional set of 21 high silicon cast irons prepared similarly for reproducibility check in the highest silicon content range. The present data is also complemented with previous results on nodular cast irons with lower content in si licon, and is compared to literature data. In the discussion of these results, emphasis is put on the role of silicon on hardening the matrix and on the impact of chunky graphite.
800 ~ -700 600 200 100 Si =S.04 wt% Si=S.32wt%
"
Alloy#ll Si •4.84wt.o/o 0.5 1.0 1.5 2.0 2.5 3.0 3.5 4.0 4.5 5.0 5.5 Strain(%)Fig. 1. Effect t:i silicon content on the room temperature tensile straln-stress curves for alloys of the flrst series. For clarity, the curves have been shifted along the abscissa by a value ùulicated between braclcets.
contents. When there is no plastic deformation at rupture, the stress at
0.2% deformation cannot be determined so that the yield stress was here set to zero. This happened for silicon content higher than 5.34 wt<>/4 during the present study (alloy #18 2 in Table 2).
Fig. 2 shows the evolution with silicon content of UTS, Y and HBW
for the 31 alloys listed in Table 1 and for alloys with O. 92- 1.85 wt<>/4 Si (15) and 2.28- 3.81 wt<>/4 Si (8) previously investigated. In the graph, the solid vertical line at 3.85 wt<>/4 Si separates present from previous results, with the exception of alloy #26 in Table 1 which is on the left of this line. In Fig. 2, it is observed a good agreement between the various series of alloys and it is seen that HBW increases in the whole range of
silicon contents, namely up to 9.12 wt%. Further, it is noticed that in creasing silicon content leads to a continuous increase of UTS and Y up to about 5.2 wt<>/4 Si for the former and 5.2- 5.3 wt<>/4 Si for the latter. lt
thus appears a maximum in both UTS and Y which relates to the de crease in A as stressed in the presentation of Fig. 1 and not to a decrease
of the strength of the matrix. The vertical interrupted line in Fig. 2 corresponds to the maximum in UTS, thus emphasizing that the max imum in Y could lie to slightly larger Si content. However, the scat tering of the data plotted in Fig. 2 makes it difficult to ensure such result and this was the reason for preparing the second series of alloys.
Notice that the evolutions of tensile strength and yield strength with silicon content are not parallel below the limit defined by the inter rupted vertical line. The rate of increase in yield strength appears slightly larger than that of UTS, leading to a Y/UTS ratio which achieves a maximum value of 0.89 for the Si content corresponding to the maximum in UTS. Beyond their respective maximum, UTS and Y decrease sharply to zero as silicon content is further increased.
A continuous increase in tensile strength and yield strength with
800 700 ~ 600
!ll
500"!
~ 400 0 >- 300 ,,;5
200 100 AJJ.,ys prepored'
1D dus wc!rk 0 2 4s
6 7 8 9 Si(wt.%)Fig. 2. Evolution of UTS, Y and HBW with Si content for alloys prepared in titis work (right side from the sotid vertical Une) and for other ferritlc ductile Iron alloys (left side from the sotid vertical Hne) (8,15). The vertical interrupted Hne corresponds to the maximum value in UTS.
800 700
=o<fl'è
600~
t 3 ~
l
500 , ~ ~ %CD >- 400 00~
~ · 0t
0,,
)(s
300 ,-: 66fr<
200 6 OUTSdtiswork • IJTS Stcts et al. ~ 100 o UTS Olavas et al, a \JTS Bj&kegrei, et a1.ll.Ylhis work XY SlelSettl. 0 +YGlavasetal. • Y Bë»t.---o et al.
2 3 4 6 7
Si(wt.%)
Fig. 3. Comparison of UTS and Y values from the present work with data by Stets et al (12), Glavas et al. (17) and Bjorkegren et al. (6).
silicon content in ductile cast irons was described by Bjiirkegren et al.
(6) but their study was limited to a maximum silicon content of 4.2 wt %. On the other hand, a maximum value of tensile strength for high silicon ductile irons was reported by Stets et al. (12) at 4.3 wt<>/4 in si licon for alloys cast in both Y2 and Y 4 keel blocks. These authors also reported a maximum value of yield strength at a silicon content around 4.6 wt<>/4. Such a difference between the maximum strength and yield stress seems to be similar to the effect observed in Fig. 2 though at lower silicon content.
Values of tensile strength and yield strength in Fig. 2 have been plotted again in Fig. 3 together with data from Stets et al. (12) and from Glavas et al. (17) for standard Y2 blocks and from Bjiirkegren et al. (6) for cast bars 25 mm in diameter. lt is observed an excellent agreement among the various sets of data for silicon contents up to 4.6 wt% (UTS)
and 5.0 wt% Si (Y). However, data from the present work clearly shift the maximum in UTS and Y at a silicon content significantly higher than reported by Stets et al and Glavas et al. In all studies, UTS and Y de crease anyway sharply to zero when the silicon content is further in creased beyond the respective maximum. Note that it seems Stets et al.
(12) set Y equal to UTS when the yield stress could not be evaluated while it was set to zero in the present work as indicated above.
As mentioned previously, the additional group of 21 alloys was used to further characterize the range where the UTS and Y maximum values have been found with the first series of alloys. The results of both series are compared in Fig. 4. lt is seen that the UTS and Y maximum values are in the range 5.0-5.2 wt<>/4 and 5.2- 5.4 wt<>/4 Si, respectively. In the range 5.2- 5.4 wt<>/4 Si, UTS decreases slowly for most of the values but some very low values are also observed. These evolutions are in line with what could be expected from the description of the strain stress curves in Fig. 1, i.e. strongly related with the coupling between A and UTS values in this high silicon range.
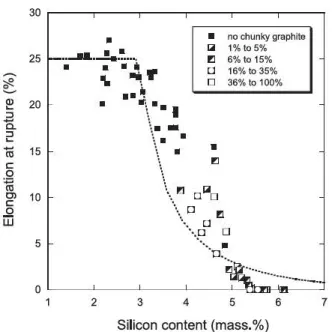
Fig. 5 presents the evolution of the elongation at rupture (A) with
750
,
- - - ; :
=====:::;,
o UTS fini series XUTS secood series
6 Y fU'SI saies 700
+
Y seoond series 650 1600 {/)!3
550 0 0 500 00 X 450+---...--...
- -
...
- -...
-~....--...
- --1 4.60 4.80 5.00 5.20 5.40 5.60 5.80 6.00 Si (wt.%}Fig. 4. Comparison between UTS results from flrst and second series of high silicon alloys prepared in titis work.
30 25
~
e...
~ 20 :,a.
:,...
1ii
15 C .Q1ii
0) C 10 0 '[j 5 0 1•
... ...!..~ ...
•
no chunky graphite lil 1%to5% El 6% to 15%.
.. llli!•
.
..
-
Cl•
16%to35% 36%to 100%..
~
..
\
•• 1
•
;.-\•
.
\.
~
\l"'I
•
1,1•
\ D El \. Cl··.•
0··
..
.•
o.~il·
·
···
·
···-····-..
2 3 4 5 6 7Silicon content (mass.%)
Fig. 5. Evolution wlth siticon content of the elongatlon at rupture A The dotted curve represents the evolutlon of the quantity 25{1-S) as cakulated at 300
•
c
(see text). The fullsymbols are for samples wlth no chunky graphite and the partlally fllled symbols are for samples wlth scme chunky graphite as ùulicated ln the captlon (see Section 4).
the silicon content for the same three series of data than those used for
Fig. 2. In agreement with the so called embrittling effect of silicon in cast irons, it is seen that A starts decreasing at a quite low amount of about 2.2 wt% Si and is zero at about 5.3 wt°/4 Si. In the low range of
silicon contents, the values in Fig. 5 agree very satisfactorily with those
reported by Bjiirkegren et al. (6) who reported a decrease in A from 20% at 2.2 wt°/4 Si to 15% at 4.2 wt°/4 Si. In the high range of silicon contents, the evolution of A seen in Fig. 5 totally agrees with values reported by Friess et al. [ 4) with a decrease from 17% at 4.0 wt% Si to 0% at a Si content of 5.3 wt%. Note that the critical silicon content at which A becomes zero relates exactly with the position of the maximum of Y in Fig. 4.
Such a continuous transition between fully ductile and fully brittle
materials strongly suggests it depends on ordering of the ferritic matrix
associated with silicon addition. In the Fe Si system, the bec phase
(ferrite) becomes B2 (FeSi) and then D03 (Fe:iSi) ordered at increasing
contents of silicon, see Fig. 6. The transition between the disordered ferrite and the start of B2 ordering occurs at a silicon content that in creases with temperature, up to the liquidus. lt is at about 10 at°/4 Si at
1000 ~ ~ - - - - ~ - - - ~ 900 0 t.., 800 Q)
...
2
~ 700 Q) a.E
~ 600 500··
A2
·
400 ~ ~ - ~ - - ~ - ~ - - ~ - ~ - - ~ - ~ 9 10 11 12 13 14 15 16Silicon content
(%
at.)
Fig. 6. Schematlc of the Fe-51 phase diagmm in the composition range of ordering of the
bec ferrite (redrawn from Wlttlg and Frommeyer (18)).
500 •c and 15 at°/4 at 1000 •c. The D03 ordering starts at slightly higher
silicon contents. For temperatures lower than 700 •c, the D03 ordering
leads to the appearance of a two phase B2
+
D03 domain which extendsto a maximum of 14 at°/4 Si.
The B2 ordering has been described in the assessment of the Fe C Si
system [ 40) with a two sublattice model At low silicon content, the bec
phase
is
disordered and the two sublattices have the same composition.Above a certain content in silicon which increases with temperature
their compositions start differing and the maximum ordering is
achieved when Si atoms fill one sublattice and Fe atoms the other one
(FeSi composition). An ordering parameter can be defined as
S
=
(yj.,
-
yJ.,)!(yj.,
+
yJ.,)
,
wherey},
is the fraction of sites occupied byFe in sublattice "i", with S varying from 0 to 1 when ordering increases.
The evolution of S has been calculated with Thermocalc and the TCFE8 database in the binary Fe Si system as no effect of carbon can be ex pected owing to its very low solubility in ferrite. Also, the calculation
was performed at 300 •cas it is not expected that any atomic movement
needed for ordering could take place at lower temperature (as a matter
of fact, most of the experimental data in the literature are limited to temperatures above 500 •c). The quantity 25{1 S) has been plotted with a dotted line in Fig. 5, where the constant 25 is for scaling the curve with the value of A at low silicon content. lt is seen that the predicted evolution of 25{1 S) follows satisfactorily the change in A,
thus confirming the close relation of the decrease of A with ordering. At
high silicon content, the abrupt decrease to zero of the experimental
values at 5.3 wt% Si must be related to D03 ordering which was not
modelled. Similarly, the embrittling effect of silicon has been reported
for steels when the silicon content exceeds 3.0- 3.5 wt% [ 41) where it
leads to the same abrupt decrease of UTS and Y values at the same time
as A drops to zero.
Ordering is also known to be related to an increase in hardness, and this is what the measurements of HBW in Fig. 2 show. To further in
vestigate this relation, it was decided to perform micro hardness mea
surements. Preliminary investigation with micro hardness Vickers
measurements were carried out under a load of 5 g during 5 s on alloys
#6 (3. 94 wt% Si) and # 15 (5. 70 wt% Si). Such a Joad is large enough to
obtain measurable length of the indent diagonals (around 5 µm) and
small enough to let room for further prints. Because build up of silicon microsegregation during solidification, it is expected that the local
hardness of the ferritic matrix changes from place to place. More pre
cisely, the silicon content and hence hardness should be higher close to
graphite nodules than away from them as already reported by Alhussein
et al. (16). Fig. 7 shows examples of HV measurements performed along
lines between two nodules for alloys #6 and #15. Notice that HV
evolution is similar for both samples, achieving the highest values in
locations close to graphite nodules as expected. However, HV differs
between these two samples, being higher in case of the alloy with the
highest silicon content.
HV micro hardness measurements have then been made system
atically on ail alloys of the first series using a Joad of 10 g applied during 10 s. In each sample, ten prints were randomly performed in areas away from graphite particles and ten others in areas close to them. Fig. 8 shows the evolution with silicon content of the average HV
values, with gray and open symbols corresponding to measurements
respectively close to and away from graphite nodules. The standard
deviation on individual measurements increases from 10 to 15 HV at
low silicon content to about 30 HV for 6 wt% silicon. As expected, it is
observed that HV values increase as silicon content does and that they
are higher in areas close to graphite nodules than in those far from them. lt is noticeable that the difference in HV values between areas
close to nodules and those remote from them nearly vanishes at silicon
contents larger than 5.3 wt°/4, and this is seen to relate to a slope change
which corresponds exactly to the drop of UTS and Y data observed in
Fig. 2. The slope change (pointed with the arrow in Fig. 8) has been also
reported by Wittig and Frommeyer (18) in their study of Fe Si ribbons at exactly the same silicon content. These authors related it to the
400
2
350
3300
4
s;
250
5
200
•
150
2
3
4
5
6
Measurerœnt
550
500
450
1;;
400
350
3
00
250
2
3
4
5
M
easuremen
t
Fig. 7. Micro-hardness indent Unes (column 10 the left) and correspondùtgevolutlon ofHV (column 10 the right) in alloy #6 (3.94 wt% Si, top row) and in alloy #15 (5.70 wt% Si, bottom row). 600 0 550 0 500 450
5:
400 350 300A~
0 250 0 200 2 4 6 7 9 10 Si(v.t.%)Fig. 8. Evolution t:i HV nûcro-hardness wlth silicon content ln the 31 alloys of the flrst
series. Gray dots were measured ln areas close 10 nodules and open ones oorrespond 10 areas away from !hem. The arrow peints on a slope change related 10 the start t:i D03
ordering (see text).
beginning of D03 ordering.
4. Discussion
This discussion is mainly intended to find out if chunky graphite has any effect on room temperature tensile properties of high silicon
spheroidal graphite cast irons and to analyze the effect of silicon on these properties. In these analyses, it is considered that the very small
amount of Fe Si C and Ti C particles reported in part I of the present study could not account for the changes in these properties which are closely related to the increase in silicon content per se.
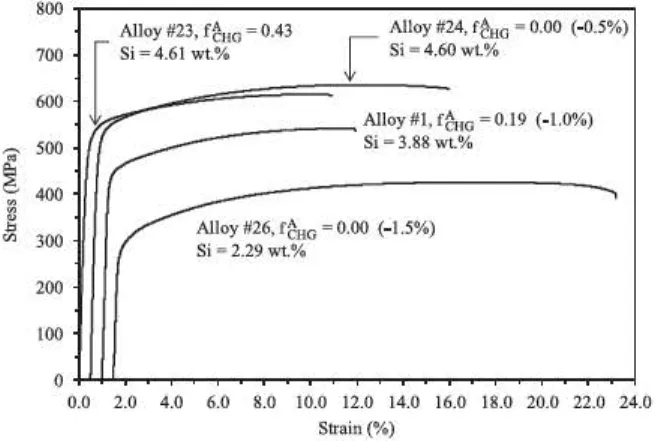
Fig. 9 shows a number of strain stress curves to discuss the effect of silicon and of chunky graphite. The curves for alloy #26 with 2.29 wt<>/4 Si and alloy #24 with 4.60 wt<>/4 Si were plotted to illustrate the effect of
,...
~
1
V, 800 700 600 500 400 300 200 100 Alloy #24, ffuo • 0.00 (-0.5%)r
Si•4.60wt% - - - -~ Alloy#l,fè,10=0.19 (-1.0%) Si• 3.88 wt.%o
0.0+-...,-~---~---~--~---l
2.0 4.0 6.0 8.0 10.0 12.0 14.0 16.0 18.0 20.0 22.0 24.0 $train(%)Fig. 9. Comparison of the stress-straln curves for alloys wlth various siticon contents and different fractlons of chunky graphite, as lndlcated alongside the curves. The curves for alloys #24, #1 and #2h have been shlfted along the X axis by a value lndicated between braclcets.
silicon in samples without chunky graphite. lt is seen that an increase of silicon content leads to important increase of UTS and Y while elon gation at rupture is reduced from 21-22% to 15-16%. SEM micro graphs of the rupture surface of these samples are shown in Fig. 10. For alloy #26, Figs. 10a and 10b show two views of a typical ductile fracture that could be expected from an alloy with comparatively low
silicon content. In the case of alloy #24, Figs. 10c and 10d show quite different features: i) Fig. 10c shows a mainly ductile rupture with some cleavage facets in the upper right of the micrograph; ii) Fig. 10d shows mainly intergranular rupture (note that several intergranular cracks may be observed) with however some cleavage faœts in the right side
of the micrograph. These observations suggest that the ductile area in Fig. 10c accounts for the large rupture strain showed by alloy #24
while the intergranular and brittle features inFig. 10d accounts for the decrease in elongation at rupture as compared to alloy #26.
For investigating the effect of chunky graphite at intermediate si licon content, alloy #1 with 3.88 wt% Si and 0.19 area fraction of chunky graphite was selected. The corresponding strain stress curve in
Fig. 9 shows that UTS is increased while A is significantly decreased
with respect to alloy #26.Fig. 5shows in fact that this A value is the smallest one of the alloys with 3.8−4.0 wt% silicon and that there is a close relationship with the presence of chunky graphite. The rupture surface of alloy #1 is shown at two magnifications inFig. 10(e and f) where it is seen a ductile rupture in areas containing nodules and those containing chunky graphite. A higher content in chunky graphite would have quite certainly further decreased the elongation at rupture and thus the UTS value as reported in the literature.
Finally, the tensile strain stress curves for alloys #23 (4.61 wt% Si) and #24 (4.60 wt% Si) inFig. 9allow studying the effect of chunky graphite for alloys with very similar and high silicon contents. These curves show the yield stress is the same for both alloys while the UTS values are very similar. The weak effect seen for the UTS value is much lower than the one reported in studies on ductile irons with compara tively low silicon contents[35 37]. Thus, the main difference between
these two alloys is the value of A which is significantly lower for alloy #23 containing chunky graphite than for alloy #24 with no graphite degeneracy.
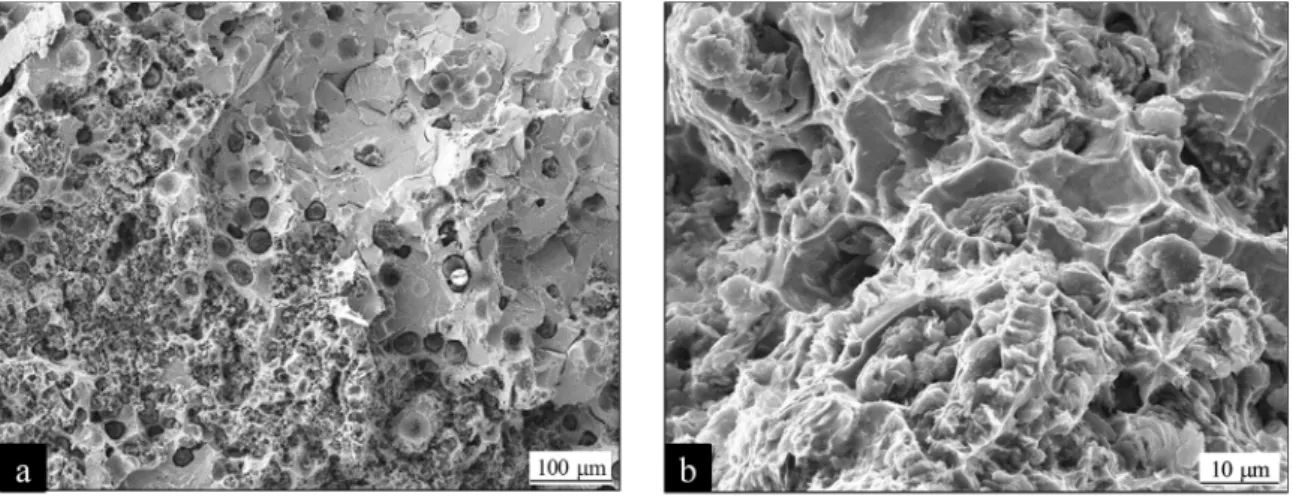
SEM observation of the fracture surface of alloy #23 is illustrated with the micrographs inFig. 11where areas with nodules mainly show cleavage facets and intergranular rupture (see the upper right zone of
Fig. 11a) which appear similar to those observed in alloy #24. Areas
with chunky graphite show surfaces with some level of deformation of the metallic matrix (Fig. 11b) that could indicate a ductile fracture.
It appears somehow paradoxical that areas with chunky graphite show a ductile like fracture when they have certainly solidified early during the eutectic reaction, thus at high silicon content as this element segregates negatively during solidification. It has been verified that the fracture surface in areas with chunky graphite in alloys containing slightly more than 5 wt% Si also shows characteristics similar to those illustrated inFig. 11while elongation was lower than 2.6%. With fur ther increase in silicon content, observations made on alloy #27 with 5.75 wt% Si show a fully cleavage fracture in the extensive areas with chunky graphite (seeFig. 12) that is likely the reason for the lack of any measurable value of Y and A in this alloy and in those with the highest silicon contents.
As expected, increasing the silicon content of the alloys promotes a change in the fracture surface from ductile to fragile in areas with no dules. However, there is no such change in areas containing chunky graphite at silicon contents lower than 5.5−5.7 wt%. This suggests that the small distance between graphite strings in the chunky graphite cells leads to early damage (at low strain, i.e. in the elasto plastic regime) of the matrix during tensile testing. Because of this damage, the actual stress on the loading surface increases at lower overall strain than for samples without chunky graphite. This schematic would explain the role of chunky graphite on tensile properties of cast irons: i) for low Si ductile irons this leads to a decrease of the UTS and A values because the matrix is ductile and highly sensitive to early damage; ii) for high Si ductile irons, the high strength of the matrix in areas with nodules delays the propagation of the damage initiated in the chunky graphite
areas, leading to a much lower sensitivity to graphite degeneracy. That chunky graphite has apparently no effect on UTS and Y was confirmed by plotting the same data as inFig. 2but differentiating the
results with gray shade according to the amount of chunky graphite. This is shown inFig. 13where it is effectively seen that the increase of UTS and Y with increasing silicon content up to 5 wt% does not seem to be affected by the amount of chunky graphite. This result is made evident in case of alloys #23 and #31 which contain high level of chunky graphite and are represented with black solid symbols well within the range of values for other alloys with lower chunky graphite fractions. In the same area of the graph, it can also be seen dots cor responding to alloys #24 and #11 marked with arrows and plotted with open circles, i.e. in which no chunky graphite was detected. Finally, it may be noticed that alloys defining the maximum in UTS contain a chunky graphite area fraction equal to or lower than 0.06 (palest gray solid dots inFig. 13).
The apparent lack of effect of chunky graphite on tensile strength is also observed when comparing UTS data from the first and second series of alloys represented with open circles and crosses inFig. 4. The
21 alloys of the second series show ΩSi values in the range
6.95−9.25 wt% (seeTable 2) while this parameter ranges from 7.41 wt % to 11.87 wt% for alloys from thefirst series that define the maximum in UTS. As it has been indicated in thefirst part of this study, the critical value ofΩSifor standard Y2 keel blocks is around 7 wt%, below which
chunky graphite formation is not expected. By consideringFig. 11in part I, alloys from the second series showΩSivalues that would lead to
chunky area fractions of about 0.00 0.18 while 0.02 0.65 would be expected for the corresponding alloys from the first series. SEM
Fig. 11. SEM micrographs of the fracture surface of tensile sample of alloy #23.
800 Alloys prcpared in this worlc 700 600
i
soo > 400 65
300 200)
l t
'Bi
0 UT$ fCOUTSfCHHG G=~= 0% '/47
o UTS !CHO• 11°23%~d
?
·
"o o UTS fCHG -26°39%~
·
.
• UTS fCHO • 43°88'/4<rl;p(!S>
Ali. 6 Y fCHG• 0'/4 ocP✓
0 6Y fCHG=2-o¾ il Y fCHG = 1 t-23%"" r
• Y fCHG = 26-39¾ • Y fCHG =•
3-88% t:. 100 0-
·
-Si (wt.%)Fig. 13. Values of UTS and Y for alloys with different amounts of chunky graphite.
m
a..
6
(/) f-:::, 800 700 600~~
X
•
~ 500,~
400 ) 300 200 100 0 0X.
X ~ !'.I D wl El•
Cl•
•
Elîncreasîng silicon content
5
•
no chunky graphitewl 1%to5% El 6% to 15%
•
16%to 35% D 35%10 100% X s~uies 2 10A(%)
Fig. 14. Relation between A and UTS around the maximum in UTS.
'
15
inspections made on fracture surfaces of alloys #4 2
(0s
1=
7.11 wt<>/4)and #6 2 COs1
=
8.91 wt<>/4) led to estimate ffHG values lower than 0.10 which agree with the chunky graphite prediction made by means of Os;.A more detailed structural study of the whole set of alloys from second series will be the subject of future work.
Concerning elongation at rupture A, the results reported in Fig. 5
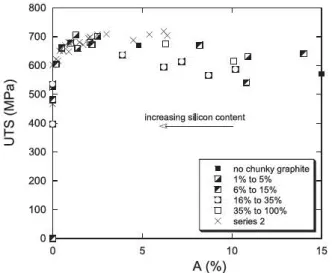
were already showing the amount of chunky graphite. It could be seen that there are alloys with low chunky graphite content or without this defect at high silicon content (alloys #10 to #12, #16 and #25) which show low and very low values of A. This is an indication that chunky graphite may not be prevalent in determining elongation at rupture for alloys with high silicon contents. In other words, even though the effect of chunky graphite was confirmed for alloys with lower silicon content and high A values, the intrinsic effect of increasing silicon content on the decrease of A seems to overtake the effect of chunky graphite at silicon content higher than 4.60 wt<>/4. As already demonstrated, the embrittlement effect is most probably related to ordering of ferrite and it has been stressed that there should be a close relation between UTS and A near the maximum of UTS and Y. This is further illustrated in Fig. 14 where the data for the first series of alloys have been differ entiated depending on the amount of chunky graphite. Thus, increase in silicon content makes the matrix tougher, overtaking the detrimental effect of chunky graphite.
5. Conclusions
In this second part of the study, the room temperature mechanical properties of the alloys investigated in the first part have been char acterized and complemented with results from an additional series of high silicon alloys and from previous results of low silicon alloys. In this
way, a detailed evolution of the mechanical properties of cast irons with silicon ranging from 1.3 wt<>/4 to 6.15 wt<>/4 was performed. As expected,
HBW hardness increases continuously up to 310 315 at 6.15 wt<>/4 Si, and even to 396 in an alloy containing 9.12 wt% silicon. In contrast, the ultimate tensile strength UTS and the yield strength Y present a max imum at 5.0-5.2 wt% Si for UTS and 5.2-5.4 wt<>/4 Si for Y. Both parameters rapidly decrease to zero
as
silicon contentis
increased. The values of UTS and Y reported in the present study agree with literature results up to 4.6 wt<>/4 Si, but show a maxinlum at higher silicon contents than previously indicated. This opens up the possibility to design castirons with higher silicon contents than thought until now.
However, the increase in UTS and Y is also associated with a de crease of the elongation at rupture A which is zero atabout 5.3 wt<>/4 Si. This decrease is associated with chemical ordering of the ferritic matrix which is the reason for the so called embrittlement of cast irons as their silicon content is increased. The critical silicon content is exactly the one at which the maximum values of UTS and Y were found. The de crease of Ais quite sharp between 3 and 5.3 wt% Si. In turn, this means that alloys at 5.0-5.2 wt<>/4 Si content that correspond to the maximum in UTS do present an elongation at rupture of a few perœnts and could thus be considered for industrial applications.
As presented in the first part of the study, many of the high silicon alloys contain chunky graphite in an amount that could be decreased by
adding antimony. For silicon contents up to 4 wt<>/4, it was found that chunky graphite affects significantly both UTS and A as reported in the literature for common low silicon ductile irons. However, this sensi tivity is much less prevalent at silicon contents higher than this value.
The present results suggest that as silicon makes the matrix harder, this overtakes the detrimental effect of chunky graphite at silicon contents higher than 4.60 wt<>/4.
Acknowledgements
The authors want to thank TQC Technologies for experimental support. This research did not receive any specific grant from funding agencies in the public, commercial or not for profit sectors.
References
(1) W. Fairhurst, K. Rohrig, High-silicon nodular irons, Foundry Trade J. 146 (1979)
657-681.
(2) G. Llao, D. Li, G.B. Burger, R.N. Logan, Cast Iron Wlth lmproved High Temperature Propertles, Patent application publication US 2008/0274005 Al.
(3) P. Weijl,J. Brachmann,A. Bilhrig-Polaczek, S.F. Fischer, Influence ofniclcel and cobalt on nûcrœtructure of siticon solution strengthened ductile iron, Mater. Sd. Technol. 31 (2015) 1479-1485, http:/ /dx.doi.ocg/10.1179/1743284714Y. 0000000735.
(4) J. Friess, B. Pustal, P. Weiss, M. Riebisch, A. Kutz, A. Bilhrig-Polaczech, CASTECH 2016, Darmstadt, (http://www.casttec2016.de/uploads/CastTec 2016
Tagungsband Proceedings.pdf), (accessed 23 July 2017).
(5) W.L. Bradley, M.N. Srinivasan, Fracture and fracture toughness of cast irons, !nt.
Mater. Rev. 35 (1990) 129-161, http://dx.doi.org/10.1179/ 095066090790324028.
(6) L.E. Bjorkegren, K. Hamberg, B. JohaMesson, Mechanical properties and machin
-ability ofSi-solution-hardened ferritic ductile irm,AFS Trans. 104 (1996) 139-145.
(7) L.I!. Bjôrkegren, K. Hamberg, Silicon alloyed ductile iron with excellent ductltity and machùtabilJty, Keith Mi!Hs Symp. proœedùtgs, 2003.
(8) U. de la Torre, A. Loizaga, J. Lacaze, J. Sertucha, As cast high silicon ductile irons with optlnûsed mechanical propertles and remarkable fatigue properties, Mater. Sd. Technol. 30 (2014) 1425-1431, http://dx.doi.org/10.1179/1743284713Y. 0000000483.
(9) A. Reynaud, Corrosion of cast irons (cap. 2), ùt: T.JA. Richardson (Ed.), Shreir's Corrosion, vol. 3, Elsevier, Amsterdam, The Netherlands, 2010, pp. 1737-1788. (10) M.A. Arenas, A. Niklas, A. Conde, S. Méndez, J. Sertucha, J.J. de Damborenea,
Corrosion behaviour of ductile cast Irons partially modifled with silicon ln 0.03 M
NaCI, Rev. Met. 50 (2014) e032, http://dx.doi.org/10.3989/revmetalm.032. (11) J. Sertucha, J. Lacaze, J. Serralladt, R. Suârez, F. Osuna, Effect of alloying on
mechanical propertles of as cast ferritlc nodular cast irons, Mater. Sd. Technol. 28
(2012) 184-191, http:/ /dx.doi.ocg/10.1179/1743284711Y.0000000014. (12) W. Stets, H. Loblidt, G. Gassner, P. Schumacher, Solution strengthened ferritlc
ductlle cast iron properties, production and application, !nt. J. Met. 8 (2014) 35-40,
http:/ /dx.doi.org/10.1007 /BF03355580. (13) G.N.J. Gilbert, BCIRAJ, vol 8, pp. 401-421, 1960.
London, 1976.
[15] J. Lacaze, P. Larrañaga, I. Asenjo, R. Suárez, J. Sertucha, Influence of 1 wt% ad-dition of Ni on structural and mechanical properties of ferritic ductile irons, Mater. Sci. Technol. 28 (2012) 603–608,http://dx.doi.org/10.1179/1743284711Y. 0000000100.
[16] A. Alhussein, M. Risbet, A. Bastien, J.P. Chobaut, D. Balloy, J. Favergeon, Influence of silicon and addition elements on the mechanical behavior of ferritic cast iron, Mater. Sci. Eng. A 605 (2014) 222–228,http://dx.doi.org/10.1016/j.msea.2014. 03.057.
[17] Z. Glavas, A. Strkalj, A. Stojakovich, The properties of silicon alloyed ferritic ductile irons, Metalurgija 55 (2016) 293–296.
[18] J.E. Wittig, G. Frommeyer, Deformation and fracture behavior of rapidly solidified and annealed iron-silicon alloys, Metall. Mater. Trans. A 39A (2008) 252–265, http://dx.doi.org/10.1007/s11661-007-9436-7.
[19] S.I. Karsay, E. Campomanes, Control of graphite structure in heavy ductile iron castings, AFS Trans. 78 (1970) 85–92.
[20] B. Prinz, K.J. Eschborn, T. Schulze, R. Döpp, E. Schurmann, Untersuchung von Ursachen von Graphitentartungen bei Gusseisen mit Kugelgraphit in Form von chunky-Graphit, Giessereiforschung 43 (1991) 107–115.
[21] Z. Jiyang, W. Schmitz, S. Engler, Untersuchung der Gefügebildung von Gusseisen mit Kugelgraphit bei langsamer Erstarrung, Giessereiforschung 39 (1987) 55–70. [22] K. Hamberg, L.E. Björkegren, Z.X. Sun, Chunky graphite in ductile iron, a literature
survey, Sven. Gjuteriföreningen (1997) 16–49.
[23] J. Lacaze, L. Magnusson-Åberg, J. Sertucha, Review of microstructural features of chunky graphite in ductile cast irons, in: Proceedings Keith Millis symposium, Nashville, AFS, pp. 360–368, 2013.
[24] U. de la Torre, J. Lacaze, J. Sertucha, Chunky graphite formation in ductile cast irons: effect of silicon, carbon and rare earths, Int. J. Mater. Res. (Form. Z. Metall.) 107 (2016) 1041–1050,http://dx.doi.org/10.3139/146.111434.
[25] G.K. Bousse, J. Parolini, N. Rojek, C. Zhou, Quality requirements for General Electric ductile iron castings exceeding 10T used for wind and gas turbine com-ponents, in: Proceedings of the WFC congress, 2010.
[26] G.M. Goodrich, R.W. Lobenhofer, Effect of cooling rate on ductile iron mechanical properties, AFS Trans. 110 (2002) 1003–1032.
[27] G.M. Goodrich, R.W. Lobenhofer, Effect of cooling rate on pearlitic ductile iron mechanical properties, AFS Trans. 115 (2007) 07–045.
[28] G.H. Hsu, M.L. Chen, C.J. Hu, Microstructure and mechanical properties of 4% cobalt and nickel alloyed ductile irons, Mater. Sci. Eng. A A444 (2007) 339–346, http://dx.doi.org/10.1016/j.msea.2006.09.027.
[29] J. Serrallach, J. Lacaze, J. Sertucha, R. Suárez, A. Monzón, Effect of selected al-loying elements on mechanical properties of pearlitic nodular cast irons, Key Eng.
Mater. 457 (2011) 361–366,http://dx.doi.org/10.4028/www.scientific.net/KEM. 457.361.
[30] J.M. Tartaglia, R.B. Gundlach, G.M. Goodrich, Optimizing structuproperty re-lationships in ductile iron, Int. J. Met. 8 (2014) 7–38,http://dx.doi.org/10.1007/ BF03355592.
[31] L. Ceschini, Al Morri, An Morri, E. Salsi, R. Squatrito, I. Todaro, L. Tomesani, Microstructure and mechanical properties of heavy section ductile iron castings: experimental and numerical evaluation of effects of cooling rates, Int. J. Cast. Met. Res. 28 (2015) 365–374,http://dx.doi.org/10.1179/1743133615Y.0000000022. [32] M. Gagné, D. Argo, Heavy section ductile iron castings– Part I: structure and
properties, in: J. Easwaren (Ed.), Int. Conf. "Advanced Casting Technology", ASM Int., 1987, pp. 231–244.
[33] R. Källbom, K. Hamberg, L.E. Björkegren, Chunky-graphite– formation and influ-ence on mechanical properties in ductile cast iron, in: J. Samuelson, G. Marquis, J. Solin (Eds.), Competent Design by Castings– Improvements in a Nordic Project, VTT, Helsinky, Finland, 2005, pp. 63–86.
[34] P. Minnebo, K.F. Nilsson, D. Blagoeva, Tensile, compression and fracture properties of thick-walled ductile cast iron components, J. Mater. Eng. Perform. 16 (2007) 35–45,http://dx.doi.org/10.1007/s11665-006-9005-z.
[35] A. Mourujärvi, K. Widell, T. Saukkonen, H. Hänninen, Influence of chunky graphite on mechanical and fatigue properties of heavy-section cast iron, Fatigue Fract. Eng. Mater. Struct. 32 (2009) 379–390,http://dx.doi.org/10.1111/j.1460-2695.2009. 01337.x.
[36] P. Ferro, P. Lazzarin, F. Berto, Fatigue properties of ductile cast iron containing chunky graphite, Mater. Sci. Eng. A 554 (2012) 122–128,http://dx.doi.org/10. 1016/j.msea.2012.06.024.
[37] P. Ferro, A. Fabrizi, R. Cervo, C. Carollo, Effect of inoculant containing rare earth metals and bismuth on microstructure and mechanical properties of heavy-section near-eutectic ductile iron castings, J. Mater. Process. Technol. 213 (2013) 1601–1608,http://dx.doi.org/10.1016/j.jmatprotec.2013.03.012.
[38] E. Foglio, D. Lusuardi, A. Pola, G.M. La Vecchia, M. Gelfi, Fatigue design of heavy section ductile irons: influence of chunky graphite, Mater. Des. 111 (2016) 353–361,http://dx.doi.org/10.1016/j.matdes.2016.09.002.
[39] T. Borsato, P. Ferro, F. Berto, C. Carollo, Mechanical and fatigue properties of heavy section 3 solution strengthened ferritic ductile iron castings, Adv. Eng. Mater. 18 (2016) 2070–2075,http://dx.doi.org/10.1002/adem.201600256.
[40] J. Lacaze, B. Sundman, An assessment of the Fe-C-Si system, Metall. Mater. Trans. A 22 (1991) 2211–2223,http://dx.doi.org/10.1007/BF02664987.
[41] F. González, Y. Houbaert, A review of ordering phenomena in iron-silicon alloys, Rev. Met. 49 (2013) 178–199,http://dx.doi.org/10.3989/revmetalm.1223.