Commodity Systems Assessment Methodology for V
alue Chain Pr
oblem and Pr
oject Identification
Inter-American Institute for Cooperation on Agriculture
Headquarters. P.O. Box 55-2200
San Jose, Vazquez de Coronado, San Isidro
11101 - Costa Rica
Phone: (+506) 2216 0222 / Fax: (+506) 2216 0233
e-mail: iicahq@iica.int
Website: www.iica.int
CommodIty
SyStemS
ASSeSSment
methodoLoGy
for Value Chain Problem
and Project Identification
Commodity
SyStemS
ASSeSSment
methodology
for Value Chain Problem
and Project Identification
A first step in food loss reduction
Inter-American Institute for Cooperation on Agriculture (IICA), 2016
Commodity Systems Assessment Methodology for Value Chain Problem and Project Identification : A first step in food loss reduction by IICA is published under license Creative Commons
Attribution-ShareAlike 3.0 IGO (CC-BY-SA 3.0 IGO) (http://creativecommons.org/licenses/by-sa/3.0/igo/)
Based on a work at www.iica.int IICA encourages the fair use of this document. Proper citation is requested.
This publication is also available in electronic (PDF) format from the Institute’s Web site: http://www.iica.int Editorial coordination: Karol Alpízar
Translator: Ingrid McLaren Layout: Tatiana Castro Cover design: Tatiana Castro Printed: IICA Print Shop
La Gra, Jerry
Commodity Systems Assessment Methodology for Value Chain Problem and Project Identification : A first step in food loss reduction / Jerry La Gra, Lisa Kitinoja, Karol Alpízar . – San Jose, C.R. : IICA, 2016.
VIII, 246 p.; 21.5 cm x 28 cm ISBN: 978-92-9248-650-1
1. Agricultural development 2. Methodology 3. Sustainable development 4. Product development 5. Development projects 6. Food security 7. Project evaluation I. Kitinoja, Lisa II. Alpízar, Karol III. IICA IV. Title
table of Contents
Acknowledgments ... vi
Foreword ... vii
Chapter 1. Introduction ...1
Chapter 2. Food Losses: Why does reduction matter? ...17
Chapter 3. Introduction to the agricultural value chain ...25
Chapter 4. Priority components for problem analysis ...37
Chapter 5. Application of the agricultural value chain assessment methodology ...67
Chapter 6. Identifying problems and their solutions ...89
Chapter 7. Organizing a workshop ...113
References ...121
Annexs ...125
Annex 1. Checklist of potential problems in an agricultural value chain ...126
Annex 2. Example questionnaires for agricultural value chain components ...140
Annex 3. Example questionnaires for collecting information on public sector institutions, farmers organizations and development projects ...213
list of Figures
Figure 1.1. Sustainable development is derived from an integration of farmer’s
satisfaction and effi cient government support services ... 15
Figure 3.1A. The movement of eggplant (Solanum melongena) from producer to consumer in Ghana ... 27
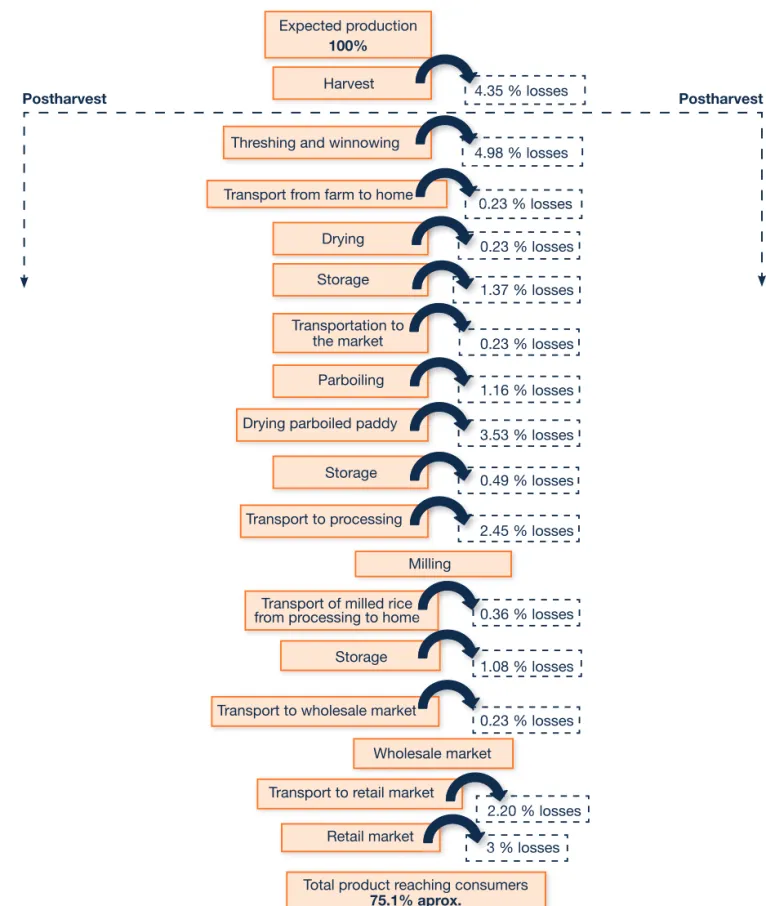
Figure 3.1B. Steps in the rice postharvest system (Oryza sativa) and percent losses at each stage in Nigeria ... 28
Figure 3.1C. Marketing channels for quinoa (Chenopodium quinoa) in Arequipa, Peru ... 29
Figure 3.2. Participants in an agricultural value chain ... 31
Figure 3.3. Causes of pre and postharvest losses at diff erent points in an agricultural value chain ... 33
Figure 3.4. Facilitating services to overcome physical and economic losses at distinct points in an agricultural value chain ... 36
Figure 4.1. Principal components for an agricultural value chain assessment from the food losses perspective ... 40
Figure 5.1. Steps in the production process of most crops ... 72
Figure 6.1. Problem tree showing cause and eff ect relationships in the production and marketing of mango in Uttar Pradesh, India ... 95
Figure 6.2. Objectives tree for the production and marketing of mango in Uttar Pradesh, India ... 97
Figure 6.3. Identifi cation of alternative strategies and projects, based on ... 99
Acknowledgments ...6
Foreword ...7
Chapter 1. Introduction ...9
Chapter 2. Food Losses: Why does reduction matter? ...23
Chapter 3. Introduction to the agricultural value chain ...31
Chapter 4. Priority components for problem analysis ...43
Chapter 5. Application of the agricultural value chain assessment methodology ...73
Chapter 6. Identifying problems and their solutions ...95
Chapter 7. Organizing a workshop ...121
References ...131
Annex 1. Checklist of potential problems in an agricultural value chain ...135
Annex 2. Example questionnaires for agricultural value chain components ...151
Annex 3. Example questionnaires for collecting information on public sector institutions, farmers organizations and development projects ...233
Annex 4. Simplifi ed questions for each component of the agricultural value chain ...241
Annex 5. Summary of the postharvest system of mango in Uttar Pradesh, India ...245
Annex 6. Worksheets for quantifying postharvest losses of leafy vegetables, fruits, roots, tubers and bulbs in agricultural value chains ...247
list of tables
table 5.1. Summary of production process for product X in country Z ... 73
table 5.2. Magnitude of losses caused by pre-harvest factors for product X in country Z ... 74
Table 5.3. Feasibility of reducing the pre-harvest factors causing pre-harvest or postharvest losses ... 75
table 5.4. Flow diagram of steps in a postharvest system ... 78
table 5.5. Identifi cation of participants and their respective actions in the postharvest process for product X in country Z ... 80
table 5.6. Impact of postharvest operations on postharvest losses for product X in country Z ... 81
table 5.7. Feasibility of reducing postharvest losses in technological and economic terms ... 82
table 5.8. Characteristics of demand for product X in country Z ... 85
table 5.9. Assessment of postharvest losses for diff erent crops on farm level in India ... 87
table 6.1. Priority problems in the production of mango in Uttar Pradesh, India ... 93
table 6.2. Expected impact of eff orts to modify an agricultural value chain ... 102
table 6.3. Prioritization of selected actions and projects for improving of mango production in Uttar Pradesh, India ... 104
table 6.4. Cost-benefi ts use of secateurs for eggplant harvest in Jessore, Bangladesh ... 110
Acknowledgments
The authors gratefully acknowledge the contributions to
this document by the following professionals:
Alejandra Bentancur
María Febres
James French
Kurt Manrique
Viviana Palmieri
Ainsworth Riley
Inter-American Institute for Cooperation on Agriculture (IICA)
Hala Chahine
Postharvest Education Foundation (PEF)
The Inter-American Institute for Cooperation on Agriculture played a major role in the revision activities. The Postharvest Education Foundation’s provided new data collection and cost/benefi t worksheets.
Foreword
The global population is expected to reach 9 billion by the year 2050. As a result, food production will need to increase by 60 percent in order to meet future food demand. However, increasing production will not suffi ce if one third of the food produced for human consumption continues to be lost or wasted. The global fi ght against hunger must include efforts to avoid food losses (postharvest losses). Throughout its history, the Inter-American Institute for Cooperation on Agriculture (IICA) has been committed to food and nutritional security in the Americas. One of the Institute’s contributions, as stated in its 2014-2018 Medium-term Plan, is “improving institutional capacity to reduce losses of food and raw materials throughout the agricultural chains.” As a result, IICA, together with Jerry La Gra (a retired IICA specialist) and Lisa Kitinoja, has created a new edition of the manual entitled “Commodity Systems Assessment Methodology for Value Chain Problem and Project Identifi cation,” which features revised and updated content.
The Commodity Systems Assessment Methodology (CSAM) seeks to identify weaknesses throughout agricultural value chains that lead to food losses (postharvest losses) and, at the same time, identify solutions and prepare proposals for improving their effi ciency. Use of this methodology by different stakeholders represents the fi rst step toward reducing food losses.
Professionals from different organizations have dedicated years of research and tests in numerous countries to the development of the methodology presented in this manual. Therefore, we proudly present this methodology for application and further development by its users.
Through this methodology, which focuses on reducing losses of food and raw materials, we hope to contribute to improving the effi ciency and productivity of agricultural value chains, making them more
Chapter
1
Developmental themes and buzz-words that have infl uenced
agricultural development
Agriculture development themes and strategies are defi ned by international banks and development organizations. These themes evolve over time and tend to highlight what banks and development organizations consider to be priority constraints to agriculture development at particular points in time. Most development banks and aid organizations were formed after World War II when there was a strong push for international development and poverty alleviation. In the 1960s, John F. Kennedy created the Peace Corps and the Alliance for Progress to help develop Latin America and the Caribbean. The fi rst Peace Corps Volunteers (PCVs) were trained in community and integrated rural development and many of them worked with small farmers on micro- sized projects. Those projects that responded to the real needs and capabilities of farmers contributed to sustainable development. Failed projects frequently led to small farmers migrating to urban areas where they often became traders.
The Alliance for Progress helped put the green revolution on the fast track and progress was made in increasing production and productivity of food grains through plant breeding and farm mechanization. By the 1970s success of the green revolution was causing gluts in the agricultural value chains which focused international attention on postharvest handling, infrastructure development, and technology transfer. With a worldwide scarcity of agricultural technologists, development banks and USAID invested millions in training young professionals. Institution building was seen as the way forward and agricultural centers for training house extension offi cers cropped up in developing countries. Over time, agricultural support services to small farmers began to improve.
In 1973 E.F. Schumacher published the book ‘Small is Beautiful’ (considered by some to be one of the most infl uential books since the Second World War). Schumacher’s work grew out of his research on village-based economies in England. He argued that the modern economy was unsustainable, that nature’s resistance to pollution was limited, and that government efforts should be concentrated on
sustainable development. He suggested that the “philosophy of materialism” should take second
place to the ideals of justice, harmony and health. Like the philosopher Rene Descartes, Schumacher believed that the best way to understand reality was by breaking it down into smaller and smaller components until the problems and their causes were clearly exposed.
By the 1980s the increased production from the green revolution was triggering bottlenecks in transport, storage and processing centers, causing postharvest losses to soar and governments to defi ne new agricultural sector policies. The demand for more and better market infrastructure grew. Governments had access to grants and soft-loans from donors and development banks but were
professionals many of whom studied abroad and participated in research and the development of innovative research methodologies (e.g. rapid rural appraisals, SWOT analysis, logical framework and problem tree analysis, participatory rural appraisal, value chain analysis and stakeholder analysis, among others.). From the early 1980s, the United States Agency for International Development (USAID), FAO and the International Fund for Agricultural Development (IFAD), among others, expressed their concern with the high levels of postharvest losses occurring in most crops and countries. In 1985 Michael Porter published Competitive Advantage and introduced the
value chain concept.
From the 1970s and well into the 2000s poverty in farming communities continued to impel rural populations to migrate to cities. By 2007 over 50 percent of the world’s population was living in urban areas. While total world population increased over three times (from 2.5 billion in 1950 to more than 7 billion in 2014) the world’s urban population increased over fi ve times (from 746 million in 1950 to 3.9 billion in 2014). To meet the growing demand of urban populations for diverse types of food, marketing and merchandising concepts multiplied, value added activities increased and links in the supply chain grew fewer in number but much larger in terms of volume of food handled. By 2011 donors and researchers were once again becoming increasingly concerned with the high levels of postharvest losses.
Over the past 50 years development themes have focused on green revolution, market infrastructure, institution building, training technical resources, market systems, postharvest loss reduction, and food safety issues, among others. These themes are not always in sync with country needs since each country has its own particular set of circumstances (political, institutional, environmental, social, economic and technological). While development organizations prioritize their particular development themes, countries must deal with problems along the complete agricultural value chain (from planting the seed to consumption of food by consumers). To resolve priority problems in the agricultural value chain both donors and countries use the project format. When projects achieve their objectives they contribute to sustainable development; however, most agricultural development projects fail for multiple reasons.
Over the past 50 years international organizations and governments have spent billions of dollars on agricultural development projects with less than desired results. The improvement in the quality of agricultural projects is essential to bring about sustainable agricultural development.
Why agriculture projects fail: priority pitfalls
In 1973, the Iowa State University Press published a book by William and Elizabeth Paddock titled: “We Don’t Know How: An independent audit of what they call success in foreign assistance.” The Paddocks found that the information provided in dozens of fi nal project reports they examined did not coincide with the real conditions on project sites they visited in seven countries in Central America and Mexico. They concluded that:
“Development professionals do not know how to carry out an effective economic development program, either a big one or a small one.”
“No one knows how – not the U.S. government, not the Rockefeller Foundation, not the international banks and agencies, not the missionaries,”
And, they reached the conclusion that:
“The problem lies in the fact that we do not know that we do not know how. We have no knowledge of our own ignorance.”
When information was being gathered in the 1970s/1980s for the fi rst edition of the Commodity Systems Assessment Methodology (CSAM), every country visited in the Caribbean, Central America and South East Asia had stories to tell about failed multi-million dollar agricultural investment projects. The projects were not just of one type but ranged across the whole agriculture sector; including, over exuberance of governments in promoting “grow more crops” that led to gluts; construction of storage facilities of the wrong type or built in the wrong place; sophisticated information systems designed without clear understanding of intended user’s needs for information; research programs based more on researchers’ interests rather than on farmers’ needs; processing and cold storage plants built in the wrong place or to the wrong scale, and planting of fruit orchards of the wrong variety for the existing market. These are just a small sample of failed efforts found in countries in South East Asia and the Americas.
More recently, a case study of agricultural and rural development projects in one geographical region of Guyana, South America, found that of a total of seventy attempts at agriculture development, fewer than ten showed any degree of success. The others just became a faded memory, leaving little more than lessons learned for the occasional researcher or practitioner of agriculture and rural development.
With the improved access to worldwide information on the Internet, it is now much easier to fi nd reference to failed projects; for example: the International Finance Corporation of the World Bank
their failure. This is an innovative way of educating persons interested in improving the effi ciency of development projects.
The rest of this section identifi es some of the main pitfalls contributing to the failure of agriculture and
rural development projects in today’s world. People engaged in project formulation, implementation and evaluation should be aware of the following types of pitfalls.
Pitfall #1: Underestimating the role of project benefi ciaries.
In any agricultural value chain there are many actors (e.g. farmers, technical and service personnel) and institutions (e.g. ministries, NGOs, donors, banks, corporations) involved. The most important participants are the project benefi ciaries, for obvious reasons. The purpose of most projects is to remove the constraints (and their causes) negatively affecting the particular project’s intended benefi ciaries. Projects tend to fail when they neglect to fully comprehend the conditions, problems, needs and priorities of these benefi ciaries. The problems and causes hindering farmers and other rural groups of people are the most often misunderstood.
Project designers often assume they know what the rural folks need and want, but they frequently blunder. According to the International Project Leadership Academy’s Catalogue of (project) Catastrophes the classic mistake is “failure to identify or engage the stakeholders”. A project is
considered a failure whenever it does not meet the expectations of its stakeholders.
Pitfall #2: The discipline bias trap.
There is no doubt that humans are biased creatures and they tend to be biased in favor of those areas for which they have the most information and knowledge. Economists look for problems and solutions in areas linked to costs and benefi ts; agronomists prioritize problems with soil and plant diseases; entomologists focus on insects; weed specialists highlight weed problems, and food technologists and postharvest specialists zero in on constraints caused by improper sorting, cleaning, packing, cooling, transport and processing.
Specialists, given the task of identifying priority problems in a particular food system, nine times out of ten will come up with problems and solutions in their respective fi elds of expertise. That
extremely diffi cult but the success of the project hinges on this. Effective integration of institutions in a development project requires absolute transparency, centralized management of resources, effective and detailed planning, competent management, and a manager with leadership and communication skills. Most projects lack these characteristics, and consequently they fail. Effective project planning can reduce the danger of falling into this trap.
Pitfall #4: The danger of projects having too short a duration.
Some projects have a life expectancy of just one year but most fall into the range of two to three years. Occasionally a three year project will be extended for an additional few years. What determines the length of a project, in theory, is the period of time it takes to implement the programmed activities and achieve the project’s specifi c objectives and desired results. In practice, the length of most projects is determined by the period of time allowed by the donors. The smaller the amount of money the shorter the length of time allowed by donors for implementation. In reality, projects with greater longevity have a much better chance of success. The reason is that project benefi ciaries are people, or institutions consisting of people, and changing their habits is a long term process. Even the best projects risk failure if forced by donors to end too soon.
Pitfall #5: The money snare: too little or too much.
The “money snare” comes into play when project designers negotiate with donors. The designer may be asked to downscale the project budget (leaving activities unchanged) to coincide with the money available from the donor. Such an action cripples the project from the beginning since there will be insuffi cient money to implement the necessary activities to achieve the desired results.
At the other extreme are donors well into their budget year with too much money on hand to be disbursed wisely in the time remaining; however, rather than roll the funds over to the next year (and, heaven forbid, risk their budget being cut the following year) they hurry to spend the money unwisely on weak projects that have not been properly vetted.
Pitfall #6: The “commodity system methodology is too-complex” trap.
Commodity systems have grown signifi cantly more complex over the past 50 years as a result of a much larger urban population; more products and types of products in the food system; increasing types of packaging materials, new marketing channels (internet and social media, etc.) and expanded storage, processing and transportation networks.commodity studies over a few months; they then waste several years implementing projects that are doomed to fail because they were poorly designed.
Pitfall #7: Overdependence on readily available information.
Consultants on short term contracts, especially international experts unfamiliar with local conditions, do not have time for primary research and often base their conclusions on available documents found in the host country. Since they are unaware of local history, they may base their research on books and reports that are out of date or contain mistaken facts. Analyzing production and marketing value chains using out of date information and/or erroneous can leads consultants reach the wrong conclusions and to make the wrong recommendations in their reports; information that serves as the basis for future development projects. Information on the causes and quantities of postharvest food losses is usually missing and can only be obtained from on the spot research. Inaccuracies in consultant’s reports often lead to weaknesses in project design and ends in project failure.
To minimize the risk of this pitfall, decision makers should compare the total costs (money and quality of information) of hiring consultants with the total costs of using local personnel to research value chains.
Pitfall #8: A chain is only as strong as its weakest link.
Common sense tells us that a necklace with three broken links will not serve its purpose if the jeweler only repairs one or two of the broken links. However, in real life there are thousands of examples of politicians, bureaucrats, professionals, and donors who try to repair just one link in an agricultural value chain that has multiple weak or broken links. They undoubtedly see the broken link they are trying to repair but they don’t see the other weak and broken links in the same chain. They don’t see them because they are looking in the wrong places, or they only have money to fi x one broken link, or they plan to fi x one fi rst and then the others later but never get around to the others because governments change.
Another possibility is that the specialist heading up the project identifi ed, for example, the need for cold storage but failed to diagnose weaknesses at other points in the cool chain. Or perhaps he/ she did not analyze the faults in farmer organization, take note of the high bank interest rates or
project, i.e. one that resolves the stakeholder’s problems. A commodity system is made up of many sub-systems, each of which affects effi ciency. Since there are very few people who understand all the components of any one commodity system it is necessary to use an interdisciplinary or team approach to diagnose the problems and choose the best solutions. An agronomist can deal with the agronomic problems and solutions; the economist may provide technical advice on costs and benefi ts; the sociologist or anthropologist will consider the social concerns and the farm engineer and food technologist will search for technical problems and solutions. Since institutions and politicians play a critical role in project design and implementation it is necessary to have their participation in all stages.
The fi rst step in project formulation is the diagnosis of the main problems of the intended benefi ciaries. Too often this step is bypassed because a political decision maker defi nes a priori what project to formulate. By making such a top-down decision the politician is cutting to the chase, bypassing the diagnostic stage. In so doing he/she is hammering the fi rst nail into the project’s coffi n. Rather than focusing on the intended project benefi ciaries’ priority problems, the politician has inserted his/her personal bias. From that point on the technical team will be formulating a project doomed to failure and team members will not know that they do not know what they are doing.
Pitfall #10: Failure to convert problems and their causes into practical
activities and objectives.
A project is a set of interrelated activities aimed at achieving desired results and specifi c objectives that contribute towards the achievement of a more general development goal. Once the costs of the necessary actions to achieve each activity are quantified the total project cost can be estimated. However, to determine the projects necessary actions the problems and their causes must first be described. This process embraces a logical framework that facilitates the design and formulation of realistic projects from the bottom up. It begins with specific problem identification and ends by stating the projects goal and title. The eight important steps in this bottom up process are identified below:
1. Identify and list problems.
2. Describe causes of main problems.
3. Identify and quantify actions needed to eliminate causes of problems. 4. Defi ne projects main activities to achieve desired results.
When donors, government institutions, NGOs, consultants, or other organizations assume they know what the problem is and dictate same to the project design team the bottom-up logical framework is converted into the traditional top-down decision making approach. The end result is usually a failed project. The project will fail because the causes of the real problems were not clearly defi ned and participation of the intended project benefi ciaries was marginalized.
The easiest way to avoid this pitfall is by ensuring that intended benefi ciaries are integrated into the process that identifi es problems and describes their causes. The value chain problem and project identifi cation methodology described in this document was created for that purpose.
Pitfall #11: Misjudging the importance of quality, place, timeliness and
price is costly.
The purpose of production, postharvest and marketing systems (chains and channels) is to deliver a specifi ed quantity of product of a desired quality to a specifi c place at a specifi c time for a competitive price paid by the buyer. At each point (link) in the system (chain) the product is affected by physical conditions, temperature, packing materials, means of transport and, most importantly, decisions made by the different product handlers (farmers, technicians, workers, intermediaries, and others). Every decision made by every participant at each link in the chain will impact upon one or more of the following: product quality, place and time of delivery and price of the product. When too many wrong decisions are made by decision makers in any agricultural value chain, postharvest losses increase and product quality and value decrease. During project implementation, decision makers often focus on increasing production, adding value or reducing postharvest losses while overlooking critical components such as policy decisions and food health issues and standards (e.g. certifi cation of afl atoxin levels and quality control measures) that can lead to failed projects.
Pitfall #12: The lack of transparency is the mother of all pitfalls.
In a recent research paper the International Monetary Fund estimates that 2% of global GDP is now annually paid in bribes. The document argues that strategies to fi ght corruption require transparency, a clear legal framework and a credible threat of prosecution. The paper suggests that public sector corruption siphons off USD1.5 to USD 2 trillion annually from the global economy and much more in stunted economic growth, lost tax revenues and sustained poverty (IMF 2016).
1. Failure to ask or answer the question: What are we really trying to achieve?
2. Failure to establish a decision making structure appropriate to project needs.
3. Failure to identify or wholly engage the stakeholders.
4. Failure to establish eff ective communication links between participants in value chain.
5. Underestimation of the complexity of the project.
6. making key decisions without identifying or considering alternatives.
7. Failure to provide suffi cient training of benefi ciaries in project management.
8. Failure to think ahead and foresee and address potential problems.
9. Allowing a pet idea to become the chosen solution without considering options.
10. team members developing individual components before thinking through total system.
Every participant (institution, ministry, donor, bank, NGO, farmer, intermediary, technician, university, etc.) involved in a commodity system can cause a project to fail or help it to succeed. Every project has its own package of resources, participants and issues that contribute to success or failure. Those projects that use a holistic common-sense approach, involve key participants in decision making, and have adequate resources, longevity and a good communication system, will have a good chance of success; those that do not will have an excellent chance of failure.
A tale of two projects
close coordination with international universities, government institutions, NGOs and Amerindian Indigenous communities.
The fi rst three years of the butterfl y project were funded by the Darwin Initiative and Warwich University. The fourth and fi nal year was funded by the British High Commission (BHC) and World Wildlife Fund. The fi ve year peanut project was extended for seven years converting it into a 12 year project. Funding for the peanut project was obtained from the USAID Peanut CRSP program, the US Embassy and the Canada Fund. Each project cost was in the vicinity of USD 600,000; all were grant funded, with the exception of in-kind contributions from participating villages.
For the butterfl y project the expected results were:
1. Increased awareness and knowledge of butterfl ies in Iwokrama forest. 2. Scientists with knowledge on butterfl y densities, habits and economic value. 3. Village adults and youths educated on importance of butterfl ies in biodiversity. 4. Butterfl y hub established at Fairview producing and exporting butterfl ies.
5. Sustainable jobs and incomes in the butterfl y trade benefi ting 5,000 people in 16 villages. For the peanut project the expected results were:
1. Field trials conducted and best seeding rates and peanut varieties determined. 2. Nutrient needs for peanuts in diverse soil types determined.
3. Small-scale labor-saving devices and machinery obtained and demonstrated. 4. Village farmers trained in peanut production and postharvest technologies. 5. Most favorable economic and social applications for peanuts determined. 6. Seven cottage industries processing and marketing peanut products.
7. Cottage industries supplying school students with daily snacks on a sustainable basis. 8. Seventy women trained in business management and employed in school snack program. 9. At least 35 farmers selling peanuts, cassava and fruit on sustained basis.
The butterfl y project achieved its fi rst three expected results to a signifi cant extent. Major outcomes from this initiative include the award of advanced degrees in biology to two Guyanese university
Marketing tests were not made until after the butterfl y house was operational. It was only at this point that the managers realized that the fi ve-day marketing window they had to get the pupas from butterfl y house to international markets was insuffi cient, given local road and air service conditions. It was then realized that the butterfl y house should have been located closer to an international airport. Following the closing of the project the butterfl y house was abandoned and has since been taken over by the encroaching jungle. The butterfl y house was the heart of this project and when it died so did the project. The project failed to create one job lasting beyond the end of the project in 2010. The main effect on the 5,000 intended stakeholders in the 16 Amerindian villages was one of frustration from seeing the failure of the project they had so fervently supported.
The peanut project achieved the fi rst fi ve expected results listed above by the end of the fi rst four years; productivity per acre jumped by 50% and annual peanut production increased by 300%, to 1.4 million pounds. However, farmer celebration of the bumper crop lasted only as long as it took them to learn there was a glut of peanuts in the main market in Georgetown and their peanuts could not compete with cheaper imported peanuts. Even though a market study had been carried out, it did not identify a signifi cant weakness in government statistics (two million pounds of contraband peanuts were being smuggled into Guyana annually along the Surinam border to avoid a 7% import duty).
In the fi fth year of the peanut project the team managers modifi ed the project to focus on adding value to peanuts for sales in local markets. In 2005 seven cottage industries were established and staff was trained to manufacture peanut butter for the school snack program. By 2007 all the cottage industries were employing personnel and operating at a profi t. The remaining four expected results listed above were achieved. When the project ended at the end of 2012, 4,000 nursery and primary school students in 41 villages were receiving daily snacks consisting of a peanut butter and cassava sandwich and a glass of fresh fruit juice. More than one hundred and forty jobs had been created for village women and more than 400 farmers were selling peanuts, cassava and fruit to the school snack program on a small but signifi cant scale. Total income received annually by the women employees and the farmers exceeded USD 137,000 approximately. Management of the school snack program was turned over to local government in January 2013 and as of July 2016 the program has expanded further; providing daily snacks to 4,500 children in 46 villages.
What were the factors that allowed the peanut project to achieve its desired results and what prevented the butterfl y project from reaching its desired results?
Peanut project ideas developed from regional discussions with farmers over a two year period prior to project commencement and farmers participated in all decision making. A participatory approach was applied in project proposal development.
The peanut team was interdisciplinary from its beginning, including planners, farmers, agriculturists, sociologists, economists and local coordinators, representing more than ten disciplines. The butterfl y technical team consisted of mainly biologists and local coordinators, and thus it had a built-in discipline bias. The peanut project researched the whole production, processing and marketing system from its inception. The butterfl y research was focused almost entirely on the butterfl y production system.
While marketing was a main constraint for both projects there was a signifi cant difference in how the two projects dealt with their problems. For the butterfl y project the marketing constraints were discovered too late, when fi nancial resources were nearly depleted. The problems were too complex to deal with over the short time remaining in the project. The project manager declared the project a success in the fi nal report, specifying that the actual production and marketing of butterfl ies would be the responsibility of the respective villages. When the peanut project discovered that peanuts could not compete pricewise in the coastal market of Guyana the strategy was switched to one of adding value and marketing peanut butter in the hinterland; to the school feeding program, the army, loggers and miners. This ability to change project strategy mid-way through the project turned potential failure of the peanut project into success.
The peanut project used the CSAM methodology to generate information on the full peanut production, postharvest and marketing system in Guyana and worked with village farmers and processors in formulating the project from the bottom up. The butterfl y project failed because its objective was never properly scrutinized with intended stakeholders and institutional partners prior to commencement. The peanut project used a commodity systems approach in problem analysis and spread its investment over a long period of time (12 years) during which it was able to achieve its specifi c objectives and most of its desired results. The butterfl y project, on the other hand, used a piecemeal approach, with a discipline bias, and was unable to achieve its main outputs. It spent a relatively large amount of money in the fi rst three years and ended the project with poor results in the fourth year. Whereas the peanut project created over 100 jobs, established seven sustainable cottage industries and helped institutionalize a school feeding program, the butterfl y project ended in failure since it did not create even a single job for its targeted stakeholders (5,000 people in 16 villages).
and implementation, the desired project results are achieved and these contribute towards sustainable development. When wrong decisions are made desired project results are not achieved and the project fails, contributing to unsustainable development. Making the right decisions requires access to accurate and up- to- date information. There is a growing consensus that too many agricultural development projects fail. This implies a shortage of accurate decision-making information and weakness in method. It stands to reason that the quality of agriculture development projects could be signifi cantly improved through two specifi c actions:
Action #1: Ensure that participants in any agriculture development project
want the same thing.
Participants in an agriculture development project include the intended benefi ciaries, those providing the funding, the key decision makers and members of the interdisciplinary project design team. Therefore it is important to know what each team member (or sub-group) expects or wants from the project. Implementation of the project will be made much easier if all participants are motivated and moving towards the same objectives.
The fi rst questions that should be asked when starting
a project are:
What do the benefi ciaries/stakeholders want? What do the service providers want?
What do government institutions and politicians want? What do the donors, ngos and volunteers want?
If all participants want similar or complementary things from the project there is scope for formulating and implementing a quality project that will contribute to sustainable development. If not, the scope of the project must be reconsidered and redesigned.
impacting value chains. This is not surprising considering the large number of participants engaged in decision making at each component of every product system. It is easy to conclude that things that can and do go wrong in an agricultural value chain are infi nite in number. Given such a situation it is not feasible to try to develop an effi cient agricultural value chain by trial and error methods or top-down decision making. Agriculture project failure can be linked to technical, social, economic, political, institutional and environmental causes. Consequently, it is imperative that research generate accurate decision making information on these six crucial areas. Herein lies the utility of the Commodity Systems Assessment Methodology (CSAM). CSAM generates the baseline information and knowledge required to understand value chains and crucial for the formulation of quality projects.
Farmers, the main benefi ciaries of agricultural projects, tend to be temporarily satisfi ed when they have access to appropriate technologies, adequate economic returns from product sales, and satisfactory social benefi ts (Figure 1a). However, long term farmer satisfaction requires integrated development which entails adequate environmental safeguards, effi cient institutionalized services and reliable political support (Figure 1b). The door to sustainable rural development opens only after these two sets of conditions have been met.
Figure 1.1. Sustainable development is derived from an integration of farmer’s satisfaction
and effi cient government support services
Sustainable development Integrated devolopment Environmental controls Institutional services Political support Temporary satisfaction Social benefi ts Appropiate technology Economic returns
A little bit about food systems
Food systems begin with pre-production planning and continue from production through postharvest handling to marketing and fi nal consumption. At each step in the chain a variety of persons and institutions make decisions that affect the quantity, quality and value of the product. When decision makers implement agricultural development projects without being aware of the reality at each step in the product chain, they end up with a partial solution that soon becomes a failed project. CSAM provides diverse formats that researchers can use to document conditions at each component of a particular agricultural value chain, thereby generating quality information that decision makers can use in the formulation of effi cient development projects. Quality information and effective and effi cient project implementation are necessary for sustainable agricultural development.
Food losses:
Why does reduction
matter?
Chapter
This document refers to “food losses” as the reduction in the quality and quantity of food intended for human consumption along the agricultural value chain from harvest prior to the consumption phase which are namely production, postharvest handling, storage, processing, marketing and distribution stages (HLPE 2014; Gustavsson et al. 2011).
Around one third of the food produced (some 1.3 billion tons) for human consumption is not eaten. It has been estimated that halving such losses by 2050 would cover a quarter of the gap in food needs worldwide (Lipinski et al. 2013). The problem arises in determining which of the losses can be feasibly reduced.
The distribution of food losses along agricultural value chains varies by region and product.
In mid/high income countries, the highest percentage of losses occurs at the level of distribution and consumption, while in low-income countries losses are higher at the pre-harvest, harvest and postharvest stages (HLPE 2014).
Food losses negatively impact the sustainability of agricultural value chains by causing physical and economic losses, reducing returns on investments, and diminishing food availability and quality (HLPE 2014). According to Kummu et al. (2012) one billion additional people could be fed if losses in food crops were halved.
Countries are also affected by natural resources being used in food production and then lost along the agricultural value chains; for instance food loss is associated with about 173 million cubic meters of water consumption per year, representing 24 percent of all water used in agriculture. The amount of land used to grow food that becomes lost has been estimated at 198 million hectares per year, an area roughly the size of Mexico, together with 26 to 28 million tons of fertilizers (Lipinski
et al. 2013).
According to FAO (2013), global food losses are responsible for approximately 3,300 million metric tons of emissions of greenhouse gases (equivalent carbon dioxide). If this amount of food was lost from a country, it would be among the three largest emitters of greenhouse gases (just behind the United States and China).
Reducing food losses along the agricultural value chains would strengthen access and increase availability of food, generate greater exportable surpluses, and improve effi ciency in the use of countries’ natural resources.
Food security involves meeting four interrelated conditions or dimensions: a) the availability or
existence of suffi cient quantities of food of appropriate quality for all individuals; b) access, understood
as access by individuals to adequate resources and entitlements for acquiring appropriate and nutritious food consistent with their culture; c) conditions that ensure the biological use of food to achieve a
state of nutritional well-being where physiological needs are met ; and d) stability in both availability
and access to adequate food at all times.
By 2015, most countries had met the target set by the Millennium Development Goal to “halve the proportion of hungry people”. However, progress has been uneven across countries and regions and some 795 million people still suffer from hunger and nearly one billion still live in extreme poverty. Extreme poverty is concentrated disproportionately in rural areas, and dependence by the poor on agriculture for their livelihoods and the high proportion of their spending on food, makes agriculture vital for the achievement of their food security (FAO et al. 2015).
Global agriculture is challenged to increase production by 70% by 2050 and improve accessibility to meet the food demand of a population estimated to be 9 billion people for that year. To meet this challenge, it will be necessary to achieve a more effi cient, but environmentally sustainable agricultural production, capable of ensuring availability and access to safe and nutritious food for the entire world population.
As indicated, food produced but not eaten has environmental and economic costs. Food that is lost represents a missed opportunity to improve food and nutrition security for people and mitigate the environmental impacts generated by the agricultural sector.
In 2015, the United Nations proposed the Sustainable Development Goals which were adopted by world leaders. These seek to end poverty in all its forms, reduce inequality, combat climate change and promote environmental protection. The Objective 12: “Ensure sustainable consumption and production patterns” relates to food loss and waste and has as one of its goals: “By 2030, to halve per capita global food waste at the retail and consumer levels and reduce food losses along production and supply chains, including postharvest losses” (United Nations 2016).
Purpose and origin of this manual
This manual concentrates on steps one and two; both are interdependent, effective solutions that cannot be prepared without a clear understanding of the problem(s).
While numerous books and training courses concentrate on project identifi cation, formulation, evaluation, and monitoring, relatively little information is available on problem analysis, particularly from the perspective of agricultural value chains.
During university training, students are taught to identify problems using a comprehensive and interdisciplinary approach. However, when students become professionals, they usually fi nd themselves in very narrow positions within public or private sector institutions. Here, they tend to concentrate on very specifi c problems, making decisions with the limited information at hand. Even within many developmental organizations, there is often a lack of interdisciplinary communication and coordination, leading to projects which fail or achieve only partial solutions.
Most persons involved in project identifi cation and formulation do not have the time, methodology or resources to organize and implement a proper diagnosis of problems, a process which could take several months. Consequently, problem and project identifi cation becomes dependent on literature and secondary data which may lack detail and accuracy.
The key to problem solution is proper problem identifi cation
Using the step-by-step methodology and instruments presented in this manual, professionals will be able to gather accurate information avoiding some of the pitfalls described earlier. Working together as an interdisciplinary team, they will be able to systematically organize their combined knowledge into a comprehensive overview of a particular agricultural value chain. This will produce the necessary information for quality problem and project identifi cation, thereby improving the chances for success of the respective development projects. In this way, local participants will play a more direct role in the determination of those priority projects which get submitted to funding agencies.
A basic assumption made throughout this manual is that human resources are available in developing countries who, when presented with good baseline information on an agricultural value chain, will be able to identify projects and establish realistic priorities. The more complete and accurate the information base, the more likely the right decisions will be made to overcome the identifi ed problems.
Application of this manual
This manual can be used in a workshop environment to train professionals, farmers, and others, in the agricultural value chain approach, either from a theoretical point of view, or as an applied, in-service, case study form of training. In the fi rst instance the trainees may be of the same or different disciplines. When the case study approach is used, the trainees should include persons with expertise in multiple disciplines, e.g. economics, agronomy, social sciences, food technology, postharvest, and marketing. The CSAM methodology will prove useful to planning bodies, ministries of agriculture, marketing boards, corporations, research institutes, and other national institutions seeking systematic improvement within existing agricultural value chains. At the regional or national level, the methodology will prove valuable in the identifi cation and formulaton of agricultural development projects. It will be of particular value in the execution of rapid appraisal exercises, using interdisciplinary teams of national specialists. A systematic and interdisciplinary application of this methodology will allow a rapid appraisal of an agricultural value chain. It will facilitate the identifi cation of priority problems, causes of problems and alterative project ideas, and permit the ordering of solutions into a development strategy and time frame. Finally, for the student, this manual will promote a better understanding of the agricultural value chains and the interrelationships between the diverse components and participants. It should serve as a reference document for technical schools and universities teaching agricultural economics, food technology, postharvest handling, agronomy, sociology, and other subjects related to agricultural development.
An important feature of this methodology is that it permits an analysis of the whole agricultural value chain as well as certain components of interest, thereby facilitating the identifi cation
and prioritization of problems throughout the chain. This leads to the development of more realistic solutions to priority problems. The methodology brings many concepts, instruments and techniques together in one document and presents them as an integrated whole.
origin of the methodology
The methodology presented in this manual draws upon the work of a great number of specialists and was developed over several years. The original idea for the methodology stems from a study executed in Haiti describing the production and marketing system for beans (Phaseolus vulgaris), using an anthropological
In analyzing the alternative approaches used by anthropologists, food technologists and agricultural economists, it became apparent that none of the three approaches provided a complete picture of an agricultural value chain. However, the integration of the three approaches yielded a comprehensive overview, facilitating problem and project identifi cation.
During the 1970s and 1980s, development planners contributed valuable tools for project identification and design. However, by the mid-1980’s, a paradoxical situation seemed to exist and continues today: while methodological instruments were available to study and evaluate food systems, while techniques and methods for project identification and formulation were commonly known and available at the national level, and while competent professionals were available in developing countries, a high percentage of agricultural development projects continued to yield poor results.
Analyses at the country level indicated that one of the reasons for this situation was the lack of integration and coordination among the diverse institutions involved in the development process, and among specialists in the planning and execution of their work programs.
Review of experiences in developing countries showed that many research, training, infrastructure, information, agriculture and other types of projects ended without producing the desired results. Some examples:
• Many governments established information systems without a clear defi nition of users’ needs for information. The raw data collected often went unused and most systems were abandoned when external funding ended.
• Ministries of Agriculture often implement projects to increase production or productivity before markets are identifi ed. This frequently results in higher production costs and lower returns to farmers- the result of increased output, gluts and a corresponding drop in market price.
• Universities and research centers often design and implement research programs without a clear understanding of farmers’ problems and needs. This leads to scarce resources being allocated to problems of scientifi c interest but of low priority to farmers.
An interinstitutional eff ort
From this experience it was concluded that loss assessments should begin with a comprehensive overview of the agricultural value chain. It was further concluded that due to the high cost in time and resources required to accurately quantify losses, such exercises should only be conducted after an initial assessment of an agricultural value chain or when quantitative data is required to evaluate the economic feasibility of introducing changes. From that point on, IICA and PIP decided to concentrate on developing an approach to evaluating agricultural value chains using existing instruments and methods.
In 1985, the ASEAN Food Handling Bureau (AFHB) invited IICA to participate in a workshop on postharvest loss assessment in Manila, Philippines. IICA presented a comprehensive approach for studying systems and identifying those points in the system where food losses were greatest (ASEAN Food Handling Bureau 1985).
In an attempt to develop a comprehensive methodology for analyzing systems, from a postharvest point of view, PIP, AFHB and IICA formed an interdisciplinary team in 1986 to visit ASEAN countries and identify common problems and needs of public and private sector institutions dealing with postharvest problems. As a result of numerous consultations with professionals in fi ve countries, the fi rst version of this manual was prepared (La Gra et al. 1987).
In 1987, the University of California at Davis, and PIP at the University of Idaho, with support from USAID, FAO and IICA, combined forces in the organization of a training course for 20 technicians from the Eastern Caribbean. The training concentrated on methods for reducing postharvest losses in perishables, based on an agricultural value chain approach (PIP/UCDAVIS 1987).
The fi rst edition of this manual was compiled in 1988 in draft form. It was fi eld tested in Malaysia at the Malaysian Agricultural Research and Development Institute (MARDI), under the joint sponsorship of MARDI, AFHB, PIP and IICA. During the two week in-service workshop, 24 MARDI professionals, covering 12 disciplines, applied the methodology step-by-step, as presented in Chapter 5 of this manual.
During the 1990s the methodology was utilized by Extension Systems International in a variety of USAID and the US Department of Agriculture (USDA) funded projects in Egypt, India and Indonesia. In 2005 parts of the fi rst edition of this manual were translated into Arabic for systematic training
Introduction to
the agricultural
value chain
Chapter
Any agricultural value chain begins with decisions of what to produce and in what quantities. It continues through to the point where the product is consumed. Between these two points, many disciplines, including economics, sociology, political science, health, engineering, agronomy, entomology, pathology, planning, food science, and others, interact to contribute to the understanding and functioning of the system. The functioning and structure of the agrifood systems can be completely understood only if one spends the time to analyze them from the points of view of many disciplines. The methodology presented in this manual, therefore, emphasizes the necessity to include experts from a number of disciplines to ensure as complete an understanding as possible.
The fi elds of social science, food technology and economics have contributed valuable methods and instruments for analyzing food systems. Given each discipline’s particular biases and different objectives, one should not be surprised that their respective research techniques and methods of data presentation vary. For example, when presenting a fl ow diagram of a marketing channel for a particular product, the social scientist is likely to emphasize the human element (Figure 3.1A), food technologists, the technical aspect (Figure 3.1B), and the economist, the institutional side (Figure 3.1C). None of these methods is necessarily more correct than the others; each is simply a means for facilitating the comprehension of a complex system from a particular perspective.
The three distinct methods, when treated individually, tend to produce a partial view of an agricultural system. However, when the three disciplines are combined for the study of a specifi c agricultural value chain, they provide a more complete understanding of the system, including better awareness of problems and better clarity of the roles of the diverse participants in the chain.
Researchers, regardless of their discipline, are normally under fi nancial and time constraints and must choose between being very exact, about very little (the case study approach), or taking a broad overview of the subject of interest.
Researchers in all disciplines tend to ask the same basic questions: Who? What? How? When? Where? Why? and How much?
However, the interpretations of the answers to these questions tend to vary with the discipline. For example, in analyzing why farmers do not apply best cultural practices, agronomists and economists may emphasize the lack of farmer knowledge or the lack of proper inputs while the social scientist may point to the farmers’ tendency to minimize risk.
Figure 3.1A. The movement of eggplant (Solanum melongena) from producer to consumer
in Ghana
Small scale farmers
Primary wholesaler
Secondary wholesaler
Grocery shop & Supermarket Retailer + roadside sellers Export (Burkina Faso, Togo) Processing Farm reject Households Hotels Traditional restaurants
Figure 3.1B. Steps in the rice postharvest system (Oryza sativa) and percent losses at each
step in Nigeria
Expected production
100%
Harvest
Postharvest 4.35 % losses Postharvest
4.98 % losses 0.23 % losses 0.23 % losses 0.23 % losses 1.16 % losses 3.53 % losses 0.49 % losses 2.45 % losses 0.36 % losses 1.08 % losses 0.23 % losses 2.20 % losses 1.37 % losses Threshing and winnowing
Transport from farm to home Drying Storage Transportation to the market Parboiling Storage
Transport of milled rice from processing to home Transport to processing
Storage Transport to wholesale market
Transport to retail market
Wholesale market Milling Drying parboiled paddy
4.98 % losses 4.98 % losses 0.23 % losses 0.23 % losses 0.23 % losses 0.23 % losses 1.37 % losses 1.37 % losses 0.36 % losses 0.36 % losses from processing to home
from processing to home from processing to home
1.08 % losses 1.08 % losses 0.23 % losses 0.23 % losses 2.20 % losses 2.20 % losses 2.20 % losses 2.20 % losses 4.35 % losses 4.35 % losses
Figure 3.1C. Marketing channels for quinoa (Chenopodium quinoa) in Arequipa, Peru STOCKPILING PROCESSING MARKETING CONSUMPTION 44.94% 0.82% 0.25%
Retail stockpiler Puno
Retailer 0.21% 0.48% Lima Agro-industry Consumer 0.58% Lima Agro-industry 0.07% Fairs 0.01%
Wholesale stockpiler Puno 0.37%
Stockpiler Arequipa 0.90%
Direct export 41.55%
Export companies 0.43%
Arequipa Wholesaler 14.35%
Local regional market 16.16%
Lima market 1.54% Extra-regional market 1.44% Arequipa processor 45.43% 0.05% 0.11% 0.21% 0.01% 0.36% 0.45% 13.41% 0.08% 13.76% 0.23% 0.13% 0.45% 41.13% 0.48% 0.07% 0.07% 0.41% 0.58% 1.91% 1.44% 0.96% 0.49% 0.09% 16 15 17 19 18 14 13 12 11 10 20 9 8 7 6 2 5 4 3
Often mistakes are due to decision making without adequate situational and problem analysis. In other cases, the cause of the problem may be traced to a particular disciplinary bias, or too little participation from key disciplines or national politics.
While nearly all professionals and decision makers agree on the need for closer cooperation, effective coordination is more the exception rather than the rule. This may be due simply to a shortage of time or it may be as a result of interinstitutional jealousy and competition among professionals. Coordination does occur, however, when each participant has something to gain by cooperating. By using an agricultural value chain approach to problem analysis, participants can be shown that interdisciplinary exchange and coordination will produce better results, thus benefi tting the nation and all those associated with a successful project.
Agricultural value chain
From a socio-economic standpoint, an agricultural value chain can be interpreted as a system that brings together socially and economically interrelated actors who participate in coordinated activities that add value to a particular good or service, from its production until it reaches the consumer. Such a system includes suppliers of goods and services, processing, manufacturing, transportation, logistics and other support services, such as fi nancing and government policies. This value-adding connection does not necessarily represent a fair or linear process (Garcia - Winder et al. 2009).
At the same time, the agricultural value chain may also be interpreted from an analytical perspective for understanding relations between actors in agriculture and rural areas, from input supply and primary production to fi nal delivery of the products to the consumer, where relations established may be contractual or commercial (Garcia - Winder et al. 2009).
In Figure 3.2, the agricultural value chain is visualized as a circle, extending from production planning (decision making) through production, harvest and distribution to consumers, thereby setting the stage for the next cycle of planning, production, etc. The components depicted in Figure 3.2 are applicable, in general, to all food crops, as well as livestock and fi sheries. All of these stages are interdependent since the decisions and actions at one point will affect the quantity, quality and price of the agricultural product at subsequent points.
For all agricultural products there exists a period of information analysis and planning; a stage of preparation for production (pre-production); a period of production; a time for harvest; usually several occasions for transportation; stages where assembly, packaging or selection occurs; one or several periods of short or longer term storage; and a stage where the agricultural product is distributed to the
available technology, infrastructure, labor supply, distance to markets, market demand, and others. A systematic approach to evaluating the diverse components of an agricultural value chain is presented in Chapter 4.
Figure 3.2. Participants in an agricultural value chain
ASSEMBLY/SORTING/PACKING - Intermediaries - Farmer Organizations - Farm Families - Exporters - Farmers tRAnSPoRt - Farmers - Truckers - Farmer Organizations - Intermediaries tRAnSPoRt - Cooperatives - Marketing Boards/Corporations - Truckers - Farmers StoRAge - Marketing Boards/ Corporations - Farmer Organizations - Wholesalers - Retailers - Warehousemen PRoCeSSing - Entrepreneurs - Farmer Organizations PRodUCtion - Farmers - Laborers - Farm Families - Extensionists - Bankers hARVeSt - Farmer Organizations - Intermediaries - Farmers - Extensionists - Laborers - Family Laborers PRe-PRodUCtion
Participants in an agricultural value chain
In addition to identifying key points in an agricultural value chain, Figure 3.2 also identifi es the different types of participants functioning at the diverse points in most agricultural value chains. These include private sector individuals such as farmers, truckers, and marketing intermediaries, and institutions such as ministries of agriculture, farmers’ organizations, and marketing boards that belong to the public sector. Types of participants vary with the agricultural product, country and particular circumstances. While all participants make decisions which may affect the quality, quantity and price of a particular product in an agricultural value chain, there is a basic difference between the two groups. Decisions made by private sector participants are normally determined by that person’s desire to secure economic gain. Decisions made by public sector participants are guided by a number of non-economic motives. In analyzing a particular agricultural value chain, it is very important to obtain a clear understanding of the diverse participants in the system and their respective roles and motivation. For example, decisions made by politicians to construct infrastructure to satisfy a local constituency may increase the costs of operation and food losses. Ideally, the higher costs (lower economic effi ciency) can be justifi ed by social or other remuneration, but often this is not the case.
A private sector, profi t-motivated decision can also contribute to ineffi ciencies in the total system. For example, decisions made by farmers or intermediaries to minimize investments in packaging materials may maximize their individual returns but result in increased postharvest losses at later points in the food system.
Causes of food losses
Some of the causes of pre and postharvest losses at different points in the agricultural value chain are
indicated in Figure 3.3. While possible causes of food losses are infi nite in number, some are more common than others.
Food losses may be the result of negative climatic conditions, poor physical facilities, technology used, cultural practices, high costs of farm inputs, low market prices, low motivation of human resources and an infi nite number of other causes. It should be noted that these conditions may be specifi c to a region and time of year. When reporting the results of a study, this detail should be noted to determine if the results can be extrapolated to include neighboring territories.
Figure 3.3. Causes of pre and postharvest losses at diff erent points in an agricultural value
chain
ASSEMBLY/SORTING/PACKING - Improper postharvest handling - Delays
- Defi cient engineering, design or fi nishing of packing material - Physical, mechanical, and
physio-logical damage - Lack of infrastructure - Inappropriate technologies tRAnSPoRt
- Environmental conditions - Physical & mechanical damage - Physiological damage tRAnSPoRt - Delays - Poor coordination - Poor technology StoRAge - Physical, mechanical, or physiological damage caused by:
rough handling, bacteria, fungus, mildew, insects, or rodents and environment PRoCeSSing - Physical, mechanical, or physiological damage - Ineffi ciencies - Poorly trained workers - Inappropriate
technologies PRodUCtion
- Poor cultural practices - Pest and disease
damage - Ecological & soil
conditions - Poor water management - Physiological damage - Mechanical damage hARVeSt
- Wrong time for harvest - Climatic damage - Physiological damage - Mechanical damage
PRe-PRodUCtion - Lack of information - Poor management ability - Poor roads