Faculté d’administration
Stratégies gagnantes aux enchères à un sou
par
Philippe Giguère-Duval
Mémoire présenté à la Faculté d’administration
en vue de l’obtention du grade de
Maitre en Économie
Maîtrise en Économie
4 septembre 2015
c
Faculté d’administration
Stratégies gagnantes aux enchères à un sou Philippe Giguère-Duval
a été évalué par un jury composé des personnes suivantes :
Marcelin Joanis, Directeur de recherche
Patrick Richard, Codirecteur de recherche
Jean-François Rouillard, Examinateur externe
ABSTRACT
I empirically analyze the behavior of the players in an online auction format, a penny auction in which each bid represents a cost to the player and increases the price of the auctioned item by a small increment above the price at the time of the bid. I examine the behavior of the players using a dataset containing 86,000 auctions and 12,8 million individual bids, provided by a penny-auction website. I develop a methodology to identify the strategies that are associated with higher profit and I expand the list of potential strategies to all observable bidding charac-teristics. My methodology identifies all the winning strategies already mentioned in the literature on penny auctions, but also strategies for which an intuition was provided, but no formal proof. I find that bidding on packages of tokens is the strategy that is the most highly correlated with the profit of the players. I also find that bidding on items of low value and bidding quickly after the timer is reset is associated with a higher profit. On the other side, playing standard auctions, bid-ding on high-value or electronic items, and bidbid-ding just before the timer expires are associated with lower profit. Using the winning strategies identified by my me-thodology, I then estimate the impact of a player’s experience on the use of these strategies with a mixed model to account for the heterogeneity of the players. The estimation demonstrates that players, on average, learned to use better strategies as they played more and more auctions. The biggest winners appeared to have a better understanding of the winning strategies when they started playing compared to the rest of the sample. I support this conclusion using the individual parameters provided by the mixed model.
RÉSUMÉ
J’analyse empiriquement le comportement des joueurs dans un format d’en-chères en ligne, une enchère à un sou, dans laquelle chaque mise représente un coût pour le joueur et augmente le prix de l’article vendu aux enchères par un petit montant. J’étudie le comportement des joueurs en utilisant une base de don-nées contenant 86,000 ventes aux enchères et 12,8 millions de mises. La base de données a été fournie par un site d’enchères à un sou. Je développe une métho-dologie pour identifier les stratégies qui sont associées à des profits plus élevés et j’élargis la liste des stratégies potentielles à toutes les caractéristiques de mises observables. Ma méthodologie identifie toutes les stratégies gagnantes déjà men-tionnées dans la littérature sur les enchères à un sou, mais aussi des stratégies pour lesquelles une intuition a été fournie, mais aucune preuve formelle. Je trouve que miser sur les ensembles de jetons est la stratégie qui est la plus fortement cor-rélée avec le profit des joueurs. Je trouve aussi que les mises sur des articles de faible valeur et des mises faite rapidement après que la minuterie soit remise à zéro est associée à un profit plus élevé. À l’opposé, jouer des enchères de type standard, miser sur des articles de valeur élevé ou des articles électroniques, et miser juste avant l’expiration de la minuterie sont des stratégies associées avec un profit plus faible. J’utilise ensuite les stratégies gagnantes identifiées par ma méthodologie pour estimer l’impact de l’expérience d’un joueur sur l’utilisation de ces stratégies. Pour ce faire, j’utilise un modèle mixte afin de tenir compte de l’hétérogénéité des joueurs. L’estimation montre qu’en moyenne, plus le nombre d’enchères auquel les joueurs ont participé augmentait, plus les joueurs ont utilisé des stratégies associées avec des profits plus élevés. J’utilise ensuite les effets in-dividuels fournis par le modèle mixte pour démontrer que les joueurs qui ont les bénéfices les plus élevés semblaient avoir une meilleure compréhension des stra-tégies gagnantes lorsqu’ils ont commencé à jouer comparativement au reste des joueurs.
TABLE OF CONTENTS
INTRODUCTION . . . 7
BACKGROUND . . . 10
1. HISTORY AND AUCTION RULES . . . 10
2. RELEVANT LITERATURE . . . 12
METHODS . . . 19
1. SOURCE OF DATA . . . 19
2. OUTCOMES AND MEASURES . . . 22
2.1. Type of auctioned items . . . 22
2.2. Player profit . . . 23 2.3. Player experience . . . 23 2.4. Timing of bids . . . 24 RESULTS . . . 26 1. SUMMARY STATISTICS . . . 26 2. PENNY-AUCTION STRATEGIES . . . 29
3. ESTIMATION OF THE WINNING STRATEGIES . . . 31
4. IMPACT OF EXPERIENCE ON THE USE OF STRATEGIES . . . 35
5. CHARACTERISTICS OF THE WINNING PLAYERS . . . 41
DISCUSSION . . . 46
LIMITATIONS . . . 48
CONCLUSION . . . 49
BIBLIOGRAPHY . . . 51
APPENDIX A - THE FIVE MOST POSITIVE AND NEGATIVE CORRELA-TIONS TO THE NUMBER OF AUCCORRELA-TIONS WON . . . 53
LIST OF TABLES
TABLE 1 - The summary of the variables in the datasets . . . 21
TABLE 2 - The distribution of auctioned items . . . 22
TABLE 3 - The correlation between the different definitions of player experience 24 TABLE 4 - The three categories of bid-timing . . . 25
TABLE 5 - The distribution of the three measures of player experience . . . 26
TABLE 6 - The distribution of the variables related to money . . . 27
TABLE 7 - The distribution of the types of transaction . . . 27
TABLE 8 - The list of strategic abilities considered . . . 29
TABLE 9 - The distribution of strategic abilities . . . 30
TABLE 10 - The five most positive and negative correlations to profit . . . 32
TABLE 11 - Regression results: impact of experience on the use of strategies . . . 39
TABLE 12 - A comparison of players’ natural abilities: the winners versus the rest of the players, mean (SD) . . . 42
TABLE 13 - A comparison of players’ learning rates: the winners versus the rest of the players, mean (SD) . . . 43
LIST OF FIGURES FIGURE 1 - The weekly number of new and active players . . . 28
FIGURE 2 - The distribution of the players’ natural abilities for early bidding . . 44
INTRODUCTION
In this thesis, I investigated the behavior of players in a new form of online auctions called pay-to-bid auctions or, more commonly, penny auctions. A typical penny auction has a countdown timer of 1 minute and a starting price of $0. When the auction starts, the timer starts to tick down and the players can submit bids to buy the auctioned item. Each time a bid is made, the timer is reset to 1 minute and the price of the item increases by a fixed increment of $0.01. A player wins the auction if he or she is the last player to have bid when the timer reaches 0. This particular type of auction represents an interesting topic of investigation because the literature on penny auctions is scarce at the moment, and there are still a lot of questions that remain unanswered. For many players and reviewers of the game, it is not clear whether penny auctions are a scam or not. A quick search on the topic with Google yields results that are often associated with negative reviews. Potential players have good reason to be cautious. In penny auctions, it is not rare to see items worth hundreds of dollars sold for less than $50. So is it a scam? This doubt raises questions about regulation. So far, penny auctions are unregulated in most countries. The fact that one participant wins the item while most people lose money, makes a penny auction seem like a lottery, and in most countries games involving chance are regulated. From a social point of view, penny auctions represent a new phenomenon. Perhaps penny auctions are addictive and should be a matter of public concern. If such is the case, penny-auction websites should provide help for gamblers on their websites similar to what online casinos do. So what is the impact of luck versus a player’s skill on the end results of a penny auction? And, more interestingly, if this is not chance, can a player learn how to win an item worth hundreds of dollars for less than $50? This last point is the dominant theme of my research.
In order to answer these questions, I used a large set of data provided by a penny-auction website. With this large set of data, I investigated outcomes such as players’ spending, revenue, profit, and bidding behaviors. With the help of relatively simple econometric models, I developed a methodology to identify the bidding strategies that increase a player’s profit. Using the bidding strategies that I found, I then investigated the relationship between a player’s experience and his or her bidding behavior.
In order to define my hypothesis on the strategies needed to win a penny auction, I
surveyed the forums that discuss penny-auction strategies123. The forums that discuss
penny-auction strategies are filled with comments that propose potential winning strategies. The most common ideas appear to be time-specific, that is, playing on certain days and at certain times during the day. The rationale behind this idea is that during certain time-specific moments, there might be fewer players on the website, which reduces the competition for the items. This information suggests that there might be bidding strategies that can increase a player’s profit. The availability of this type of information suggests that winning strategies could be acquired by sophisticated players willing to learn how to play better. Thus, I expect to find bidding patterns that correlate with a higher profit. I also expect that some players acquire these winning strategies in the course of playing more and more auctions. Such results would demonstrate that a player’s skill, rather than luck, is the most important determinant in the end results of a penny auction.
The main motivation of this research is to identify the winning strategies at penny auc-tions. The winning strategies are the most mysterious and discussed topic in penny aucauc-tions. In the process of identifying these strategies, I will touch upon topics related to the impact of experience, the source of the strategic abilities, and finally, I will briefly discuss the potential social impact of penny auctions.
Many potential winning strategies have been proposed in the discussion forums of penny-auction websites and in the literature on penny auctions, but there are few definitive answers. Overall, I aim to provide a better understanding of the world of penny auctions.
The contribution of this research comes in many forms. First, the data used contains information which was previously unavailable to researchers. More specifically, the data in-cludes the actual amount of money spent by each player. Using precise information on a player’s spending and revenue, I found that some players spent large sums of money but most players purchased a single package of tokens, spent little money, and left the website quickly. My most important finding is that I identified the winning strategies of the players in the
da-1 Strategy to Win Penny Auctions on Penny Auction Sites. Online at <http:
//johnrr631992.hubpages.com/hub/Strategy-to-winning-Penny-Auctions-on-Penny-auction-sites>. Consulted on May 17 2014.
2 Penny Auction Strategies. Online at
<http://pennyauctionlist.com/bidder-resources/strategies-tips/>. Consulted on May 17 2014. 3 QuiBids Strategy or How to Win Quibids Auctions. Online at <http://www.
pennyauctionintelligence.com/blog/articles/quibids-strategy-or-how-to-win-quibids-auctions>. Consulted on May 17 2014.
taset. I went beyond the strategies that have been considered in the literature thus far, and I expanded the set of potential strategies to all observable bidding characteristics.
As a more theoretical contribution, my study of player behavior in a real game setting contributes to the literature on behavioral economics. My results provide evidence that players exhibit different levels of strategic sophistication. I used a mixed model to estimate the dis-tribution of players’ natural abilities and the disdis-tribution of their learning rates. To the best of my knowledge, this type of model has never been used in studies reported in the literature on penny auctions.
This thesis is structured as follows. I first provide an outline of the history and evolu-tion of penny aucevolu-tions and I present the rules of the game. I then provide an overview of the literature on penny auctions. Next, I present the methodology I used to transform the raw data into usable variables. Finally, I present my model and the results of my analysis: I begin with descriptive statistics of the variables to get a better understanding of the data. I then present the methodology I used to identify the winning strategies. Then, I describe the mixed model and the results relative to the impact of experience on the strategies used. Lastly, I use the dis-tribution of the coefficients provided by the estimation of my model to show that the biggest winners had a higher level of natural ability.
BACKGROUND
1. HISTORY AND AUCTION RULES
Auctions have been used for a long period of time in human history. Herodotus reports that auctions were used for the sale of various objects around 500 B.C in Babylon. The word « auction » is derived from the Latin augere, which means « to increase ». As a broad definition, auction is defined as the process of procurement via competitive bidding. Given that auctions are a form of price setting mechanism, they are closely related to the field of economics. Léon Walras, father of the general equilibrium theory, used an auction analogy to describe his economic model. The « Walrasian auctioneer » asks for a price, sees the number of buyers and sellers at that level of price, and if there is imbalance, the auctioneer adjusts the price until the system reaches equilibrium.
However, in real life and throughout history, auctions have been used as a price setting mechanism in a limited number of fields. Auctions as a pricing fixing mechanism have been mostly used in fields like agriculture, fine arts, and some financial instruments like mortgages and bonds. In 2008, the National Auctioneers Association estimated that the gross revenue of the auction industry was in the order of $268.4 billion, the fastest growing sectors being agricultural, machinery and equipment, and residential real estate auctions.
The Internet has been a great innovation for the field of auctions and it has changed the way auctions are conducted. The ease with which the Internet can link people together and the relatively low cost of setting an online auction and participating in it have contributed to the expansion of the field. To this day, the most well known online auction is eBay which started operating in 1995 and now represents a multi-billion dollar business with service available in over 30 countries. More recently online auctions have extended their offer to an ever increasing number of items and even services. It is now common place to find auctions for items like airline tickets, hotel rooms, mortgages, and cars, among others.
The increase in popularity of online auctions has contributed to the invention of the penny auction. An important event in the genesis of the penny auction is the invention of the dollar auction by Martin Shubik in 1971 (Shubik, 1971). The dollar auction is simple and amusing yet usually highly profitable for the auctioneer. The rules of a dollar auction are as follows: the auctioneer auctions a bill of $1. The highest bidder wins the bill; however, both
the highest and the second highest bidder have to pay for their bids. For example, if player A bids $0.55 and player B bids $0.50, then the auctioneer awards the dollar to player A and receives in exchange $1.05 ($0.55+$0.50) for a quick profit of $0.05. The dollar auction was originally designed to exploit the « irrational » sequence of bidding and, most importantly, it was designed to be profitable for the auctioneer. It is therefore not a surprise to see that some promoters tried to mass-market the idea, and so the penny auction was born. A penny auction is a combination of the dollar auction and the low cost of setting up an auction on the Internet. The penny auction also includes a slight variation compared to the dollar auction since every player that bids during the auction pays for his or her bids, not only the first and second-highest bidder. Because of its importance in the field of penny auctions, the dollar auction is described in more detail in the section « Relevant Literature ». Given that the nature of a penny auction is to exploit the « irrational » weakness of its participants and to extract money from them, it is intriguing to note that the penny-auction industry attracted more and more players and has grown quickly. In 2005, Swoopo was one of the first sites to offer penny auctions. A recent study (Z. Wang and M. Xu, 2010) reported 126 penny-auction websites for the middle of 2010.
At the end of 2013, All Penny Auctions.com4 reviewed over 370 penny-auction websites.
Auction rules are relatively similar across all penny-auction websites. Players bid on items using tokens which can be bought on the penny-auction website or won during an auction. Each auction has a countdown timer that can last from 15 to 90 seconds. The price of the item being auctioned starts at $0 and increases by a fixed increment of $0.01 following each bid. It costs the players one token per bid. Each bid resets the countdown timer to its original time. An auction ends when the countdown timer reaches 0 seconds. The winner of an auction is the last player to bid and he or she needs to pay the final price of the item. Bids are non refundable, but for some auctions (e.g., Buy-it-Now auctions) the players can convert their bids into a rebate in order to purchase the item being auctioned.
An example of the auctioning process, is that of an iPad with a displayed value of $899 that was auctioned with a timer of 30 seconds. The final price of the auctioned iPad was
$27. The end price implies a total of 2,700 bids ($27 ÷ $0.01). The winner of the auction
placed 854 bids for a total of $640.50 (854×$0.75). The $0.75 represents the average cost of
a bid in the dataset. Therefore, the total amount of money spent by the winner of the auction was $667.50 ($640.50 + $27) for the iPad with a displayed value of $899. This particular auction was profitable for the website since the profit on the iPad (assuming the true value was
$899) was $1,153 (($27÷$0.01)×$0.75 + $27 - $899). Note that the final price of the item,
the one which is used for advertisement by the penny-auction websites, represents a fraction
4 AllPennyAuctions: a comprehensive database of penny auction statistics on bidders, items, and auctions. Online at <http://www.allpennyauctions.com>. Consulted on May 17 2014.
of the amount paid by the winner of the auction. Most of the profit made by the penny-auction websites comes from the bids and not from the final price of the item.
Obviously, because of its particular structure, the penny auction attracted criticism. The main criticism is that players spend money on items but might still loose. Because of that, penny auctions were often described as gambling and the most harsh critics stated that this type of auction was outright fraud. Interestingly enough, penny auctions are not as profitable as one might think. Many penny-auction websites have had trouble to stay in business and big websites have felt. The fallen include the Swoopo, Rapid Bargain and Bid Boogie just to name the largest. The penny-auction website that provided the data for this research has also went out of business.
2. RELEVANT LITERATURE
While auctions are an old phenomenon, auction theory is more recent and has its origin in game theory. For most of its history, auction theory was perceived as a specialized field, more mathematical, more abstract and usually perceived as distinct from the standard field of econo-mics. However, in the last few years, auction theory has grown in popularity and has been used to solve an ever increasing number of problems (Kleperer, 1999). The literature on auction theory and its applications has flourished both from an experimental perspective (Kagel, 1995) and from an empirical perspective (Laffont, 1997).
The increased application of auction theory in economics comes from the realization that many economic problems share close similarities with an auction. For example, the pro-blem of the discriminating monopolist has a close parallel with the optimal auction propro-blem which is to try to extract maximum profit from the bidders. As another example, the auction model of war of attrition in which players compete for a prize while accumulating costs has a close parallel with firms competing to be the unique survivor in a natural monopoly (Fuden-berg and Tirole, 1986). Some economic models even use auction theory as their main building block, for example, the wage determination problem in an oligopsonistic labor market (Ste-vens, 2000; Bernheim and Whinston’s, 1986).
Probably one of the most famous paper which successfully demonstrates the power of auction theory is the analysis of the Federal Communications Commission (FCC) wireless service auctions (Bulow, Levin and Milgrom, 2009). Using game theory, and more specifi-cally auction theory, the authors advised the company SpectrumCo in the design of an optimal bidding strategy during FCC Auction 66. Taking in account the behavior of the competitors and the budget constraint of SpectrumCo, the authors provided a model to accurately forecast
the bidding and the price of the wireless band that was auctioned by the FCC using an ascen-ding auction. Using the strategy designed by the authors, SpectrumCo successfully acquired a nationwide coverage at a discount of about one-third of the price paid by the company’s competitors. The authors estimated that the savings were in the order of one billion dollars. The acquisition at such a bargain price gave SpectrumCo a big competitive advantage over its competitors. Such success contributed to improving the perceived usefulness of auction theory in the economics community. The core idea of this thesis, that is, to identify a winning strategy in an auction, has its root in this famous paper.
This thesis is about the penny auction, a new type of auction that has both its structure and its name derived from the dollar auction (Shubik, 1971) and descends from the larger family of all-pay auctions. All-pay auction is a type of auction characterized by the fact that all players must pay for their bids regardless of whether they win the final prize or not. Given its ability to model a wide range of human behaviors, the all-pay auction has been used to model many economic phenomena. One such example is queuing behavior where everyone in the queue incurs a cost of waiting while having no guarantee to have a place or a ticket. In a similar logic, all-pay auctions have been used to model lobbying battles, and political campaigns (Persico, 2000). The common theme is that the actors are incurring a cost (donation in the case of a lobbying campaign) with no certainty of receiving the prize.
The descendant of the all-pay auction, the dollar auction, has also attracted consi-derable attention in the literature on auctions because it illustrates a paradox often found in rational choice theory. The end result of a dollar auction can be paradoxical because, even if the players have perfect information and act rationally at every step of the auctioning process, they are compelled to make an « irrational » decision by the end of the auction. The players end up overpaying in aggregate for the item which results in a profit for the auctioneer. Therefore, the dollar auction is a simple yet powerful way to illustrate the equilibrium in non-cooperative games, most specifically the danger of escalation, and consequently, it has been used to des-cribe many social phenomena. For example, the dollar auction was used to model arm and nuclear weapon races where contestants escalated the stakes in what might end up as a worse outcome for everybody (Costanza, 1984). Another example of application of the dollar auc-tion is that of the modeling of political contests in the United-States where political parties decide how to allocate resources while competing against each other for a given state (Kove-nock and Roberson, 2009). Economic applications of the dollar auction include rent-seeking (Nti, 1997), lobbying (Ben-Dov and Shilony, 1982), and patents competition (Leininger, 1991) where firms compete with each other in paying up-front costs to win potential contracts or pa-tents. The common link between these situations is the escalation which puts the actors in a situation where too much is invested to quit. Similar to the participants in a dollar auction, the actors behave in a way that results in a bad outcome for themselves while taking decisions
that appear rational at every step of the decision process. The dollar auction escalation pheno-menon was even used to describe recent events like the Greek bailout. John Kay argued in a
Financial Times op-ed5, that the European situation has a « dollar auction » aspect to it, that
is, if the governments of the countries involved make another contribution, another bid, it will result in gains or at least reduce the size of their loss. The end results of this escalation might however be catastrophic for the countries involved.
This brings us to the penny auction, the descendant of the dollar auction. From a theoretical standpoint, penny auctions do not follow the standard form of auctions. An auction is said to be standard « if the rules of the auction dictate that the person who bids the highest amount is awarded the object » (Krishna, 2002, p. 27). Such is not the case with penny auctions since it is the last bidder who wins regardless of the amount spent by that player. That said, the treatment of penny auctions in the academic literature is fairly recent; the first papers appeared around 2009. Most of these early papers have similar characteristics: they treat penny auctions from a formal perspective; they present theoretical models, assume that players are rational with perfect information, and describe the properties of the equilibrium in a penny auction. Most papers include some form of empirical tests in which the authors compare the predictions of their model to the results observed. The following section presents a review of these papers. There are four papers which appeared around the same time (Platt, Price and Tappen, 2009; Augenblick, 2009; Hinnosaar, 2010; Byers, Mitzenmacher and Zervas, 2010). Indepen-dently of each other, the authors of these papers developed the first theoretical model for penny auctions. The baseline model of penny auctions consists of n symmetric risk-neutral agents with perfect information about the value of the item, and the strategic profile of other players. An interesting result derived from this model comes from Platt et al. (2009). The authors sho-wed that the expected revenue of auctioning an item through a penny auction is similar to the revenue that can be expected from a more typical type of auction like a first or second-price sealed-bid auction. This result is fundamental because it demonstrates that a penny auction sa-tisfies auction theory’s most celebrated theorem, the revenue equivalence theorem (Klemperer, 2001). The revenue equivalence theorem or the revenue equivalence principle is a fundamental concept of auction theory. The theorem states that under certain conditions, different type of auction mechanisms result in the same expected outcome or revenue. For example, the selling price in a symmetric first-price auction is the same as a second-price auction even if the two auctions are not equivalent from a strategical point of view. In order words, revenue equiva-lence theorem states that, as an auctioneer, the type of auction you chose to auction a given
5 Kipling’s game theory lessons for Greece. Online at
<http://www.ft.com/cms/s/0/94623760-b7af-11e0-8523-00144feabdc0.html#axzz3Yz0v5GQr>. Consulted on May 23 2015.
item is irrelevant since the expected profit is not dependent of the type of auction (Kleperer, 1999).
Apart from this appealing feature of the penny-auction theory, the most noticeable characteristic of the baseline model is its failure. In equilibrium the baseline model predicts that penny auctions should result in a theoretical profit of zero for the auctioneer. This prediction is inconsistent with the auctioneer profit observed. Nevertheless, the failure of the baseline model is easy to understand. If agents are fully rational, have perfect information, and are risk-neutral, no solution derived from game theory can explain the auctioneer profit. For the auctioneer to make profit in equilibrium, at least one player has to lose, which is impossible in this setup since players participate in an auction by choice. As a result of understanding the failure, each author developed his own variant to correct the inadequacy of the baseline model.
In Augenblick (2009), using 166,000 auctions from Swoopo, the author estimated that the average auctioneer revenue was more than 150% of the value of the goods, which often translated into profit for the auctioneer. To explain this profit, Augenblick used the baseline model and complemented it with the fallacy model of sunk costs (Eyster, 2002). Sunk costs are costs that once incured cannot be recovered. In the case of a penny auction, once bids are made, they cannot be recover which make the sunk costs model a good candidate to model a penny-auction. In Augenblick’s model, players feel regret when they spend money on bids and do not win the auction. As a result, players obtain less utility from exiting the auctions as they pay for more bids, even though these costs are sunk. As the auction proceeds, sunk costs get bigger; and if the players are naive, the probability of the game continuing is higher than normal. This modification of the baseline model results in an aggregate overbidding which then translates into positive profit for the auctioneer. However, another penny-auction researcher performed an empirical test of Augenblick’s theory and he found no evidence of it in the data from Swoopo (Nanney, 2010).
Platt et al. (2010) tried to explain the bidding behavior by modifying the risk prefe-rences of the players. They divided the items being auctioned into two groups: normal items and electronic/video-game items. This division was based on the authors’ observation that the average auctioneer profit is close to zero for normal items, but it is much higher for electro-nic and video-game items. The authors assumed that the players were risk-neutral for normal items and that they were risk-loving for electronic and video-game items. Such an assumption results in an equilibrium in which auctioneer profit is possible.
Hinnosaar (2010) tried to overcome the inadequacy of the baseline model by pro-posing a number of hypotheses. One hypothesis is that playing a penny auction is, in fact, entertainment shopping. In this scenario, players obtain positive utility from participating in
auctions. Hinnosaar calls this positive utility « gambling value ». Another of Hinnosaar’s hypo-theses to explain auctioneer profit is the idea that players might incur a marginal cost of a bid which is less than the cost of a token. These assumptions create equilibria in which auctioneer profit is possible. However, Hinnosaar provided no empirical tests for his ideas.
Byers et al. (2010) used the asymmetry of information to explain auctioneer profit. The authors implemented different sources of asymmetry of information such as asymmetries in the perceived number of players or in the perceived value of the item. The most realistic version of the model is the one in which the impact of asymmetry in bid fees is analyzed. In this version of the model, players can lower the average cost of their bids by winning packages of tokens. The model in Byers et al. (2010). showed that two groups of bidders with a different marginal cost of bids competing for an item can produce an auctioneer profit at equilibrium. While this paper is creative in terms of modeling, there is a limited number of empirical tests. Nanney (2010) developed the most advanced theoretical model of penny auctions. He provided a general model and tested most of his predictions. His model combined the ideas of Platt et al. (2010) and Byers et al. (2010). Nanney’s model also accounts for imperfect in-formation and risk preferences. Nanney proposes a general asymmetric model in which the players face different vectors of auction-related parameters and in which two types of players comprise the type space, but neither type is aware of the other. Nanney’s model is a genera-lization of the asymmetric model developed in Byers et al. (2010). Nanney also attempted to connect the literature on penny auctions to that on lotteries. Following the ideas proposed by Platt et al. (2010), Nanney added a subpopulation of risk-seeking bidders and looked at the effect this has on equilibrium. From an empirical perspective, his most significant contribution is a demonstration that the profitability of a bid rapidly decreases over time. This contradicts the predictions of Platt et al. (2010). Nanney also provided evidence for the strong and po-sitive effect between the number of players in the early stage of an auction and the overall profitability of the auction.
As a final theoretical paper, another study used the utility function of a player to search for equilibrium in an auction (Mittal, 2010). Mittal’s most interesting result is that in his equilibrium, a player can expect positive utility when the cost of bidding is small and the value of an item is low.
Later authors in the penny-auction literature took the path of behavioral economics (Wang and Xu, 2011). The authors argued that player behavior is better understood through analyzing learning and strategic sophistication than through analyzing equilibrium. They clai-med that it would be wrong to assume that all the players are the same, are experienced, and are fully rational. While the general argument of this paper is interesting, the definition of
stra-tegic behavior is limited. The authors used the timing of a bid as the only measure of a player’s strategic sophistication. They proved that placing a bid at the middle of the time period coun-ted by the timer is a strategically inferior action compared to bidding at the end of the period. They conducted a variety of econometric analyses to test a) whether or not a player learns to be strategic and b) by how much the number of middle bids changes with experience. To conduct their analysis, the authors used data from the now defunct BidDeal.com. Their dataset contains every bid ever made on that website.
The game of penny-auctions even attracted an author from the field of computer science (Stix, 2012). In his research, the author tried to design a winning strategy for penny auctions. Stix proposed a number of algorithms for bidding which, he claimed, would increase a player’s profit. The most significant contribution of this author is his finding that almost all auctions were won by two specific types of players. These two types share the characteristic of persistence. A persistent player keeps bidding throughout the entire auction. In addition, a persistent player uses the automatic bidder heavily. The author also identified a bidding pat-tern that happens in the last 10 bids of 60 percent of the auctions: a single bid as the auction timer approached zero and several bids following that bid within a few seconds. Stix provided many explanations for this pattern, but we can summarize them as follows: that the pattern is a by-product of the volunteer dilemma. More generally, the volunteer’s dilemma is a situation where a given individual faces the decision to sacrifice or to free ride. If the individual sacri-fice, then he or she incurs a cost while the other individuals will benefit. Stix explains that the volunteer’s dilemma arise in this situation because when multiple players bid near the end of an auction, the other players realize that there are multiple bidder involved in the auction. The next round, when the timer approaches 0 seconds again, a given player might become reluctant to bid knowing that he have high risk of being overbid. The player therefore does not bid and hopes that another player will bid. If all the players think that way and everybody hope that somebody else will bid then the auction ends. Lastly, a limitation of this study is the small sample used. Stix used only 63 complete auctions from QuiBids.
The econometric model I used in this thesis is a mixed model. This is the first time such a model is used in a research on penny-auctions. Among estimation methods in the lite-rature on penny auctions, the most widely used model was the fixed effect model (Augenblick (2009); Wang et al. (2011)). These authors used fixed effect models to account for players’ heterogeneity. The idea of using a mixed model is also to control for players’ heterogeneity but to do it in a more flexible way. The rationale for why I chose this type of model will be described in the Methodology section. The mixed model has not been often used in the lite-rature on penny auctions; however, the random effect model and the mixed model have been used in the literature on auctions on many occasions. Random effects in particular are often used to control for the heterogeneity of the players in an auction setting. Examples of
applica-tions include the modeling of competition effects in first-price aucapplica-tions (Li and Zheng, 2008) and to model the overbidding behavior (Delgado, Schotter, Ozbay and Phelps, 2008). This last paper is important because one of the main empirical problems in the literature on penny auc-tions is to explain players’ overbidding. The authors concluded that controlling for players’ unobserved heterogeneity is a main determinant to explain overbidding in an auction. A more technical application of a mixed model in the field of auction theory is demonstrated in the modeling of prices for on-line eBay auctions (Reithinger, Jank, Tutz and Shmueli, 2008). The authors concluded that the mixed model yielded more accurate forecast of prices compared to other models they tried. My model is not as complex as the generalized boosted mixed model proposed by the authors, but I did not target predictive accuracy like the authors did. My model was meant to assess and quantify the existence of a link between the experience of the players and their use of bidding strategies. In summary, these tree papers have put forward the idea that controlling for players’ heterogeneity in an auction setting is important and that random effect model and mixed models are well suited for this task.
METHODS
1. SOURCE OF DATA
The database used in this study comes directly from a penny-auction website and consists of all auctions, bids, and transactions that occurred over the period ranging from the first auction ever conducted in February 2010 to the end of April 2012. This period will be defined as the observation period. The data consists of four different datasets.
Auction dataset: This file contains observations on the 86,185 auctions that took place during the observation period. The file contains eight variables (the unique identifier of each auction, the description of the product sold, the time the auction began, the time the auction ended, the value of the item, the final price of the item, and the unique identifier of the winner of the auction). The file also contains an identifier for the type of auction. The type of auction refers to the specific rules of play used in an auction. There are nine types of auction in the dataset. Most types of auction are some form of constraint which restrains players with more than a certain number of auctions won from participating in an auction. Other types of auctions include the following: a free-bid auction during which all players’ bids are reimbursed at the end of the auction; an anonymous auction in which the player identifier is not displayed; an autobet auction in which the players are allowed to set how many bids they are willing to make and the autobidder bids for them; and finally, a buy-option auction in which the players can convert the bid they made into a rebate in order to buy the item.
Bid dataset: This file contains all bids made during the observation period (12,8 mil-lion bids). The file contains five variables which are the following: the unique identifier of the auction, the unique identifier for players who bid, the time of the last bid, the remaining time on the timer when the bid was made, and the price of the item at the time of the bid.
Transaction dataset: This file contains information on the 184,281 transactions that happened between the players and the auctioneer during the observation period. The transac-tion file contains six variables which are the following: the unique identifier of the player who made the transaction, the type of transaction (see below), the unique identifier of the auction (if applicable – see transaction-type below), a description of the item sold, the amount of dollars involved in the transaction, and the date of the transaction. There are three categories of tran-saction type which are the following: token trantran-sactions which indicates that a player bought
tokens, buy-option transactions which indicates that a player used the buy option, and cashing which indicates that the player converted the value of the item won into tokens.
User dataset: This file contains the date on which each player subscribed to the web-site.
Table 1 presents a summary of the variables in the respective dataset and it also pre-sents descriptive statistics for the discrete variables and the mean and standard deviations (SD) for the value of the item and the final price of the item.
Table 1
The summary of the variables in the datasets Auction file (86,185 observations)
Identifier of the auction
-Description of the product sold
-Time the auction began
-Time the auction ended
-Value of the item, mean± sd 76.5± 142.6
Final price of the item, mean± sd 10.3± 18.4
Identifier of the winner of the auction
-Identifier for the type of auction, n (%)
-≤ 5 auctions won 3,610 (4.2) ≤ 10 auctions won 9,200 (10.7) ≤ 50 auctions won 9,827 (11.4) ≤ 100 auctions won 34,394 (39.9) Standard auction 44,742 (51.9) Free-bid auction 20,028 (23.2) Anonymous auction 3,610 (4.2) Autobet auction 3,557 (4.1) Buy-option auction 14,904 (17.3)
Bid file (12,776,309 observations)
Identifier of the auction
-Identifier for players who bid
-Time of the last bid
-Remaining time on the timer when the bid was made
-Price of the item at the time of the bid
-Transaction file (184,281 observations)
Identifier of the player who made the transaction
-Type of transaction, n (%)
-Token 93,815 (51.0)
Buy-option 80,563 (43.8)
Cashing 9,694 (5.3)
Identifier of the auction
-Description of the item sold
-Amount of dollars involved in the transaction
-Date of the transaction
-User file (150,258 observations)
-The numbers in table 1 can be interpreted as follows: across the 86,185 auctions in the auction dataset, 3,610 auctions or 4.2% had a limit on the maximum number of auctions won of 5. Note that because an auction can be of multiple types at the same time, the categories of type of auctions do not sum to 100%. It is interesting to note that the mean final price of $10.3 is inferior to the mean value of the item ($76.5). This is consistent with the marketing pitch of the penny-auction websites, that is, that the players can acquire items for a fraction of their costs. However, as I discussed above, this claim does not account for the costs of the bids.
2. OUTCOMES AND MEASURES
This section presents the methodology used to define the variables used in this study. Note that only the variables that require a more complete discussion are presented. Variables such as the day of the week on which players participated in an auction or the number of bids made by a player are simple counts, and their label is self-explanatory.
2.1. Type of auctioned items
There is no classification for items in the raw data. Using the respective description of the items, I grouped the items into six different categories. Table 2 shows the categories and the frequencies of these categories in the dataset.
Table 2
The distribution of auctioned items
Items Frequency (%) Tokens 65 Gift cards 18 Electronic 9 Kitchen items 4 Tools 1 Other 3
Generally, the items auctioned were easy to assign to a category. All items that did not fall into a category were included in the category « other ». For more precision, subcategories were created for tokens depending on the size of the package auctioned (15, 35, 50, 75, 100, 150, 200, and 500) and for gift cards depending on the dollar value ($10, $25, $50, $100, $200, $250, $350, and more than $500).
2.2. Player profit
Player profit has been the most studied and used variable in the literature so far. Player profit was used in Wang et al. (2011), Augenblick (2009), and Nanney (2010) as the main dependent variable. I defined profit for player i as the total value of the items he or she won minus the total of what he or she spent in order to win them. The total value of the money spent on the website is straightforward to compute using the transaction file. The market value of an item is an estimate based on the suggested value of that item found in the dataset. I compared the suggested value and the price found on Amazon for a sample of the items. As other researchers have already pointed out, the suggested price provided by the auctioneer is inflated and is about 10% to 25% higher than the price found on Amazon. Both Augenblick (2009) and Platt et al. (2010) used the price found on Amazon as a proxy for the value of the item since the Amazon price appears to be a better estimate of a player’s true valuation of an item. Consequently, I discounted certain categories of items by a discount factor of 15% to better reflect their market price. The categories of deflated items include the following: kitchen items, tools, electronics, and other items.
2.3. Player experience
The experience of a player was defined as the number of auctions he or she played. The total
number of auctions played by player i was labeled EXPi, where i is the player’s identifier. The
experience of player i up to auction n was labeled EXPin. This variable represents the total
number of auctions played by player i up to auction n. However, in practice, experience has to
be defined as EXPig, that is to say, the total number of auctions played by player i up to auction
group g. A complete description of the grouping process will be provided in the results section. Note that I defined experience as the number of auctions played by a player, but there are alternative ways to define a player’s experience. The experience of a player could also be defined as the number of bids made by a player. This might be more realistic since each bid represents a direct cost to a player. As a third potential methodology, experience could be defined in terms of the number of days played by a player. Table 3 shows the correlation between the different definitions of experience using Pearson coefficients of correlation.
Table 3
The correlation between the different definitions of player experience
Auctions Bids Days
Auctions 1 0.83 0.86
Bids 1 0.71
Days 1
The correlations between the different methodologies are high, and all p-values
tes-ting for a 0 correlation are <.001. I interpreted the results of the correlations as a sign that
the measures of experience are different ways of expressing the same underlying information. Therefore, I used the number of auctions as my main indicator of experience. This metric is both easier to compute and it is a convenient way of expressing a player’s experience since most variables used in the analysis are also related to auctions. For example, the number of auctions won, the type of item auctioned, the value of the item, and the hours and days of the week on which the auction began are variables related to auctions. My methodology of measuring experience « experience in auctions » is similar to the methodology used by Wang
et al. (2011). Note, however, that because the other definitions of a player’s experience might
contain useful information, I did not exclude these variables from my analysis. I will provide descriptive statistics of these variables in the results section.
2.4. Timing of bids
The timing of bids has been the most analyzed strategic variable in the literature. This metric appears to be an important predictor of a player’s strategic abilities. The methodology I used to create this variable is similar to the one used by Wang et al. (2011), but with a modification to account for the variation in the length of the auction. The authors in Wang et al. (2011) restrained their analysis to auctions with a 30-second timer. My methodology to define the timing of bids does not require to subset the sample, and it is, therefore, more flexible. To create the timing of bids variable, I use the variable of time remaining. This variable corresponds to the time left on the timer when a player made a bid. With the time left and the initial timer length of an auction, it is straightforward to compute the timing of bid k in auction n for player
i. To see how, it is necessary to first define the elapsed time as follows:
Elapsed Timeink= Initial Timer Lengthn− Remaining Timeink.
Bid Timingink= Elapsed Timeink
Initial Timer Lengthn.
Computed this way, the bid timing is the timing of the bid normalized by the timer length of the auction. Then, using a similar classification to the one used by Wang et al. (2011), I created three bid-timing categories. Table 4 presents these categories and their respective frequency in the dataset.
Table 4
The three categories of bid-timing
Range Categories Frequency (%)
Bid timing≤ 30% Early bid 50
30%< Bid timing < 70% Middle bid 18
RESULTS
1. SUMMARY STATISTICS
In this section, I present descriptive statistics for the variables that will be used in the model. Table 5 presents the two first moments, the 95th, the median, and 5th percentile of the distribution of the three measures of a player’s experience.
Table 5
The distribution of the three measures of player experience Percentiles
Mean SD 95 50 5
Number of auctions 35 126 128 9 2
Number of bids 444 2240 1385 70 14
Number of days 12 30 52 4 1
In table 5, the 95th percentile indicates that 95% of the players played fewer than 128 auctions and had a period of activity of 52 days or less. The median number of auctions played is 9 and the median number of days played is 4. These results indicate that most players played a small number of auctions and left quickly, but a minority of players played a large number of auctions and they had a long period of activity. The outliers tend to increase the mean because this metric has a greater sensitivity to outliers when compared to the median. The difference between the median and the mean indicates an asymmetric distribution. In the present case, because of the outliers, the median might provide a better estimate of the central tendency of the distribution.
The next set of descriptive statistics presents the distribution of the variables related to money. This table contains information on how much money players won and spent while playing penny auctions. Table 6 presents the variables I was privileged to have access to. No other researchers could have estimated these metrics as precisely. In my case, because I had access to all transactions that were made between the players and the website, the numbers in table 6 are not estimates, but rather a precise description of the players’ gains and losses.
Table 6
The distribution of the variables related to money Percentiles
Mean SD 95 50 5
Revenue 196 1202 693 0 0
Spending 235 980 789 40 18
Profit -39 562 137 -35 -329
As we can see from table 6, most players did not win any money while playing penny auctions. The median revenue of $0 indicates that more then 50% of the players never won a single dollar. The median spending was $40. This amount roughly corresponds to a one-time purchase of 40 tokens for $39.99. This number is consistent with the observation that most players purchased tokens only once. The median profit is a loss of $35, which is very close to the mean profit of $-39. While the distribution of profit contains more losers than winners, the presence of a few large winners creates a counter balance. The largest profit in our dataset is $24,000, while the largest loss is $13,000. A loss of $13,000 is large, but the player who incurred this loss is an outlier given that the 5th percentile of the distribution stands at $-329.
The next table, table 7, presents the frequency of the different types of transaction observed in the transaction file.
Table 7
The distribution of the types of transaction
Transaction type Frequency (%)
Token 55
Buy-option 42
Cashing 3
Not surprisingly, the purchase of tokens represents the majority of transactions at 55% of all the transactions. The buy-option represents the frequency at which players used their bid tokens as a rebate to buy the item auctioned. The most surprising element of this result is the low frequency of « cashing ». Cashing represents the option of converting the value of the item won into tokens and it is an alternative to buying tokens. Strategic players could have targeted items of low popularity in order to cash out the value of the item. As we will see in the next section, this does not appear to be a popular strategy among the players.
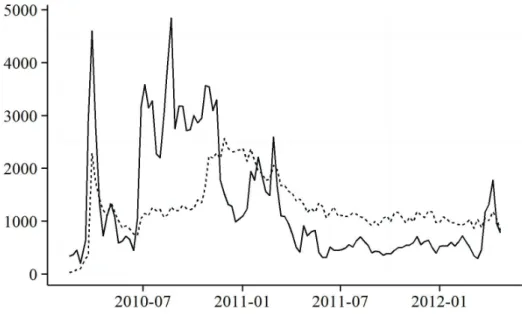
The next figure presents the weekly activity on the website. Figure 1 displays both the weekly number of new players and the weekly number of active players. I computed the new players to the website using the date of subscription contained in the user file. I computed the
number of active players by counting the number of players who played at least one auction during a given week. Wang et al. (2011) claimed that because most players quit playing quickly and because long-term players tended to be winners, the inflow of new players was crucial to the success of a penny-auction website. Therefore, we can think of figure 1 as a measure of the well-being of the website.
Figure 1: The weekly number of new and active players
The pattern in figure 1 is similar to the one observed by Wang et al. (2011). As we can see, there is a large inflow of new players at the beginning of the period. Then, after the initial period, both the number of new players and active players start to decline. The number of active players tends to stabilize at around 1000 players per week. Figure 1 is important because it demonstrates the changing conditions on the website. The number of active players decreases over time, and most importantly, the number of new subscriptions decreases over time. This phenomenon might have an impact on the winning strategies used by the players because it changes the profile of the competition. It is possible that the competition was more fierce at the end of the observation period because of the reduced number of newcomers and the presence of more experienced players competing for the same items. The conditions on the website changed so much that the website closed a few months after I received the data. Because of these changing conditions, it is not clear if an analysis conducted on the overall period would hold for all subsets of the observation period. Figure 1 is a reminder that chronology might be
an important aspect of the analysis and it might impact the results. This change in condition on the website is a limitation of my study.
2. PENNY-AUCTION STRATEGIES
The following section will provide a more formal definition of the strategies under considera-tion. Summary statistics for each strategy will be presented.
The strategies considered by the authors who conducted empirical analysis, Augen-blick (2009) and Wang et al. (2011), are timing of bids, type of item, and hour of the day. In my research, I expand the list of strategies and the list of potential strategies I considered in my research is presented in table 8.
Table 8
The list of strategic abilities considered
Variable Description
Type of auction played Standard, free-bet, beginner,
pro-gressive, nolimit, autobet, buy-option, anonymous
Type of item bid on Gift card ($10 to ≥$500 by $25),
package of tokens (10 to ≥500 by
25), kitchen goods, electronic, tools and other
Value of items bid on $0 to≥$500 by $25
Days of the week played Monday to Sunday
Hours of the day played 1 A.M. to 12 P.M. by 1 hour
Timing of bids Early, middle, late
Number of bids per auction
All strategies were computed, depending on the case, as a fraction of the total number of auctions played or as a fraction of the total number of bids made by a player. Therefore, a strategy was defined as the proportion of auctions (or bids) in which the player used the strategy. Table 9 presents the descriptive statistics for most strategies.
Table 9
The distribution of strategic abilities Percentiles Mean SD 95 50 5 Auction item Token packages 44 26 86 45 0 Gift cards 21 20 55 20 0 Electronic items 28 24 75 23 0 Kitchen items 4 8 17 0 0 Tools 1 4 6 0 0 Other 2 7 13 0 0 Auction type Beginner 8 17 44 0 0 Standard 39 28 91 40 0 Autobet 7 16 43 0 0 Buy-option 21 31 100 5 0 Free-bet 6 14 39 0 0 Nolimit 6 13 35 0 0 Progressive 12 17 50 1 0 Bid timing Early 41 23 80 40 4 Middle 21 18 59 17 0 Late 38 23 81 35 6
The values in table 9 were computed as follows: to determine that a player played a fraction f of his or her auctions in packages of tokens, I first counted the number of auctions in which player i bid on a package of tokens. I then divided this number by the total number of auctions played by player i. This process gives one fraction per player for each strategy. The numbers in table 9 are the means of these fractions. Note that for bid-timing I counted the number of bids made by player i in each bid timing category and I divided this number by the total number of bids made by the player. The definition of strategies and the aforementioned process to compute them is similar to the one used in both Augenblick (2009) and Wang et al. (2011).
Looking at table 9 we can see that, on average, the players played 44% of their auc-tions in aucauc-tions in which the item being auctioned was a package of tokens. For early bids, on average players made 41% of their bids early on in the auction. As we can see, most variables have a mean relatively close to the median. This indicates that the distribution of strategic abi-lities are relatively symmetric. This is good, since estimation procedures behave better when the input variables are well distributed. However, note that there is often a large difference bet-ween the 95th and the 5th percentile for most variables. There appear to be large fluctuations
in strategic behavior, especially for the type of auction played. The main takeaway from table 9 is the heterogeneity in the strategic behavior of the players. If the players had homogeneous strategic profiles, the variance in the distribution of each strategy would be close to zero. This heterogeneity will need to be accounted for later on in the estimation of the model.
In table 9, I did not present all of the subcategories (see table 8) in order to keep the size of the table manageable. The main categories provided sufficient information on the distribution of the variables. However, note that all of the subcategories were used during the estimation.
3. ESTIMATION OF THE WINNING STRATEGIES
This section presents the methodology I used in order to estimate the winning strategies of the players in the dataset.
To estimate the relation between the strategies and a player’s profit I relied on a simple measure of association which is the coefficients of correlation. This metric is simple to estimate and is more simple to interpret than other solutions proposed in the literature. I estimated the coefficients of correlation using a Pearson correlation-coefficient. The correlation coefficient is useful to measure the strength and the direction of a relationship between two variables. To compute the correlation, I created a dataset with one line per player with the profit of player i in one column, and, in the other columns, the mean proportion of a strategy used by player i for each strategy. I then computed the correlation between the profit and each strategy. Table 10 presents the strategies that are the most closely correlated to profit. All the correlations presented in table 10 are statistically significant and have p-values smaller than 0.001.
As we can see, bidding on packages of tokens is the strategy that is the most positively correlated to profit. Bidding and winning packages of tokens does not generate profit in itself, but it enables players to win tokens which they can then use to bid on other items. The presence of packages of tokens in the top five variables indicates that Hinnosaar (2010) and Byers et
al. (2010) had a good intuition. These authors proposed that some players were likely to be
able to reduce the average cost of their bids. The intuition for why this is a winning strategy is simple. If some players are successful at winning tokens below their cost ($0.75) these « low-cost bidders » have a big advantage when bidding against other players. Their marginal low-cost of a bid can be much lower than that of other players, which enables them to bid more often and for a longer period.
Table 10
The five most positive and negative correlations to profit Correlation Positive
Auction item: token: 100 0.29
Auction value: $50 - $100 0.27
Auction type: free bet 0.23
Bid time: early 0.20
Auction item: tokens 0.15
Negative
Auction type: standard -0.18
Auction item: electronic -0.17
Bid time: late -0.16
Auction value:> $500 -0.15
Auction value: $100 - $500 -0.14
The second strategy, auction value 50−100, falls in line with the prediction of Mittal
(2010) who showed that in equilibrium it is optimal for players to bid on items of low to middle value. The intuition for why this is a winning strategy is related to the fact that a penny auction usually ends with a small final price. With a small final price, expensive items give the impression of greater savings which attracts more players and creates more competition. Therefore, strategic players can be expected to avoid the high-value items and target low-value items.
The third strategy, auction type free bet, has never been mentioned in the literature as a potential winning strategy. Recall that free bet is a type of auction in which all of the bids made by a player are reimbursed to the player at the end of the auction. In other words, the winning player pays only the final price of the item and not his or her previous bids. This strategy which has not been previously identified in the literature relates to the presence of bidding on packages of tokens and the presence of low-value items since free-bet auctions have more bids on average (35 more bids) and are usually for items of low value with an average value of $50 less than the non free-bet auctions. One way to verify the validity of this hypothesis is to look at the correlation between the number of packages of token auctions and the number of free-bet auctions participated in, and between the number of low-value item auctions and the number of free-bet auctions participated in. I estimated the respective correlations at 0.92 and 0.73 which is both significant and strong.
The next strategy is early bidding. The presence of this strategy in our top five cor-relation is interesting. The timing of a bid is the potential winning strategy most often cited in the literature. The fact that the variable is present in the top five variables provides a form
of external validation for my methodology. Early bidding is often referred to as aggressive bidding in the literature on penny auctions. The rationale behind why this strategy is consi-dered a winning strategy is explained in detail in Augenblick (2009). Succinctly, aggressive bidding is a way for a player to bully the other players into leaving the auction. With a series of early and aggressive bids, that is, one bid after another, the aggressive player discourages other players from bidding on the item. Every bid made by the other players is instantly outbid by the aggressive bidder, and the other players eventually leave this particular auction.
With regard to the negative correlations, there are two interesting correlations. The first correlation is the electronic items which indicates that winning players tended to bid less frequently on electronic items. This result is in line with Platt et al. (2010). The authors observed that penny-auction websites made most of their money with electronic items. This type of item attracted a larger number of players, had more bids, had higher final prices, and, therefore, were more difficult for players to profit from. Consequently, it makes sense that winning players tended to avoid this type of auction.
The second interesting correlation is the presence of late bidding. This tells us that winning players tended to make fewer bids at the last minute. While early bidding is a winning strategy, it appears that late bidding is a losing strategy. The presence of this strategy is poten-tially an artifact of the presence of early bidding in the winning strategies. For a given player the proportion of early, middle, and late bids needs to sum to 1. Therefore, the late bid, is in a sense, the mirror image of the early bid. If the proportion of early bids is high for the winners, then the proportion of late bids needs to be low for a given player. It is therefore likely to find a negative correlation between profit and late bidding.
Of note is the presence of the category of high-value items as the last two entries in table 10, which once again confirms the intuition of Mittal (2010). The value of the item as a potential strategy has been given little consideration in the literature so far. The presence of three categories of value for items auctioned in the top correlations indicates that this strategy is important. Winning players tended to bid less on high-value items and focused more on low-value items. Again the intuition for the presence of this strategy is that items of high-value might give the impression of greater savings which results in increased competition for these items. Winning players would most likely tend to avoid items that attract lots of players and generate more competition.
Special attention must be given to the proportion of middle bids. The proportion of middle bids is important because the theory of Wang et al. (2011) predicts that there should be a negative correlation between the variable of profit and the proportion of middle bids. I found a significant and negative correlation of -0.08 between profit and the proportion of middle bids.
This correlation still ranks high in the negative correlation, but not high enough to appear in the top five correlations. I interpreted this result as a sign that middle bidding was important, but not as important as early and late bidding. This result might explain why some associations found in Wang et al. (2011) were not always significant.
Also of note is the absence of a few specific strategies from the top five of both the positive and negative correlations. Overall, neither the strategies related to the day of the week nor those related to the time of the day appeared. However, some significant relations were found. For example, it appears to be a bad idea to play past 8 p.m. and a good idea to start playing early in the morning around 7 a.m. I found no statistically significant correlations in terms of the day of the week.
A final and important point to mention is the relation between a player’s experience and his or her profit. Since a player’s experience is not a strategy, I did not present this result in table 10. Note, however, that the correlation between a player’s experience and his or her profit is strong. I estimated the correlation between experience measured in auctions and profit at 0.45 and the correlation between experience measured in bids and profit at 0.60. This is an important result and the fact that players who played more auctions tended to be winners was often mentioned in the literature.
In summary, in this section I investigated and presented the winning strategies in penny auctions. The results presented in this section are important because the winning strate-gies are used as input for the two next sections. To determine which of the potential stratestrate-gies were winning strategies, I computed the Pearson coefficients of correlation between each stra-tegy and the profit. The first and most important correlation I found is the one between a player’s experience and his or her profit. This suggests that the more experienced a player is, the higher his or her expected profit. This is not good news for penny-auction websites. The common themes in the literature to explain the reasons relative to why a strategy might be a winning strategy include getting cheap tokens by bidding on packages of tokens, bidding on items that attract less competition. Similarly to other authors in the literature on penny auc-tions, I found that early bidding or aggressive bidding was associated with higher expected profit. From a methodological perspective, it is important to keep in mind a limitation of the Pearson coefficient of correlation. This metric is a simple measure of association between two variables. My methodology relies on a large quantity of data to identify which variables are the most related to profit. While my results show that there is evidence in favor of the hypothe-sis that early bidding is related with profit, one cannot interpret this relation as early bidding causes profit. In the case of penny auctions and with the data at hand, the data generating pro-cess of profit is likely to be complicated to model and it might not be realistic to attempt to do so. For example, I showed that profit was correlated with experience, but it is difficult to