An integrated model of stand dynamics, soil carbon
and fire regime
:
Applications to boreal ecosystem response to climate change
Thèse
Yosune Miquelajauregui Graf
Doctorat en sciences forestières
Philosophiæ doctor (Ph. D.)
Québec, Canada
iii
Résumé
Les forêts d'épinettes noires (Picea mariana (Mill.) BSP) contiennent de grandes quantités de carbone stockées dans la biomasse vivante et dans le sol. Les feux de forêt et leur régime (ex. l’intervalle de retour de feu, l’intensité, la saisonnalité et la sévérité) jouent un rôle central dans le stockage et le flux du carbone, en modifiant la distribution et le transfert de carbone. Il y a peu de doute dans la communauté scientifique que le changement climatique provoquera des modifications dans les variables temporelles et spatiales qui contrôlent la fréquence et la sévérité des feux. Un modèle démographique structuré par classes de diamètre a été développé pour simuler le stockage du carbone sous divers régimes de feu. Cette approche intègre l’effet de l’intensité du feu et les mesures de la structure du peuplement sur la sévérité mesurée par la proportion de la mortalité des arbres. Le modèle permet aussi de quantifier et de cartographier les estimations régionales du carbone actuelles et futures pour le domaine bioclimatique de la pessière à mousses du nord du Québec. Les résultats de simulations suggèrent que la sévérité du feu augmente avec l’intensité initiale du feu. La variation de la structure du peuplement est l'un des facteurs qui explique la variation observée dans la sévérité du feu des régions boréales. Nous avons simulé les stocks et fluctuations de carbone sous sept niveaux d’intervalle de retour de feu et deux saisons de feu. Nous avons testé pour un effet de ces paramètres sur la moyenne des stocks de carbone. Les stocks de carbone étaient sensibles aux intervalles entre 60 et 300 ans. Le stock de carbone dans le sol fut plus faible pour les incendies d'été qui se produisaient durant de plus courts IRF. Finalement, les impacts à court terme du changement climatique ont été investigués au cours de quatre périodes climatiques : 1980-2010, 2010-2040, 2040-2070 et 2070-2100. Des cartes d’intervalle de retour du feu historique et futur et des données météorologiques projetées par CanESM2 RCP8.5 ont été utilisées pour simuler la croissance des forêts, le taux de décomposition, le régime du feu et la dynamique du C. Dans nos expériences de simulation, l’accumulation de carbone dans l’écosystème était réduite de 11% d’ici à la fin de 2100. Les forêts d'épinette noire du Québec seraient possiblement en train de perdre leur capacité à séquestrer et à stocker le carbone organique durant les prochaines décennies, à cause des effets du changement climatique sur le régime de feu et la croissance des forêts.
v
Abstract
Boreal black spruce forests (Picea mariana (Mill.) BSP) store great amounts of carbon in the living biomass and in the soil. Fire regime characteristics (e.g. fire return interval, fire intensity, fire season and severity) play a central role in the storage and flow of carbon, by modifying the distribution and transfer of material among pools. There is little doubt in the scientific community that climate change will cause changes in the temporal and spatial variables that control the frequency and severity of fires. A demographic diameter-class structured model was developed to simulate boreal carbon storage under different fire regimes. This approach incorporates the effect of fire intensity and stand structure measures to simulate fire severity, measured as the proportion of overstory tree mortality. The model allows quantifying and mapping average regional estimates of current and future carbon stocks for the black spruce-feathermoss bioclimatic domain of northern Québec. Simulation results suggest that fire severity increases with fire the intensity. Stand structure is one of the factors that explains the observed variation in boreal fire severity. We simulated carbon stocks and fluxes under seven levels of fire return interval (FRI) and two fire seasons. We tested for an effect of these parameters on average carbon stocks. Carbon stocks were sensitive to IRF's between 60 and 300 years. Soil C stocks were lower for summer fires that occurred during shorter IRF. Finally, we investigated the short-term impacts of climate change under four climatic periods: 1980-2010, 2010-2040, 2040-2070 and 2070-2100. Historical and future FRI maps and historical and forecasted weather data estimated by CanESM2 RCP8.5 were used to drive the growth of forests, decomposition rates, fire regime and C dynamics. In our simulation experiments, the accumulation of carbon in the ecosystem was reduced by 11% by the end of 2100. The results of this study suggest that black spruce forest could be losing their capacity to sequester and store organic C over the next coming decades due to climate change effects on the fire regime and on forest growth.
vii
Table of contents
Résumé ... iii
Abstract ... v
Table of contents ... vii
List of tables ... ix List of figures ... xi Acknowledgements ... xiii Preface ... xv General Introduction ... 1 Chapter 1 ... 7
Modelling variable fire severity in boreal forests: effects of fire intensity and stand structure ... 7
Abstract ... 8
Résumé ... 9
I. Introduction ... 10
II. Materials and Methods ... 13
III. Results ... 24
IV. Discussion ... 32
Acknowledgements ... 38
Chapter 2 ... 40
Sensitivity of boreal carbon stocks to fire return interval and seasonality of head fire intensity: a simulation study of black spruce forests ... 40
Abstract ... 41
Résumé ... 42
I. Introduction ... 43
II. Materials and Methods ... 45
III. Results ... 57
IV. Discussion ... 62
Acknowledgements ... 67
Chapter 3 ... 68
Short-term responses of boreal carbon stocks to climate change: a simulation study of black spruce forests ... 68
Abstract ... 69
viii
I. Introduction ... 71
II. Materials and Methods ... 73
III. Results ... 85
IV. Discussion ... 92
Acknowledgements ... 97
General Conclusion ... 98
Annexes ... 115
Appendix A Supplementary material for Chapter 1 ... 115
Appendix B Supplementary material for Chapter 2 ... 118
ix
List of tables
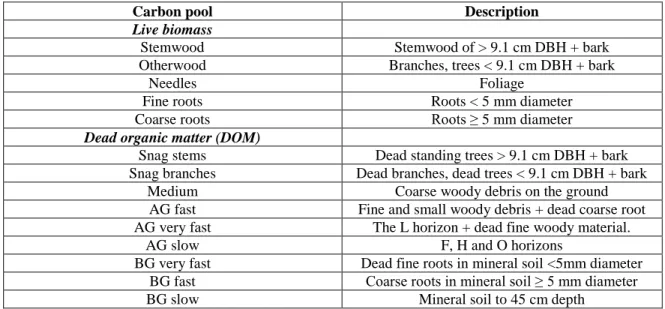
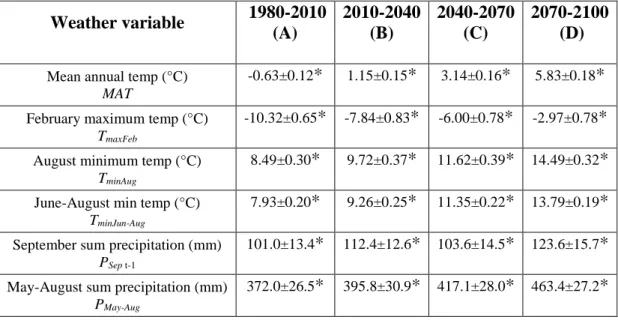
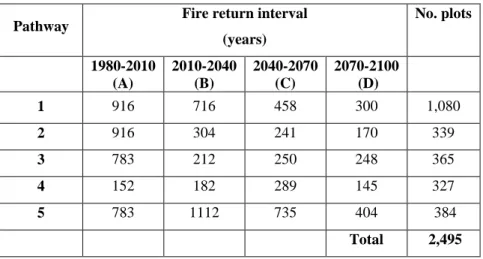
Table 1:Names, definitions, units, equations, and soyrces of the variables used in the fire severity model ... 17 Table 2: Descriptive statistics of the stand characteristics and structure attributes in 24,000 simulated 1.0 ha patches summarized by species and fire region s ... 26 Table 3: Descriptive statistics and mean fuel characteristics for each of the six terminal nodes produced by the regression tree analysis for black spruce and four terminal nodes for jack pine ... Erreur ! Signet non défini. Table 4: Description of the live biomass and dead organic matter above- and belowground carbon pools ... 52 Table 5: Tree component-specific allometric DBH-biomass equations and biomass and litterfall transfer rates... 53 Table 6: Parameters used to simulate boreal soil C dynamics and to estimate organic carbon consumption ... 54 Table 7: Simulated mean C stocks and fluxes for each structural type ... 61 Table 8:Simulated weather covariates generated by BIOSIM for four climatic periods ... 76 Table 9: Five characteristic temporal pathways (1980-2100) of fire return interval within the black spruce feathermoss domain in Québec, Canada ... 83 Table 10: Mean percent change in black spruce boreal C stocks and fluxes by climatic period ... 90
xi
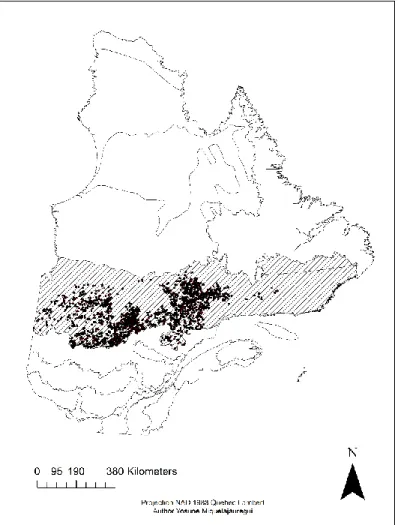
List of figures
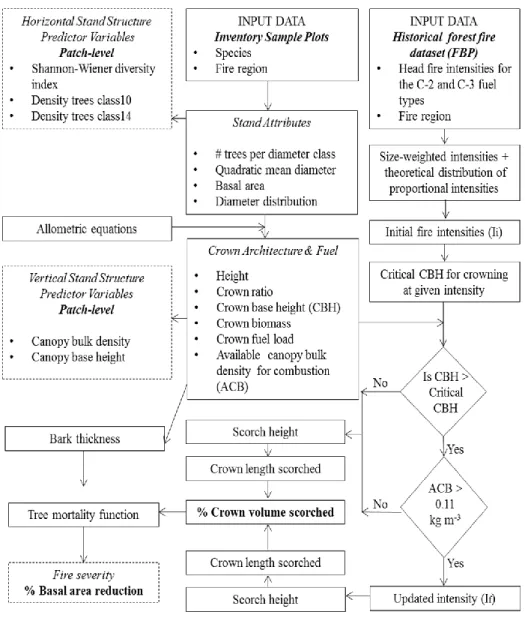
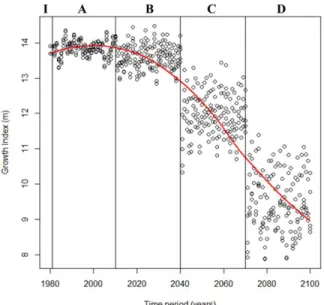
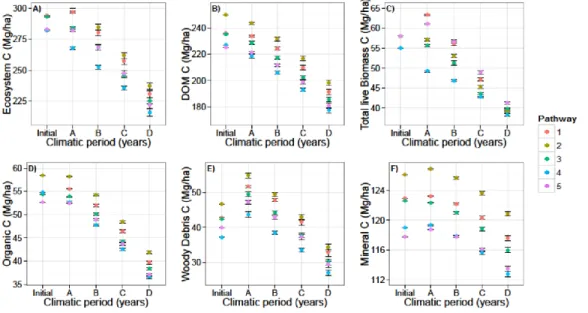
Figure 1: The black spruce feathermoss bioclimatic domain in Québec, Canada divided into pyrogeographic regions ... 14 Figure 2: Flow diagram of the fire severity model ... 16 Figure 3: Boxplots summarizing the distribution of the recorded historical and initial head fire intensities ... 25 Figure 4: Empirical distribution function of simulated fire severity ... 27 Figure 5: Regression tree for simulated fire severity in monospecific black spruce patches ... 29 Figure 6: Regression tree for simulated fire severity in monospecific jack pine patches .... 31 Figure 7: The black spruce feathermoss domain in Québec, Canada showing the location of the 3,249 monospecific black spruce patches ... 46 Figure 8: Diagram of the three model modules showing the most important components and interactions among the modules ... 48 Figure 9: The distributions of fire intensities by season for a) the historical fire record and b) the simulated intensities ... 57 Figure 10: Mean C stocks over 1000 replicate simulation runs by fire return interval and fire season ... 59 Figure 11: Mean C fluxes over 1000 replicate simulation runs by fire return interval and fire season ... 60 Figure 12: Estimated mean changes (%) in total ecosystem C storage for pure black spruce stands, over the study area. ... 62 Figure 13: Location of the black spruce feathermoss bioclimatic domain in eastern Canada ... 75 Figure 14: Mean simulated growth index (GI, m) calculated over 1000 replicate simulation runs of 120 years ... 85 Figure 15: Mean C stocks over 1000 replicate simulation runs of 120 years ... 87 Figure 16: Mean C fluxes over 1000 replicate simulation runs of 120 years ... 88 Figure 17: Mean rate of change in ecosystem C over 1000 replicate simulation runs of 120 years ... 89
xii Figure 18: Mean periodic changes in total ecosystem C storage in black spruce stands by fire return interval and climatic period. ... 91
xiii
Acknowledgements
This research was supported by funding from NSERC (Natural Sciences and Engineering Research Council of Canada) Strategic grant to A.D. Munson, R.L. Bradley, S.G. Cumming, S. Gauthier, D. Paré and S. Quideau. Financial support was also obtained from a NSERC- CGS D-Alexander Graham Bell Graduate scholarship to Y. Miquelajauregui. The author also received financial support from Produits forestiers Résolu and F.K. Morrow Foundation. I specially thank the Centre d’étude de la forêt (CEF) for financial and logistic support.
I would like to express my sincere gratitude to my supervisor Dr. Steve Cumming for his support and guidance during the time this thesis was completed. My co-supervisor Dr. Sylvie Gauthier who always provided important insights and comments on my work, thanks. I also want to thank the members of the C*Fire team at Université Laval for their important intellectual role during my Ph.D studies. My special gratitude to the CEF for providing important support which allowed me to improve my skills. I would like to acknowledge the help of Dr. Changhui Peng during my research stage at his laboratory.
This work was completed with the help of many people and institutions. I thank the Ministère des Ressources Naturelles for providing access to the Québec forest inventory data and to the Société de protection des forêts contre le feu (SOPFEU) for the historical forest fire database. I want to thank D. Boucher for her help with the stand structure classification, Y. Boulanger for allowing access to the fire regime maps, J. Marchal for his help with coding, M. Fortin for his guidance with the use of ARTEMIS and to R. Saint-Amant for his help with BIOSIM. I want to thank F. Raulier and N. Dhital for their assistance during the completion of the last chapter of this thesis. I also want to recognize the great support of Dr. Luis A. Bojórquez Tapia from the National Laboratory of Sustainability Sciences, UNAM for allowing me to work on my thesis and complete it on time.
Specially, I want to express my gratitude to my beautiful family, to mom, dad, Unai, Bartholomew, Julia, Bambas and Max who despite the distance, were always close to my heart. Their presence has helped me overcoming the challenges of life. In the memory of
xiv those who are not here with me anymore, Tita and abuelito, Amona and Aitona, Tere, Nandito, Nico and Akira, you are all part of me. Special thanks to my friends and loved ones who have allowed me to grow with them.
xv
Preface
This thesis entitled “An integrated model of stand dynamics, soil carbon and fire regime: Applications to boreal ecosystem response to climate change” is composed of three chapters written in English which are presented in the form of scientific papers. All the papers and information presented in this thesis are my original contributions aimed at obtaining a Ph.D in Forest Sciences at Université Laval, Québec, Canada. The model presented here, including its framework and modules was developed and coded entirely by the author.
Chapter 1- Miquelajauregui,Y., Cumming, SG and Gauthier, S. 2016. Modelling variable fire severity in boreal forests: effects of fire intensity and stand structure PLoS ONE 11(2).
Chapter 2- Miquelajauregui, Y., Cumming, SG and Gauthier, S. Sensitivity of boreal carbon stocks to fire return interval and seasonality of head fire intensity: a simulation study of black spruce (submitted to Ecosystems in May 2016; revised in July 2016).
Chapter 3- Miquelajauregui, Y., Cumming, S.G and Gauthier, S. Short-term responses of boreal carbon stocks to climate change: a simulation study of black spruce forests.
In addition to the papers mentioned above, a book chapter entitled “Simulation models of C dynamics/ Modelos de simulación de la dinámica del carbono” was published in 2013 by OmniaScience. The book chapter was the product of my attendance to the 6th annual summer course in Flux Measurements and advanced Modelling which took place at the University of Colorado Mountain Research Station, Boulder, Colorado.
This thesis has been directed by Dr. Steve Cumming, who is coauthor in all the chapters of this thesis. Sylvie Gauthier provided the fire intensity data and helped with the experimental design of all chapters. She also participated in the drafting and organization of all chapters. I want to acknowledge the help of the coauthors.
1
General Introduction
The Canadian boreal forest is a vast region of mostly coniferous forest dominated by black spruce (Picea mariana (Mill. B.S.P)), the most important fuel type in the region (Hirsch 1996). In Québec, the black spruce boreal forest represents 28% of terrestrial surface area (Rowe 1972, Saucier et al. 1998) and 52% of commercial forest (de Groot et al. 2003). The primary natural disturbance in coniferous boreal landscapes is fire, and large, high-intensity crown fires have long been regarded as characteristic of the region (Van Wagner 1983, Harper et al. 2005, Kashian et al. 2006). The boreal fire regime is mainly driven by regional climate along with fuel and ignition characteristics (Kasischke et al. 1995, Kafka et al. 2001, Aakala et al. 2007, Boulanger et al. 2013). Fire regime parameters, including the fire return interval, fire intensity, size, season of burning and fire severity largely determine patterns of boreal ecosystem structure and function (Oliver and Larson 1996, Johnstone 2011, Boulanger et al. 2013). Therefore, variations in the fire regime could lead to changes in stand structure and successional trends (Harper et al. 2005, Brassard and Chen 2006), forest productivity (Johnstone and Chapin 2006) and flammability (Van Wagner 1983), and the regional carbon balance (Bergeron et al. 2004, Kashian et al. 2006).
Fire return interval is defined as the mean number of years between successive fires at a given location, over a given time period (Li 2002). In eastern boreal forests of Quebec, historical fire return intervals range from 100 years in the western regions to more than 500 years in the eastern ones (Boucher et al. 2003, Bouchard et al. 2008, Chabot et al. 2009). In black spruce forests an initial cohort of spruce establishes immediately after a fire, giving rise to a dense, largely uniform, single-layered canopy forest with stems that are relatively homogeneous in diameter (Brassard and Chen 2006). As the stand develops, this stand structure gradually develops into a more open, multi-sized forest containing stems that originated from seed after the fire or from layering (Bergeron et al. 2002). In the prolonged absence of fire, black spruce canopy dominance is maintained through time by disturbances other than fire (e.g. gap dynamics, defoliating insects, wind; Harper et al. 2003, Forest et al. 2006, Rossi et al. 2009). Long fire return intervals lead to stands with an uneven distribution of tree sizes, whereas even-sized stands with a regular distribution of tree sizes are formed
2 under shorter fire return intervals (Kasischke et al. 1995, Boucher et al. 2003, Bouchard et al. 2008, Gauthier et al. 2009).
Fire intensity is a descriptor of forest fire behaviour which is correlated with fire return interval through fuel loading (Weber and Flannigan 1997). Fire intensity is defined as the rate of heat energy released per unit length of fire front (Byram 1959). Fire intensities in the boreal forest range from <10 kWm-1 for smouldering fires, from 10 to 2,000 kWm-1 for surface fires, and up to 150,000 kWm-1 for high-intensity crown fires (Alexander 1982; Johnson 1992). The season of the year when a fire occurs may affect intensity through differences in surface and crown fuel moisture content (Weber and Flannigan 1997). Modelled or measured fire intensity can be used to assess the likelihood of crown fire initiation (Alexander and Cruz 2012), predict the scorching height of conifer crowns (Van Wagner 1973), and estimate the biophysical impacts of fire (Alexander 1982, Keeley 2009, Johnstone 2011, Alexander and Cruz 2012). Fire severity refers to the general effect of fire on the forest environment, usually measured as the proportional overstory tree mortality (Kafka et al. 2001, Ryan 2002), but also by the consumption of soil organic layers and the mortality of belowground propagules (Ryan 2002). Fire severity is related to the amount, nature, and successional trajectory of regeneration vegetation through seedbed availability and canopy mortality (Greene et al. 2004; Johnstone 2011), post-fire tree fall patterns (Boulanger et al. 2011), nutrient cycling (Ryan 2002), and to the carbon stocks and fluxes of boreal ecosystems (Kasischke et al. 1995, Boby et al. 2010).
Boreal black spruce forests are considered a highly flammable fuel type due to their crown architecture: deep crowns with relatively low crown base heights (Johnson 1992), high crown bulk density (e.g. twigs and branches; Johnson 1992, Alexander et al. 2004), and their high resin and low crown moisture contents (Johnstone 2011). These stand structure attributes describe the availability and distribution of canopy fuels and so influence the development of high intensity crown fires (Cruz et al. 2003, Stocks et al. 2004). According to Van Wagner (1977) crown fire initiation and vertical spread occur when fire intensity attains a critical value that is a function of crown base height. Once the fire has reached the canopy, a crown fire can be sustained as long as a minimum density of fuels is present (Van Wagner 1973,
3 Cruz et al. 2005, Cruz and Alexander 2010). Despite the fact that boreal forest fires are generally described as severe, stand-replacing crown fires, recent findings have drawn attention to important variation in fire severity both within and among fires (Thompson and Spies 2009, Kafka et al. 2001, Amoroso et al. 2011). This variability could be explained by underlying spatial variation in fire weather, soils, physiography, and vegetation (Thompson and Spies 2009). However, much work is still required to understand how spatial variation in severity can emerge at multiple scales. The assessment of fire severity is relevant in the context of fire management, especially where forest landscape management intends to emulate natural disturbance regime by maintaining a mosaic of stand structures (Harvey et al. 2003, Sikkink and Keane 2012).
Boreal ecosystems store large amounts of carbon in the live plant biomass and soil (25 and 75% of the total stored carbon respectively; Kasischke et al. 1995, 2013). The extensive accumulation of carbon in boreal soils is possible due to the low decomposition rates which result from the cold temperatures characteristic of these forests (Kasischke 2000). The C dynamics in the boreal forest is mainly affected by the regional climate, soil characteristics, stand structure and composition, and the fire regime (Kurz and Apps 1999, Wang et al. 2003). In the boreal forest, individual fires typically kill most of the conifer live biomass (Brassard and Chen 2006, Kashian et al. 2006). They release carbon to the atmosphere via organic matter combustion (Kashian et al. 2006, Boisvenue et al. 2012), alter the thermal and moisture regime (van Bellen et al. 2010), re-initiate succession (Kasischke 2000), and modify the distribution of forest C stocks (Gower et al. 1997; Laganière et al. 2013). The key role of Canada´s boreal forests in the global C cycle has significant implications for forest management strategies (Kurz and Apps 1999, Boisvenue et al. 2012, Lemprière et al. 2013). For example, existing guidelines for ecosystem management consider landscape-level assemblages of forest stand attributes (e.g. diameter distribution, basal area, height distributions) but not forest carbon (Boisvenue et al. 2012). It is of interest to explicitly account for carbon in order to improve current C stocks assessments and to increase our capacity to deal with boreal forest C responses to climate change (Kasischke et al. 1995, Boisvenue et al. 2012). In Canada, sustainable boreal ecosystem management regimes aimed at improving carbon sequestration potential and mitigating and adapting to the effects of
4 future climate change are underway but remain at an early stage (Peng et al. 2002, Boisvenue et al. 2012, Lemprière et al. 2013, Gauthier et al. 2014).
Predictive models which are grounded in ecological theory can be used to guide management decisions (Cuddington et al. 2013). Forest C dynamics models, for example, can be applied to study the relationships between fire regime and climate, forest growth and C dynamics (Peng et al. 2002, Kurz et al. 2008). These models may be grouped into those where forest growth is driven by empirical and yield models (e.g. CBM-CFS3, Kurz et al. 2009; CO2FIX, Masera et al. 2003); process-based models where forest growth depends on a number of ecological processes such as photosynthesis, respiration, water fluxes and nutrient cycling (e.g. BIOME-BGC, Thornton et al. 2002; FOREST-BGC, Running and Gower, 1991); and hybrid models which link key elements of empirical forest growth to different underlying ecological processes (Mäkelä et al. 2000). All approaches can be used to study and predict C sequestration and storage under altered conditions (Peng et al. 2002, Keane et al. 2004 , Cuddington et al. 2013). However, some approaches are more suitable for application in forest management within the context of global change (Gustafson 2013). For example, empirical models provide information on stand characteristics basal area, height, stand density which can be easily constructed and incorporated into management analyses. However, extrapolation beyond known data is challenging (Cuddington et al. 2013). Process-based models are suitable tools to simulate climate change impacts on forest and to assess adaptive forest management strategies (Gustafson 2013). However, they are not designed to predict stand characteristics such as basal area, making them difficult for forest managers to use (Peng et al. 2002). Hybrid models are better suited to guide forest management practices because they integrate both ecological mechanisms and correlational components into easy-to-use modelling platforms. Their application allows evaluating forest C sequestration and dynamics under alternate responses to climate, fire and harvesting regimes (Peng et al. 2002).
The climate in many parts of the boreal forest is warming rapidly as a result of anthropogenic climate change (IPCC 2007). Although temperature is the climate variable in which the anthropogenic changes are expected to be strongest, other aspects of climate such as precipitation will change as well (Räisänen and Tuomenvirta 2009). The potential impact of
5 climate change on the fire regime has been shown in several studies (Flannigan and Van Wagner 1991, de Groot et al. 2003, Girardin et al. 2009, Boulanger et al. 2013). Variations in the fire regime will lead to changes in forest structure and function (Kurz et al. 1995), forest productivity, and consequently in C sequestration and storage (Boulanger et al. 2013). For the boreal forest of Canada, shorter fire return intervals, more intense fires and an extended fire season peaking towards the late summer are expected under projected climatic scenarios (Kurz et al. 2008, van Bellen et al. 2010). In many areas of the boreal forest, climate change is also expected to reduce black spruce tree growth (Girardin et al. 2008, Dhital et al. 2015, Girardin et al. 2015). Forest soils will likely be affected by changes in both site water balance and temperatures as these affect soil organic matter decomposition rates and nutrient cycling (Boisvenue and Running 2006, Gavin et al. 2007). Under the United Nations Framework Convention on Climate Change (UNFCCC), Canada is obligated to prepare and submit an annual national report on total national emissions and removals of CO2 and non-CO2 greenhouse gases (Brown 2002). However, Canada lacks critical information about boreal carbon dynamics necessary for reliable reporting, specifically about the stability of soil carbon stocks under different fire regimes. Thorough knowledge on boreal C dynamics and the immediate and long-term impacts of wildfires is necessary if we are to model and forecast regional or national C balances.
In this thesis, I develop a new hybrid-model of forest growth and C dynamics that links fire regime parameters and stand structure to simulate carbon stocks in boreal black spruce forests of northern Québec, Canada. The model uses a diameter-class structured demographic tool (Caswell 2001) to simulate stand dynamics based on empirical models of stem growth and mortality. We coupled this with an adapted version of the CBM-CFS3 boreal soil carbon module (Kurz et al. 2009), which contains explicit links between standing biomass and DOM carbon pools via mortality and living biomass turnover. A model of fire occurrence and severity driven by two key parameters of boreal fire regimes, intensity and fire return interval, allows us to simulate the effects of fire and fire regime on canopy tree mortality, combustion of organic matter, and resulting changes C stocks. This model can be easily applied as a management tool to assess short- and long- term climate change effects. It could also be used in other regions of the boreal given appropriate data and recalibration of parameters to
6 determine the long-term effectiveness of Canadian forests in meeting the goals stipulated in international agreements and policies.
This dissertation has been developed in the form of a collection of three articles already published, submitted or in the process of submission for publication in peer reviewed scientific journals. Therefore, some resemblance among chapters can occur.
7
Chapter 1
Modelling variable fire severity in boreal forests: effects of
fire intensity and stand structure
11Complete version of a published manuscript: Miquelajauregui Y, Cumming SG, Gauthier S (2016). Modelling variable fire severity in boreal forests: effects of fire intensity and stand structure. PLoS ONE 11(2).
8
Abstract
It is becoming clear that fires in boreal forests are not uniformly stand-replacing. On the contrary, marked variation in fire severity, measured as tree mortality, has been found both within and among individual fires. It is important to understand the conditions under which this variation can arise. We integrated forest sample plot data, tree allometries and historical forest fire records within a diameter class-structured model of 1.0 ha patches of mono-specific black spruce and jack pine stands in northern Québec, Canada. The model accounts for crown fire initiation and vertical spread into the canopy. It uses empirical relations between fire intensity, scorch height, the percent of crown scorched and tree mortality to simulate fire severity, specifically the percent reduction in patch basal area due to fire-caused mortality. A random forest and a regression tree analysis of a large random sample of simulated fires were used to test for an effect of fireline intensity, stand structure, species composition and pyrogeographic regions on resultant severity. Severity increased with intensity and was lower for jack pine stands. The proportion of simulated fires that burned at high severity (e.g. >75% reduction in patch basal area) was 0.80 for black spruce and 0.11 for jack pine. We identified thresholds in intensity below which there was a marked sensitivity of simulated fire severity to stand structure, and to interactions between intensity and structure. We found no evidence for a residual effect of pyrogeographic region on simulated severity, after the effects of stand structure and species composition were accounted for. The model presented here was able to produce variation in fire severity under a range of fire intensity conditions. This suggests that variation in stand structure is one of the factors causing the observed variation in boreal fire severity.
Keywords
Canada; boreal forest; fire intensity; canopy base height; canopy bulk density; inventory plots; crown scorch; fire severity; stand structure
9
Résumé
Il est de plus en plus clair que les feux de forêt boréale ne brûlent pas avec la même intensité et sévérité. Tout au contraire, une variation significative au niveau de la sévérité du feu, mesurée par le taux de mortalité des arbres, a été découverte tant au niveau d'un feu particulier qu’entre différents feux. Il est important de comprendre les conditions sous lequelles cette variation peut se produire. Nous avons intégré, des données d’inventaire forestier, des données historiques de feux de forêts et des allométries d’arbres à un modèle démographique structurée en classes de diamètre. Nous avons appliqué ce modèle aux placettes d’un hectare avec des peuplements purs d’épinette noire et de pin gris pur dans le nord du Québec, au Canada. Le modèle simule l’initiation des feux de cime et la propagation verticale dans la canopée. Ce dernier utilise les relations empiriques entre l’intensité du feu, la hauteur des flammes, la proportion de la cime brûlée et la mortalité des arbres pour simuler la sévérité du feu, en particulier la proportion de réduction de la surface terrière en raison de la mortalité due au feu. Des analyses d’arbre de classification et de régression ont été utilisés pour tester l'effet de l'intensité de feu, la structure du peuplement, la composition des espèces et des régions pyro-géographiques sur la sévérité résultante. Nous avons trouvé que la sévérité augmente avec l'intensité du feu et qu’elle était plus faible dans les peuplements de pins gris que dans eux d’épinette. La proportion des feux simulés qui ont brûlé avec une forte sévérité (c'est-à-dire, ayant une réduction de plus de 75% de la surface terrière) était de 0.80 pour l'épinette noire et de 0.11 pour le pin gris. Nous avons identifié des seuils d'intensité en dessous desquels il y avait une sensibilité marquée de la sévérité du feu simulée à la structure des peuplements, et aux interactions entre l'intensité et la structure. Nous n’avons trouvé aucune preuve d'un effet résiduel de la région sur la sévérité simulée, après avoir tenu compte les effets de la structure du peuplement et la composition en espèces. Le modèle présenté ici est capable de produire des variations dans la sévérité du feu sous une gamme de conditions d'intensité initiale du feu. Ceci suggère que la variation de la structure du peuplement est l'un des facteurs à l'origine de la variation observée dans la sévérité du feu des régions boréales.
Mots clés
Canada; forêt boréale; intensité de feu; hauteur de la base de cime; densité de combustible; inventaire forestier; proportion de la cime brûlée; sévérité; structure du peuplement
10
I. Introduction
A fire regime is a quantitative description of the characteristics of the fires that occur in a region (Whelan 1995), including frequency, size, cause, season of burning and the general type of fires (i.e. ground, surface or crown). In boreal North America, the fire regime is characterized by infrequent, high intensity lightning-caused crown fires that are both large and severe (Van Wagner 1983). Fireline intensity (fire intensity, hereafter) as defined by (Byram 1959) is the rate of energy release per unit length of fire front, currently measured in units of kW m-1 (Alexander 1982). It is one of the most important descriptors of fire behaviour to be used in explaining aboveground fire impacts (Alexander and Cruz 2012). Fire severity, on the other hand, refers to the biophysical or ecological impacts of a fire (Ryan 2002). Severity is inherently multifactorial. Some aspects that can be readily quantified are the proportion of foliage consumed or killed, and fire induced tree mortality (Johnstone and Chapin 2006, Boby et al. 2010). In forested ecosystems, fire intensity has been directly related to scorching height of conifer crowns (Keeley 2009). Scorch height is defined as the height at which the heat of a fire is lethal to living foliage; it is correlated to the proportion of foliage consumed (Peterson 1985). Low-intensity surface fires yield lower scorch heights that cause little or no tree mortality, whereas higher scorch heights characteristic of high-intensity fires can kill large trees resulting in nearly 100% tree mortality (Van Wagner 1973). In the boreal forest, variation in fire severity can have long lasting effects on the post-fire vegetation community structure and dynamics and on their flammability (Van Wagner 1983, Johnstone and Chapin 2006).
Boreal tree species have adaptations for survival and persistence in fire-dominated environments. For example, black spruce (Picea mariana (Mill.) BSP) and jack pine (Pinus
banksiana Lamb.), both possess, in different degrees, clumped aerial seedbanks protected by
cone serotiny that ensure a seed source for regeneration after a crown fire. However, the two species respond differently (e.g. in terms of mean fecundity and seedling survival rates) to variation in fire severity, as measured by overstory tree canopy mortality and duff consumption (Greene et al. 2004, Boiffin and Munson 2013). These differences in responses to fire severity can in turn affect post-fire regeneration densities and structural development
11 (Lecomte et al. 2007). Low-to moderate-severity fires typically leave most of the large trees alive, which results in structurally complex stands with a broad range of tree diameters (Bergeron et al. 2002). These fires tend to leave on the ground a thick layer of partially charred organic matter, a substrate that negatively affects recruitment and early seedling growth of both species, although with a less important effect on jack pine (Johnstone and Chapin 2006, Boiffin and Munson 2013). In contrast, severe fires that kill most trees are likely to regenerate as dense stands with relatively low levels of structural complexity (Amoroso et al. 2011). This is because such fires expose mineral soil, an optimal regeneration seedbed for both black spruce and jack pine (Greene et al. 2004, Boiffin and Munson 2013).
Boreal conifer forest stands present a highly flammable configuration of fuels because of their crown architecture (e.g. deep crowns with relatively low crown base heights; Johnson 1992), their high canopy bulk densities with large amounts of fine twigs and needles, high resin and low foliar moisture contents (Van Wagner 1983). From the point of view of the quantity of crown fuels, boreal conifer stands are architecturally easier to burn than other fuel types (Van Wagner 1977). During high latitude summers, longer daylight hours and lack of turgid new plant growth are conducive to drying of canopy fuels and thus high fire intensity (Alexander and Cruz 2012). It is for these reasons that high intensity crown fires with high flame length, high levels of consumption of the soil organic layers (Johnson 1992), and corresponding high severity have been considered characteristic of these ecosystems (Boby et al. 2010). However, recent findings have drawn attention to important variation in fire severity both within and among fires (Bergeron et al. 2002, Amoroso et al. 2011), even within boreal conifer stands. It is important then to understand the conditions under which such variation in fire severity can arise. One potentially contributing factor is variation in stand structure (Keeley 2009). In forest sciences, “stand structure” refers to the within-stand distribution of vegetation such as the horizontal and vertical arrangement of trees (Bacaro et al. 2014). Horizontal structure can be measured by stem density and diameter distribution, and vertical structure can be measured by factors such as the height to crown base and tree height (Smith et al. 1997). These variables are related to the quantity of available fuels and to their vertical distribution between the surface and top of the canopy (Cruz et al. 2003, Alexander and Cruz 2012). Stand structure influences the probability of transition between
12 surface and crown fires (Van Wagner 1977). Thus, stand structure is an important factor determining fire behaviour, fire severity, and forest ecosystem resistance and resilience in response to disturbances (Cruz et al. 2003, Gauthier et al. 2009, Thompson and Spies 2009).
The purpose of this study was to explore and quantify the effects of stand structure and, secondarily, of tree species composition and region, on the stem-mortality component of fire severity within the boreal conifer forests of northern Québec, Canada. We focused on simulated stands of black spruce and jack pine, the two most abundant and important boreal coniferous species (Boiffin and Munson 2013). Our objectives were to: 1) quantify the relationship between fire intensity and stand structure on fire severity; and 2) compare severity between black spruce and jack pine stands and among pyrogeographic regions of the study area. We expected that the effect of stand structure on severity will be of greatest importance at lower fire intensities associated with surface fires. High intensity fires almost always become crown fires, where close to hundred per cent tree mortality is the usual outcome. We also hypothesized that severity in pure jack pine stands will be lower than in pure black spruce stands mostly due to dissimilarities in stand structure, including the higher crown base height characteristic of pine. We tested these expectations using a simulation model where fires of varying intensity were applied to a “static” diameter class-structured model of forest stands. Static means there is no growth, mortality or recruitment. Our approach integrates physical models of fire behaviour with empirical models of fire effects (e.g. severity). The model was calibrated with data representative of our study area derived from inventory plots and historical fire intensities (1994-2010) estimated from spatially interpolated meteorological data. This study conducts a simulation experiment that evaluates the effect of fire intensity (reflecting weather) and stand structure variables on fire severity in 1.0 ha patches of mono-specific black spruce and jack pine stands in northern Québec, Canada. The results of these simulations provide insight into the causes of variable fire severity in boreal forests.
13
II. Materials and Methods
Study area
Our study area is contained within the black spruce feather moss domain (49° to 52° N, 57° to 79°W), of Québec, Canada, a vast region of approximately 412,000 km2 (Saucier et al. 1998; Fig. 1). The domain lies within the Canadian Shield, a large area of exposed Precambrian rock (Rowe 1972). It is characterized by a flat topography with surficial deposits of glacial till that are predominantly thin and discontinuous (Laganière et al. 2011). Fire is the most common natural disturbance in the domain (Johnson 1992). Short fire cycles (<180 years; Bélisle et al. 2011) predominate in the western and central portions of the domain, influenced by a continental climate, whereas longer fire cycles (>300 years) are found in the eastern part of the domain due to the humid maritime climate (Lecomte et al. 2007). Chabot et al. (2009) identified relatively homogeneous pyrogeographic regions -henceforth termed “fire regions”- of Québec forest (Fig. 1) based on levels of two fire regime parameters, namely fire cycle, which is estimated as the reciprocal of the mean annual proportional area burned (Van Wagner 1978), and the number of fires per unit area and time (Simard 1975). Four fire regions with contrasting fire regimes within the domain were chosen: A2, B3, C3 and D4 (names represent combinations of the two fire regime parameters following Chabot et al. (2009). These regions were expected to capture systematic factors such as climate or soils that potentially influence fire severity independent of stand structure.
14 Figure 1. The black spruce feathermoss bioclimatic domain in Québec, Canada (shaded area), divided into pyrogeographic regions based on two parameters of the fire regime: the fire cycle and the fire frequency in low, medium and high frequency categories (Chabot et al. 2009). The four fire regions chosen are shown: A2 (>1100 yrs; low-medium), B3 (500-1100 yrs; medium), C3 (200-500 yrs; medium), D4 (100-200 yrs; medium-high). Map created using ArcGIS 10.0 software.
Model design
We developed an integrated, size-class structured model of stand structure and fire effects (Fig. 2). Our methodology relies on several existing fire modelling systems and empirical allometric equations and models of fire effect and biotic response (Table 1) linking fire intensity, scorch height, the percent of crown scorched and tree mortality to derive one aspect of fire severity, specifically the percent reduction in patch basal area due to fire-caused mortality. The model can simulate the transition from a low intensity surface fire to a high intensity crown fire, as a process of vertical spread into the canopy. The vertical propagation of a fire in the patch is simulated using approximations of the physical conditions limiting
15 the initiation and vertical spread of a crown fire. These critical factors are the surface fire intensity, the canopy base height, and the bulk fuels density in the canopy (Van Wagner 1977, Cruz et al. 2003, Alexander and Cruz 2012). We do not model spatial propagation of a fire line or the interactions between surface fuel bed structure and fire behaviour. The model operates at the 1.0 ha patch level. We defined a “patch” as a homogenous spatial unit with respect to stand composition and structure. A patch is represented by counts of live trees within fifteen diameter at breast height (DBH) classes of 2.0 cm in width, from 1-3 to 29-31 cm. The class quadratic mean diameters were used to calculate stand basal area and other diameter class-level attributes (Van Wagner 1982; Table 1). Tree heights and crown ratios were calculated using species-specific allometries (Holdaway 1986, Peng 1999). Crown base height class was derived from calculated class top heights and class crown ratios (Cruz et al. 2003). Tree crown biomass (TCB; kg) was calculated using diameter-based crown fuel equations for black spruce (Stocks 1980) and jack pine (Lambert et al. 2005). Based on Alexander et al. (2004), crown biomass included the needles and the live branchwood material <0.5 cm in diameter and from 0.5 to 1.0 cm in diameter (Table 1).
16
Figure 2. Flow diagram of the fire severity model, relating geographically stratified samples of initial fire intensities and forest patch diameter distributions to perform the simulation experiment. Diameter distributions were used to derive fuel and stand structural measures. Crown fire initiation and vertical propagation of a fire was evaluated given the initial fire intensity distribution and the patch canopy fuel characteristics. If crowning occurs, fire intensity is updated and corrected for crown fires (Byram 1959). Foliage consumption or scorching is calculated from flame height and foliage profiles. This allows us to calculate size-class specific mortality rates, leading to a patch-level severity measure of basal area loss.
17
Table 1. Names, definitions, units, equations, and sources of the variables used in the fire severity model. Equations and parameters are for (a) black spruce and (b) jack pine. * denotes stand structure variables estimated at patch-level.
Name Definition Units Equation Reference
QMD Quadratic mean diameter per
diameter class cm
sqrt((X23- X13)/((X2-X1)(3))) where X2=upper
DBH class limit X1= lower DBH class limit
Van Wagner (1982)
BA Basal area of the average
tree m
2 ha-1 (QMD/2)2 (3.14)/10,000 -
H Top height per diameter
class m
(a) (1.3+1.065) (QMD^0.886) (b) (1.3+1.306)
(QMD^0.834) Peng (1999)
CR
Crown ratio. The ratio of live crown length to tree
height unitless (a)(5.54/(1+((0.007)(BA)))+(4.20)(1-exp((-0.053)(QMD)))-0.45)/10 (b) (6.64/(1 + ((0.013)(BA)))+(3.20) (1-exp((-0.052)(QMD))) -0.45)/10 Holdaway (1986) TCB
Tree crown biomass per diameter class. Living needles and branchwood <0.5 cm and from 0.5 to 1.0 cm in diameter kg (a) 0.63+ (0.02)(QMD^2.2) (b) (0.0079) (QMD^2.41) +(0.0389)(QMD^ 1.729) (a) Stocks (1980) (b) Lambert et al. (2005)
FM Available fuel masses per
diameter class kg
(TCB)(TEFi) where TEFi = No. trees in each ith
DBH class
Alexander et al. (2004)
CBHc Critical crown base height m
(I ^ 0.667) ((460+26)(FMC)) ^1.5 where FMC is the fine moisture content assumed to be
100%
Van Wagner (1987),Alexander
and Cruz (2012)
Ii Initial fireline intensity kW m-1 Corrected initial surface fire intensities -
If Updated fireline intensity
corrected for crown fires kW m
-1
(259.833)(Hi +(Hi*0.5) ^2.174) where Hi is the
height of the ith DBH class sustaining crowning
assuming no effect of wind speed
Byram (1959), Alexander and Cruz (2012)
SH
Scorch height. The vertical height of the highest point in the crown where fire damage
occurs
m (0.1483) (I ^ 0.667) where I is the fireline intensity (Ii or If)
Van Wagner (1973),Alexander
and Cruz (2012)
CLS Crown length scorched m SH-(H-((H)(CR))) if SH>H then CLS=(H)(CR) Andrews (2009)
CS
Percentage of tree crown volume that is consumed or
scorched % (100)((CLS/H)(CR)) Modified from Reinhardt and Crookston (2003), Andrews (2009)
BT Bark thickness cm (a) (0.032)(2.54)(QMD) (b)
(0.040)(2.54)(QMD) Andrews (2009)
M Mortality probability unitless (a,b) 1/(1+exp(-1.941+6.316 (1-exp(-0.3937)(BT))-(0.000535)(CS^2))) Reinhardt and Crookston (2003), Hood et al. (2007) S
Live overstory basal area reduction. Measure of fire
severity
% (100) (1- (BA after / BA before)) -
CBH*
Stand mean canopy base height. Average height from
the ground to the bottom of the live stand’s canopy
m sum(((Hi)(1-CRi))(TEFi))/sum(TEFi) where
TEFi= # trees in each ith diameter class Cruz et al. 2003
CFL* Canopy fuel load kg ha-1 sum((TCB)(TEF
i)) Cruz et al. 2003
CL* Average length of the
canopy fuel stratum m sum(((Hi)(CRi))(TEFi)))/sum(TEFi) Cruz et al. 2003
CBD*
Canopy bulk density. The available canopy fuel per
unit canopy volume
kg m-3 CFL/CL
Van Wagner (1977), Cruz et
al. (2003)
SWDI* Shannon-Wiener diversity
index unitless
-∑ pi (ln (pi)) where pi = relative proportion of
trees in each DBH class
Boucher et al. (2003)
18 The diameter-class specific tree crown biomass values were multiplied by the number of trees in each diameter class to obtain fuel mass load (kg, Table 1). A vertical fuel profile for each patch was obtained by summing fuel masses in thin (1 m) vertical layers along the tree canopy, across all DBH classes and dividing by the volume of that layer (plot area x layer depth; Reinhardt et al. 2006). We computed the “available” canopy bulk density for combustion using the running mean approach (Reinhardt et al. 2006). The “available” CBD provides information on the height of the densest layer within the canopy and is an appropriate measure to model crown fire behaviour (Keane 2015). When a fire of a given surface intensity (Ii) is initiated in the patch, there is a minimum crown base height that will allow for vertical propagation of a surface fire into the canopy (Van Wagner 1977, Reinhardt and Crookston 2003, Alexander and Cruz 2012; Fig. 2, Table 1). If crowning is initiated, the “available” canopy bulk density for combustion is compared to a critical bulk density threshold of 0.11 kg m-3 (Cruz et al. 2005), to determine if a crown fire could be sustained. This “available” CBD (ACB) is a target value for assessing the rate of spread (R0) to sustain active crown fires (Reinhardt and Crookston 2003) and has been empirically determined by Cruz et al. (2005) from experimental crown fire data covering a wide range of Canadian boreal coniferous fuel types, and a diversity of crown fuel structures (Van Wagner 1977, Cruz et al. 2005); therefore it can be applicable to any fuel type included in the FBP System prone to crown fires. This threshold is supported by similar wildfire case studies (Alexander et al. 2004) and used in other fire behaviour modelling frameworks (e.g. FFE-FVS; Reinhardt and Crookston 2003). For the purpose of this study, the same CBD threshold was assumed for both the C-2 and C-3 fuel types.
If both conditions apply, crowning is assumed and the fire intensity is updated (If) and corrected for crown fires as suggested by Byram (1959), Alexander (1982) and Alexander and Cruz (2012), to reflect a flame length consistent with the top height of the deepest canopy stratum capable of sustaining combustion. This assumes no effect of wind speed on flame’s geometry (Alexander 1982; Table 1). Otherwise, the initial fire intensity (Ii) is used for further computations. Scorch height is calculated as a function of intensity, after accounting for vertical propagation (Van Wagner 1973, Alexander and Cruz 2012). The percentage of crown volume scorched per DBH class is determined from calculated scorch height, class
19 top heights and class crown ratios by approximating the crown shape as a cylinder (Hood et al. 2007, Andrews 2009). The probability of tree mortality following fire per DBH class was modeled as a function of stem diameter, bark thickness and the percentage of crown volume scorched (Hood et al. 2007; Table 1). The number of trees killed in each DBH class is sampled from a binomial distribution given the predicted class mortality and the number of trees prior to the fire. From this, the model calculates pre- and post-fire basal area. Fire severity is measured as the percent basal area reduction due to mortality (Fig. 2, Table 1).
Historical forest fire and forest mensuration data
To run the model we required head fire intensities and tree diameter distributions. Head fire intensities representative of our study area, were selected from an historical forest fire database (1994-2010) provided by the Société de protection des forêts contre le feu (SOPFEU 2012), the province of Québec’s forest fire management agency. Database attributes for each recorded fire include the date when the fire was detected, the location and fuel type at detection, a final size, and the head fire intensity for the first day of burning. These head fire intensities were estimated according to the Canadian Forest Fire Behaviour Prediction (FBP) System from the assigned fuel type, and interpolated local solar-noon temperature, relative humidity, wind speed, and precipitation data (Forestry Canada Fire Danger Group 1992, Wotton et al. 2009). The geographical coordinates were used to select fires within one of the four regions (Fig. 1). We then classified fires as black spruce or jack pine if their fuel types were C-2 and C-3, respectively. The C-2 fuel type is characterised by pure, moderately well-stocked black spruce stands, with a low crown base. The C-3 fuel type is characterized by pure fully-stocked jack pine stands that have matured to the stage of crown closure closed (Forestry Canada Fire Danger Group 1992, Wotton et al. 2009). Fires of other fuel types were excluded, as were fires whose final size was recorded as zero. A total of 1,290 fire records were selected, of which 1,111 were classed as black spruce 2), and 179 as jack pine (C-3). SOPFEU is required to actively suppress all fires when first detected (SOPFEU 2012), and this policy was in place over the entire study interval. Fire management objectives in Québec are that fires be contained within a final size of 3.0 ha (SOPFEU 2012). Not all fires can be successfully contained given their size and intensity at initial attack (Hirsch et al. 1997): approximately 43% (n=556) of the historical forest fires (1994-2010) in our study area
20 exceeded the 3.0 ha target, and can be regarded as having escaped initial attack. We found a significant relationship (F1,1288 = 6.06, p = 0.013) between fire intensity and fire size in our study region, meaning that low intensity fires are associated with smaller fires.
Diameter distributions and stem counts were obtained from Québec’s extensive network of inventory sample plots (Ministère des Ressources Naturelles du Québec, 2008). The plot data contain descriptive and quantitative information at the plot level (e.g. geographical coordinates, altitude, slope, drainage class, surficial deposit type) and at the tree level (e.g. species and diameter at breast height). Plots are circular with an area of 400 m2 and a small circular subplot of 40 m2 at the center. Tree species and measured DBH are recorded for all live trees with a DBH greater than 9.1 cm. Height and age are recorded only for a subset of sample trees (Ministère des Ressources Naturelles du Québec, 2008). Saplings (trees with a DBH lower than 9.1 cm; Ministère des Ressources Naturelles du Québec, 2008) are measured within the 40 m2 subplot. Each inventory plot was associated with a list of measured tree diameters which are binned into the size-class structures. The inventory plot level data was scaled up to 1.0 ha. Inventory plots were spatially stratified by fire regions (Fig. 1), and then by soil drainage class and superficial deposit, two soil properties related to surface fuel moisture content that reflect the growing conditions of trees within the stand (Mansuy et al. 2010). Plots with “mesic-glacial till” soils, most characteristic of the domain, were kept for the modelling exercise (6,956 of 11,454). These were then classified by species composition (Ministère des Ressources Naturelles du Québec, 2008). Mono-specific plots were defined as those where a single species contributed more than 75% of the total basal area. We finally retained 3,428 mono-specific plots of black spruce (n=3,195) and jack pine (n=233) from which to sample simulated stands distributed among the four fire regions.
Simulation experiment
To evaluate the relationship between stand structure, fire intensity and severity, we simulated the severity of fires of randomly chosen intensity on randomly chosen patches, stratified by fire region and dominant tree species. We ran 3,000 simulations for each combination of four fire regions and two dominant tree species, for a total of 24,000 runs. The replicate plots were sampled randomly with replacement from the subset of inventory plots for the given species
21 within the fire region, and scaled to 1.0 ha. Stand attributes and the horizontal and vertical stand structure variables were calculated for each patch.
Fire intensities were sampled by a three-stage process. First, head fire intensities were selected from the historical forest fire database for the appropriate region and fuel type. Given the association between head fire intensity and fire size in our study area, we used a size-weighted sampling scheme to sample with replacement 3,000 head fire intensity records. For this procedure we considered fires with a minimal final size of 0.1 ha. By accounting for area burned, the low fire intensities that were associated with smaller fires were less likely to be sampled (Bessi and Johnson 1995). As a result, we expected the range of intensity values used in the modeling experiment to be more representative of the distribution of intensities over area burned. The estimated head fire intensities represent a mix of surface and crown fires, and overestimate the average fire intensity within the burn, even assuming constant burning conditions and elliptical growth (Catchpole et al. 1992). Fire severity is related to rate of spread (Keeley 2008), which varies along the perimeter of an ellipse, and is asymmetric along the major axis (Alexander 1985). Under this model of elliptical fire growth, the theoretical distribution of intensity within the burn can be derived from well-established principles of fire behaviour (Catchpole et al. 1992). We used this approach to account for variation in intensity within fires, assuming elliptical shapes (Catchpole et al. 1992). The average length-to-breadth ratios characteristic of jack pine and black spruce wildfires (Alexander 1985) were used to determine the shape of the ellipsoids.
We then sampled 3,000 proportional intensities from the Catchpole’s theoretical distribution and multiplied them by the size-weighted head fire intensity to provide a patch-level initial fire intensity (Ii). For each simulation, an initial intensity was applied to a sampled patch and updated to account for crown fire initiation. Fire severity was then calculated within the sample patch given the fire intensity (Fig. 2). Following Purdon et al. (2004), we classified fires as low, medium or high severity according to severity values of <25%, between 25 and 75%, and >75%, respectively. Although there seems to be no real consensus in terms of the meaning of these categories, such classifications can be useful for forest managers because they can be easily applied in aerial surveys of post-fire crown scorching (Purdon et al. 2004).
22 Stand structure variables
For each sampled patch, we calculated a set of horizontal and vertical stand structure variables that were used as predictors of fire severity in statistical analysis (Fig. 2). We used three horizontal structure variables that have been shown to effectively discriminate among stand structure types within this system (Boucher et al. 2003). These measures were the Shannon-Wiener diversity index (SWDI) of the diameter-class counts, and the percent density of trees in the 10- and 14-cm diameter classes. The SWDI (Table 1) measures the unevenness of the diameter distribution and can be related to the time elapsed since the last major disturbance (Smith et al. 1997, Boucher et al. 2003, Harper et al. 2003, Bacaro et al. 2014). Lower values of this index (1.2-1.7) are characteristic of stands with an even distribution of tree sizes that were affected by a recent disturbance, while higher values (1.8-2.4; Boucher et al. 2003, Harper et al. 2003) are characteristic of uneven-sized stands where the time since the stand-initiating disturbance is probably long compared to the lifespan of the dominant tree species. The percentages of live stems in the 10- and 14-cm diameter classes are also important stand structure attributes (Boucher et al. 2003). An increased density of small stems (e.g. 10-14 cm DBH) within the patch could contribute to an overall increase in fire intensity, thus in severity, as the canopy base height decreases and the abundance of ladder fuels increases (Van Wagner 1977, Mruzik 2001, Cruz et al. 2005).
The vertical stand structure covariates included in the analysis were the patch-level canopy base height (CBH, m; Table 1) and the canopy bulk density (CBD, kg m-3; Table 1). These variables are related to the quantity and vertical distribution of fuels within the canopy; therefore are important in estimating the potential of surface fires to transition to crown fires (Cruz et al. 2003, Keane 2015). Canopy base height was estimated from calculated class top height and class crown ratios and weighted over diameter classes (Cruz et al. 2003; Table 1). The canopy bulk density was estimated using the load-over-depth approach by Van Wagner (1977) and Cruz et al. (2003), that simply divides canopy fuel load by canopy length (Table 1). This straightforward approach allows relatively simple estimation of CBD, without the need to account for individual tree variations (Reinhardt et al. 2006, Hall and Burke 2006). To obtain the canopy fuel load (CFL, kg ha-1), the tree crown biomass values were multiplied by the number of trees in each diameter class and summed over classes (Table 1). Canopy
23 length, defined as the average length of the canopy fuel stratum, was estimated by subtracting the calculated class crown base from the class top height and weighted over diameter classes (Cruz et al. 2003). Our patch-level CBD differs from the “available” canopy bulk density used in evaluating crowning, in that the former represents an average across all canopy layers and the latter the variability of canopy fuel over horizontal space (Keane 2015).
Statistical analysis
Associations among the stand structure variables were determined, within species, using the Pearson product moment correlation coefficient (R package “stats”). We tested for differences in the stand structure variables and compared the mean fire severity among the four fire regions and between species using ANOVA’s and Tukey’s HSD tests. We compared historical and initial fire intensities among fire regions and fuel types. To model relationships between fire severity and the covariates of fire intensity, stand structure, species composition and fire region, we used a two-step approach based on nonparametric decision trees. A random forest analysis (RFA; R package “randomforest”) was first used to rank the potential covariates in terms of the strengths of their relationships to the response variable, and select a parsimonious subset based on this ranking. Then, a regression tree analysis (RTA; R package “party”) was used to classify the burned plots into groups of similar severity using the subset of covariates identified in the previous step. Both the RFA and the RTA are non-parametric methods suitable for ecological data with complex non-linear and interacting relationships between the predictors and the response. The random forest analysis outperforms many other statistical methods in terms of classification accuracy and is very useful when, as here, the true model is not known (Thompson and Spies 2009).
Once the important variables were identified by the RFA, an implementation of RTA called a conditional inference tree was applied. RTA recursively partitions the data into subsets, called nodes, which are relatively homogeneous in the response. Partitions or “splits” are determined by a threshold value of a single covariate, selected to maximise dissimilarity between the two new nodes. In conditional inference trees, covariates are selected by permutation-based significance tests. This reduces variable selection bias and overfitting (Hothorn et al. 2006, Thompson and Spies 2009) in comparison to similar methods such as
24 Classification and Regression Trees. Nodes that cannot be further split are called terminal nodes (Hothorn et al. 2006). For each terminal node, we calculated the mean, the median, and the coefficient of variation of fire severity. Separate trees were built for black spruce and jack pine stands. We used R version 2.15.0 (R Development Core Team 2012) for all statistical and graphical analysis.
III. Results
Historical head fire intensities did not differ among the four fire regions (Fig. 3a; F3,1286 =2.1,
p = 0.094) but did differ among fuel types (Fig. 3b; F1,1288 =122, p < 0.001). Mean initial fire intensities (Ii) differed among fire regions (Fig 3c; F3,23996 = 194, p < 0.001) and fuel types (Fig. 3d; F1,23998= 6885, p < 0.001). For both fuel types, we found a significant and marked negative correlations between the SWDI and the % density of trees in the 10-cm diameter class (r= -0.83 and -0.68, respectively; p ≤ .0001), and a weak but significant positive association between the former and the CBH (r= 0.35 and 0.38, respectively; p ≤ .0001). Very weak correlations were found for the rest of the horizontal and vertical stand structure variables. A significant species and fire region interaction (p ≤ 0.001) was found for the stand attributes listed Table 2.
25 Figure 3. Boxplots summarizing the distribution of the recorded historical head fire intensities (kW m-1, n=1,290) for a) fire region, b) fuel type, and the distributions of initial fire intensities (Ii, kW m-1, n=3,000) for c) fire region, and d) fuel type. Mean values are shown within the boxes. Boxes represent the inter-quartile ranges; horizontal lines within the boxes represent medians; whiskers extend to the most extreme data point that is no more than 1.5 times greater than the 3rd quartile or less than the 1st quartile. Dots above whiskers represent extreme values.
26
Table 2. Descriptive statistics of the stand characteristics and structure attributes (mean±sd) in 24,000 simulated 1.0 ha patches summarized by species and fire region. The number of available inventory sample plots per species and fire region are shown. Different letters (in parenthesis) for the stand structure variables tested (*) represent significant differences within rows obtained from a Tukey’s multiple comparison test (α=0.05). Highest values for each variable tested are shown in bold. The number of fires in the historical record that escaped the management target size of 3.0 ha for each species and within each fire regions is also reported.
Fire regions Stand and structure attributes A2 B3 C3 D4 BS JP BS JP BS JP BS JP No sample plots 1007 6 539 25 1184 138 465 64 Total density 4154± 2577 1374± 417 4250± 3408 2400± 1335 4209± 3304 3244± 2853 3987± 3030 2132± 2160 Basal area 24.6±8.4 14.4±3.2 22.6±10.0 18.1±6.4 22.3±9.6 18.5±7.4 19.4±8.8 9.9±5.1 CBD* 0.31± 0.14 (a) 0.12± 0.03(e) 0.30± 0.18(a) 0.18± 0.10(d) 0.30± 0.17(a) 0.20± 0.12(c) 0.27± 0.16(b) 0.10± 0.07(f) CBH* 3.0± 0.63(c) 3.4± 0.22(b) 3.0± 0.71(d) 3.5± 0.57(a) 3.0± 0.72(e) 3.4± 0.78(b) 2.8± 0.60(g) 2.8± 0.59(f) SWDI* 1.7± 0.32(a) 1.6± 0.31(b) 1.6± 0.40(c) 1.5± 0.31(e) 1.6± 0.42(c) 1.4± 0.46(f) 1.6± 0.39(d) 1.1± 0.45(g) % trees class 10* 23.6± 15(e) 22.3± 16.4(f) 27.0± 19.2(d) 27.4± 15.3(d) 27.8± 19.3(d) 32.5± 23.1(b) 29.5± 18.9(c) 35.0± 22.9(a) % trees class 14* 17.2± 7.1(a) 16.9± 6.3(ab) 16.0± 8.5(de) 18.2± 7.4(a) 15.7± 8.7(e) 16.1± 8.9(cd) 16.8± 8.8(bc) 14.2± 12.2(f) No. fires ≥ 3.0 ha 50 (35%) 10 (76%) 155(38%) 16 (44%) 127 (37%) 35 (39%) 134 (59%) 29 (72%)
Variation in fire severity among species and fire regions
The proportion of simulated fires that burned at high severity was 0.80 for black spruce and 0.11 for jack pine (Fig. 4). This difference was significant (χ21=11577, p ≤ .0001). Mean
severity was significantly affected by the interaction between species and fire region (F3,23992
= 481, p ≤ .0001). Mean severity was lower in jack pine stands than in black spruce stands (Appendix A-1). Fire region B3 and A2, had the lowest mean severity for black spruce (67%) and jack pine (8%), respectively (Appendix A-1).
27 Figure 4. Empirical distribution function of simulated fire severity, measured as percent reduction in patch basal area, within patches of jack pine and black spruce. Fire severity classes of Purdon et al. 2004), are delimited by the vertical lines: low severity (<25%), moderate severity (25-75%), and fire severity (>75%).
Fire intensity and stand structure effects on fire severity
The random forest analysis identified a similar set of important severity predictors for jack pine and black spruce stands. Intensity was by far the most important predictor of severity, followed by the canopy bulk density, the Shannon-Wiener diversity index (i.e. for black spruce), and the percent density of trees in diameter class 10 (i.e. for jack pine). High severity fires were predominantly associated to increased fire intensity, greater canopy bulk density