www.biogeosciences.net/13/2727/2016/ doi:10.5194/bg-13-2727-2016
© Author(s) 2016. CC Attribution 3.0 License.
Along-stream transport and transformation of dissolved
organic matter in a large tropical river
Thibault Lambert1, Cristian R. Teodoru2, Frank C. Nyoni3, Steven Bouillon2, François Darchambeau1, Philippe Massicotte4, and Alberto V. Borges1
1University of Liège, Chemical Oceanography Unit, Liège, Belgium
2KU Leuven, Department of Earth and Environmental Sciences, Leuven, Belgium 3University of Zambia, Integrated Water Resources Management Centre, Lusaka, Zambia 4Aarhus University, Department of Bioscience, Aarhus, Denmark
Correspondence to: Thibault Lambert ([email protected])
Received: 10 January 2016 – Published in Biogeosciences Discuss.: 8 February 2016 Revised: 14 April 2016 – Accepted: 29 April 2016 – Published: 10 May 2016
Abstract. Large rivers transport considerable amounts of ter-restrial dissolved organic matter (DOM) to the ocean. How-ever, downstream gradients and temporal variability in DOM fluxes and characteristics are poorly studied at the scale of large river basins, especially in tropical areas. Here, we re-port longitudinal patterns in DOM content and composi-tion based on absorbance and fluorescence measurements along the Zambezi River and its main tributary, the Kafue River, during two hydrological seasons. During high-flow pe-riods, a greater proportion of aromatic and humic DOM was mobilized along rivers due to the hydrological connectivity with wetlands, while low-flow periods were characterized by lower DOM content of less aromaticity resulting from loss of connectivity with wetlands, more efficient degradation of terrestrial DOM and enhanced autochthonous productivity. Changes in water residence time due to contrasting water discharge were found to modulate the fate of DOM along the river continuum. Thus, high water discharge promotes the transport of terrestrial DOM downstream relative to its degra-dation, while low water discharge enhances the degradation of DOM during its transport. The longitudinal evolution of DOM was also strongly impacted by a hydrological buffer-ing effect in large reservoirs in which the seasonal variability of DOM fluxes and composition was strongly reduced.
1 Introduction
The composition, transport and transformation of dissolved organic matter (DOM) in large rivers are key aspects for determining regional and global carbon (C) budgets (Schlesinger and Melack, 1981), the fate of terrigenous DOM flowing to the oceans (del Giorgio and Pace, 2008; Mas-sicotte and Frenette, 2011), the influence of fluvial inputs on DOM biogeochemistry in coastal and oceanic environ-ments (Holmes et al., 2008), and the functioning of inland waters as active pipes with regards to the global C cycle (Cole et al., 2007; Borges et al., 2015a). Riverine DOM is mainly derived from terrestrial soils (e.g., Weyhenmeyer et al., 2012), but it can also be fueled by sources within the aquatic system (Lapierre and Frenette, 2009; Massicotte and Frenette, 2011). Longitudinal patterns of riverine DOM, in terms of both concentration and composition, are con-trolled by numerous environmental drivers including connec-tivity with surrounding wetlands (Battin, 1998; Mladenov et al., 2007), lateral inputs from tributaries (Massicotte and Frenette, 2011) and shifts in dominant land cover (Ward et al., 2015). Once in the aquatic ecosystem, terrestrial DOM is exposed to in-stream processing such as photodegrada-tion (Cory et al., 2007; Spencer et al., 2009), microbial res-piration (Amon and Benner, 1996; Fasching et al., 2014), and flocculation (von Wachenfeldt and Tranvik, 2008) that usually operate simultaneously and lead to the removal and the transformation of DOM during its transport (Massicotte and Frenette, 2011; Cawley et al., 2012). The composition
! (!( ! ( ! ( ! ( ! ( ! ( ! (!(!( !(!( ! ( ! ( ! ( ! ( ! ( ! ( ! ( !(!( !( ! ( ! ( ! ( !( ! ( !( !(!(!( ! ( ! ( ! ( ! ( ! (!(
^
_
35° E 35° E 30° E 30° E 25° E 25° E 20° E 20° E 10° S 10° S 15° S 15° S 20° S 20° S Cahora Bassa Reservoir Kariba Reservoir Zambez i Lukanga Swamps Lu ng a Kafue Zam bezi Kabo mpo Mazoe Sh ire Luan gwa La ke M al aw i Barotse Floodplains Chobe Swamps Kafue Flats Shire Wetlands 0 100 200 400 Km MALAWI ANGOLA TANZANIA ZAMBIA D. R. CONGO MOZAMBIQUE BOSTWANA ZIMBABWE NAMIBIA Elevation (masl) 2902 2500 2000 1500 1000 500 1 Fluvial network Wetlands/Floodplains Lakes/Reservoirs Itezhi. T. Reservoir^
_
Victoria Falls !( Zambezi sampling sites
!
( Kafue sampling sites
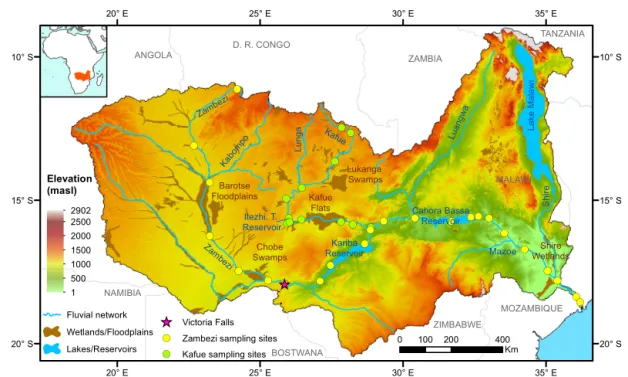
Figure 1. Map of the Zambezi Basin showing elevation, wetlands and floodplains areas (data from Lehner and Döll, 2004), the main
hydrological network and the distribution of sampling sites along the Zambezi and the Kafue rivers.
of DOM has been identified as a major driver determin-ing its reactivity in freshwaters (Weyhenmeyer et al., 2012; Kothawala et al., 2014; Kellerman et al., 2015). For exam-ple, the selective loss of the colored fraction of terrestrial DOM is a common pattern observed in a wide variety of ecosystems (Moran et al., 2000; Cory et al., 2007; Spencer et al., 2009; Weyhenmeyer et al., 2012). However, aquatic ecosystem properties (e.g., temperature, oxygen availability or composition of aquatic microbial community) may also play an equal role in determining the fate of DOM (Marín-Spiotta et al., 2014). Thus, the extent of DOM decay depends on the water residence time (WRT) of the aquatic ecosystem (Cory et al., 2007; Hanson et al., 2011; Köhler et al., 2013). In large rivers, WRT varies spatially, increasing in reservoirs and lakes compared to river channels and seasonally, being higher during low flow compared to high flow. Considering that changes in water level also control the hydrological con-nectivity with wetlands, it is likely that the downstream gra-dient in DOM composition drastically differs in relation to spatial and temporal changes in hydrodynamic conditions.
Longitudinal patterns of DOM in large rivers are of-ten assessed in one specific environment, such as wet-lands/floodplains (Mladenov et al., 2007; Yamashita et al., 2010; Cawley et al., 2012; Zurbrügg et al., 2013) or lakes (Parks and Baker, 1997; Massicotte and Frenette, 2011; Stackpoole et al., 2014), or limited to a subsection of large rivers (del Giorgio and Pace; 2008; Massicotte and Frenette, 2011; Ward et al., 2015), and mostly carried out during one specific hydrological period. Our understanding of rivers as a continuum in which DOM is simultaneously transported
from terrestrial soils to oceans, produced and degraded is thus fundamentally limited by a lack of basin-scale studies taking into account seasonal variations. This is especially true for tropical waters, which have the highest riverine dis-solved organic carbon (DOC) flux to the oceans (Meybeck, 1993) but for which DOM cycling has received less attention than rivers in other climate zones, with the exception of the Amazon River (Mayorga et al., 2005; Johnson et al., 2011; Ward et al., 2013, 2015).
The study of DOM biogeochemistry at large spatial and temporal scales requires analytical tools that are simple to implement but have a large sample throughput while providing pertinent information about the DOM chemi-cal composition. Spectroscopic methods, primarily based on ultraviolet–visible and fluorescence measurements, ful-fill these criteria (Jaffé et al., 2008). Optical properties of colored DOM (CDOM) and fluorescent DOM (FDOM) can be used to calculate several indices related to DOM com-position. These include the specific ultraviolet absorbance at 254 nm (SUVA254), positively related to the degree of DOM aromaticity (Weishaar et al., 2003), the spectral slope ratio (SR), inversely related to the average DOM molecular weight (Helms et al., 2008) and the fluorescence index (FI), related to the contribution of terrestrial vs. aquatic microbial inputs (McKnight et al., 2001). FDOM measurements acquired as three-dimensional excitation–emission matrices (EEMs) and coupled with the parallel factor analysis (PARAFAC) provide additional benefits for the characterization of DOM (Sted-mon and Markager, 2005; Sted(Sted-mon et al., 2003; Yamashita et al., 2008). In addition, the carbon stable isotope
compo-0 1000 2000 3000 4000 5000 Zambezi River 2012 wet 2013 wet 2013dry at Victoria Falls at Kariba Dam 02 /0 1/ 12 03 /0 1/ 12 04 /0 1/ 12 05 /0 1/ 12 06 /0 1/ 12 07 /0 1/ 12 08 /0 1/ 12 09 /0 1/ 12 10 /0 1/ 12 11 /0 1/ 12 12 /0 1/ 12 01 /0 1/ 13 02 /0 1/ 13 03 /0 1/ 13 04 /0 1/ 13 05 /0 1/ 13 06 /0 1/ 13 07 /0 1/ 13 08 /0 1/ 13 09 /0 1/ 13 10 /0 1/ 13 11 /0 1/ 13 12 /0 1/ 13 12 /3 1/ 13 0 500 1000 1500 2000 Kafue River ~44km upstream I.Tezhi Dam
at Kafue Gorge Dam
W at er di sc ha rg e (m 3 s -1 )
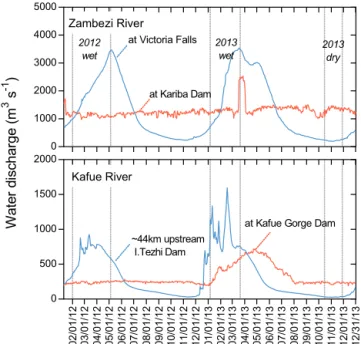
Figure 2. Water discharge between January 2012 and January 2014
for (a) the Zambezi River at Victoria Falls and at Kariba Dam, and
(b) for the Kafue River at Hook Bridge located upstream of the
Itezhi Tezhi Reservoir and at the Kafue Gorge Dam (data from Zam-bia Electricity Supply Corporation Limited, ZESCO). Bars refer to the three periods during which field campaigns were performed.
sition of DOC (δ13CDOC)can provide information about the terrestrial or aquatic origin of DOM (Mladenov et al., 2007; Lambert et al., 2015).
The Zambezi River basin, the fourth largest river in Africa, was extensively sampled from its source to its mouth dur-ing three field campaigns carried out over wet and dry seasons (Teodoru et al., 2015; Figs. 1 and 2). Longitu-dinal patterns of DOM were assessed through measure-ments of DOC concentrations and characterization of DOM (δ13CDOCcoupled with CDOM and FDOM) along the Zam-bezi River (> 3000 km) and its main tributary, the Kafue River (> 1500 km). The aim of this study was to determine the main drivers on downstream patterns of DOM at the scale of a large tropical river, with specific attention to the role of WRT in modulating the fate of DOM.
2 Materials and methods 2.1 Study site
The Zambezi River has a drainage area of 1.4 × 10⁶km2, originates in northwestern Zambia and flows southeast over 3000 km before it discharges into the Indian Ocean in Mozambique (Fig. 1). The climate of the Zambezi Basin is classified as humid subtropical and is characterized by two main seasons, the rainy season from October/November to April/May and the dry season from May/June to
Septem-ber/October. Annual precipitation strongly varies with lati-tude, from > 2000 mm in the northern part and around Lake Malawi to less than 500 mm in the southern part of the basin. The mean annual rainfall over the entire catchment is
∼940 mm (Chenje, 2000). Up to 95 % of the annual rainfall occurs during the rainy period while the dry period presents irregular and sporadic rainfall events. Consequently, water discharge in Zambezi River has a unimodal distribution with a single maximum peak discharge occurring typically in April/May and a minimum in November (Fig. 2).
Woodlands and shrublands are the dominant (55 %) land cover and stretch over the whole catchment; forests (20 %) and grasslands (9 %) areas are mainly confined to the north-east part of the basin and croplands represents 13 % of the to-tal area (Mayaux et al., 2004). Wetlands, including swamps, marshes, seasonally inundated floodplains and mangroves, cover 5 % of the total basin area (Lehner and Döll, 2004).
Based on distinct geomorphological characteristics, the Zambezi Basin can be divided into three major segments: (1) the upper Zambezi from the headwaters to Victoria Falls; (2) the middle Zambezi, from Victoria Falls to the edge of the Mozambique coastal plain (below Cahora Bassa Gorge); and (3) the lower Zambezi, the stretch crossing the coastal plain down to the Indian Ocean (Wellington, 1955). The up-per Zambezi covers about 40 % of the total area of the Zam-bezi Basin but comprises the highest fraction of wetlands and floodplains (about 60 % of the total wetlands/floodplains ar-eas of the Zambezi Basin), including the Barotse Floodplain and the Chobe Swamps (Fig. 1). The middle stretch of the Zambezi River is buffered by two major man-made impound-ments, namely the Kariba Reservoir (volume: 167 km3; area: 5364 km2; Magadza, 2010) and the Cahora Bassa Reservoir (volume: 63 km3; area: 2739 km2; Davies et al., 2000). The Kafue River (drainage area: 1.56 × 10⁵km2) joins the Zam-bezi River ∼ 70 km downstream of the Kariba Dam. Sim-ilarly to the upper Zambezi, the Kafue River comprises a high density of wetlands/floodplains (about 26 % of the to-tal wetlands/floodplains areas of the Zambezi Basin), includ-ing the Lukanga Swamps and the Kafue Flats (Fig. 1). It also comprises two smaller reservoirs, the Itezhi Tezhi Reser-voir (volume: 5.4 km3; area: 365 km2; Kunz et al., 2011) and the Kafue Gorge Reservoir (volume: ∼1 km3; area: 13 km2; Teodoru et al., 2015). In its lower part, the Zambezi River and its tributary the Shire River both drain narrow but ∼ 200 km long wetlands areas before their confluence zone. At the end of its course, the river forms a large, 100 km long floodplain– delta system of swamps and meandering channels.
2.2 Sampling and analytical methods
Sampling was conducted during two consecutive years and over two climatic seasons: wet season 2012 (1 February to 5 May, n = 40), wet season 2013 (6 January to 21 March,
n =41), and dry season 2013 (15 October to 28 November,
were located 100–150 km apart from the spring to the outlet (Fig. 1) except during the 2013 dry season when sampling in the Zambezi River ended before its entrance in the Cahora Bassa Reservoir due to logistical constraints.
Water sampling was mainly performed from boats or dugout canoes in the middle of the river. In few case (n = 10), in the absence of boats/canoes, sampling was carried out ei-ther from bridges or directly from the shore and as far as pos-sible away from the shoreline, but without discernable effects on the longitudinal patterns on DOM or other biogeochem-ical variables (Teodoru et al., 2015). Approximately 2 L of water was collected 0.5 m below the surface, kept away from direct sunshine and filtered within 2 h of sampling. The sam-ples preparation for the different analysis was performed just after filtrations. Filtrations were performed successively on pre-combusted GF/F glass fiber filters (0.7 µm porosity), then on 0.2 µm polyethersulfone syringe filters. Samples for the measurement of DOC concentration and δ13CDOCsignatures were stored in 40 mL glass vials with polytetrafluoroethylene (PTFE)-coated septa with 50 µL H3PO4(85 %). Samples for CDOM/FDOM analyses were stored in 20 mL amber glass vials with PTFE-coated septa but without H3PO4 addition. Samples for major elements (including Fe) were stored in 20 mL scintillation vials and acidified with 50 µL of HNO3 (65 %) prior to analysis. Samples were brought back to Bel-gium for analysis. For logistical reasons, it was not possible to store the samples cold, but the effects of room-temperature storage over several months on samples collected using our preservation technique has been found to preserve DOC,
δ13CDOC, and CDOM properties (own unpublished results).
2.3 DOC analysis
DOC and δ13CDOCwere analyzed with an Aurora1030 total organic carbon analyzer (OI Analytical) coupled to a Delta V Advantage isotope ratio mass spectrometer (KU Leu-ven, Belgium). Typical precision observed in duplicate sam-ples was in > 95 % cases < ±5 % for DOC, and ±0.2 ‰ for
δ13CDOC. Quantification and calibration was performed with series of standards prepared in different concentrations, us-ing both IAEA-C6 (δ13C = −10.4 ‰) and in-house sucrose standards (δ13C = −26.9 ‰). All data are reported in the δ notation relative to VPDB (Vienna Pee Dee Belemnite).
2.4 CDOM analysis and calculations
Absorbance was recorded on a Perkin-Elmer UV/Vis 650S spectrophotometer (Université Libre de Bruxelles) using a 1 cm quartz cuvette. Absorbance spectra were measured be-tween 190 and 900 nm at 1 nm increments, and instrument noise was assessed by using ultrapure (Type 1) Milli-Q (Mil-lipore) water as blank. After subtracting the blank spectrum, the correction for scattering and index of refraction was per-formed by fitting the absorption spectra to the data over the
200–700 nm range according to the following equation:
Aλ=A0e−S(λ−λ0)+K, (1)
where Aλ and A0 are the absorbance measured at defined wavelength λ and at reference wavelength λ0=375 nm, re-spectively, S the spectral slope (nm−1)that describes the ap-proximate exponential decline in absorption with increasing wavelength and K a background offset. The fit was not used for any purpose other than to provide an offset value K that was then subtracted from the whole spectrum (Lambert et al., 2015).
The SUVA254 was calculated as the UV absorbance at
λ =254 nm (A254) normalized to the corresponding DOC concentration (Weishaar et al., 2003). The natural UV ab-sorbance of Fe at λ = 254 nm was estimated based on mea-sured Fe concentrations and was then subtracted from the UV absorbance measured. The corrected value of A254 was then used to calculate SUVA254. The SUVA254 was used as an indicator of the aromaticity of DOC, with high values (> 3.5 L mgC−1m−1) indicative of the pres-ence of more complex aromatic moieties and low val-ues (< 3 L mgC−1m−1)indicative of the presence of more aliphatic compounds (Weishaar et al., 2003).
Napierian absorption coefficients were calculated accord-ing to
aλ=2.303 × Aλ/L, (2)
where aλ is the absorption coefficient (m−1)at wavelength λ, Aλ the absorbance corrected at wavelength λ and L the
path length of the optical cell in meters (0.01 m). CDOM was reported as the absorption coefficient at 350 nm (a350). Spec-tral slopes for the intervals 275–295 and 350–400 nm were determined from the linear regression of the log-transformed
aspectra vs. wavelength. The slope ratio SRwas calculated as the ratio of S275−295 to S350−400 according to Helms et al. (2008). SRis related to the molecular weight distribution of DOM, with values less than 1 indicative of enrichment in high-molecular-weight compounds and high values above 1 indicative of a high degree of low-molecular-weight com-pounds (Helms et al., 2008).
2.5 FDOM analysis and PARAFAC modeling
Fluorescence intensity was recorded on a Perkin-Elmer LS55 fluorescence spectrometer (Université Libre de Bruxelles) using a 1 cm quartz cuvette across excitation wavelengths of 220–450 nm (5 nm increments) and emission wavelengths of 230–600 nm (0.5 nm increments) in order to build excitation– emission matrices (EEMs). If necessary, samples were di-luted until A254 < 0.2 m−1 to avoid problematic inner fil-ter effects (Ohno, 2002). Before each measurement session (i.e., each day), a Milli-Q water sample was also analyzed. EEM preprocessing, including removing first and second Ra-man scattering, standardization to RaRa-man units, absorbance
corrections and inner filter effects, was performed prior the PARAFAC modeling. The scans were standardized to Raman units (normalized to the integral of the Raman signal between 390 and 410 nm in emission at a fixed excitation of 350 nm) with a Milli-Q water sample run the same day as the samples (Zepp et al., 2004). The PARAFAC model was built using MATLAB (MathWorks, Natick, MA, USA) and DOM Flu-orescence Toolbox 1.7. Validation of the PARAFAC model was performed by split-half analysis and random initializa-tion (Stedmon and Bro, 2008). Addiinitializa-tional samples analyzed in the same manner and collected from (1) tributaries of the Zambezi and the Kafue rivers as well as during an al-most 2-year monitoring period of the Zambezi and the Ka-fue rivers (n = 42; data not published) and (2) the Congo Basin (n = 164; data not published) were added to the data set. This was done to increase the variability of DOM flu-orescence signatures and therefore help detect components that could have been present in insufficient quantity to be de-tected in our environment (Stedmon and Markager, 2005). The maximum fluorescence FMaxvalues of each component for a particular sample provided by the model were summed to calculate the total fluorescence signal FTot of the sam-ple in Raman’s unit (RU). The relative abundance of any particular PARAFAC component X was then calculated as %CX=FMax(X) / FTot. The FI was calculated as the ratio of the emission intensities at 470 and 520 nm at an excitation wavelength of 370 nm (McKnight et al., 2001). A higher FI value (e.g., 1.8) indicates an aquatic microbial DOM source, while a lower value (e.g., 1.2) indicates a terrestrial source; intermediate values indicate a mixed DOM source.
2.6 Statistical analysis
A principal component analysis (PCA) was initially used as a diagnostic tool to examine relationships between PARARAC results, DOM concentration and composition assessed by op-tical proxies and isotopic measurements in order to better characterize the origin and source of the PARAFAC com-ponents identified in the study. The PCA was performed on scaled variables using the prcomp function in R software. DOC concentrations, stable carbon isotopic composition, op-tical indices (SUVA254, SR, FI), a350, FMaxand the relative abundance of PARAFAC components were used as the vari-ables for the PCA. Given the different units of the varivari-ables used in the PCA, data were scaled to zero mean and unit vari-ance as recommended (Borcard et al., 2011). The PCA was then performed on the correlation matrix of the scaled vari-ables. 0 2 4 6 D O C (m g L -1) Zambezi River (a)
Upper Middle Lower
-30 -26 -22 -18 d 1 3C D O C (‰ ) (e) 0 1 2 3 4 5 S U V A2 5 4 (L m gC -1m -1) (g) 0.6 0.8 1.0 1.2 1.4 1.6 SR (i) 0 1000 2000 3000 1.0 1.2 1.4 1.6 1.8 2.0
Distance from source (km)
F
I
(k)
Wet seasons (Mainstream) Dry season (Mainstream) Wet seasons (Tributaries) Dry season (Tributaries)
Kafue River (b) (f) (h) (j) 0 500 1000 1500
Distance from source (km)
(l) 0 5 10 15 20 a35 0 (m -1) (c) (d) I I I I I I IV V VI VII VIII
IX X XI XII XIII XIV
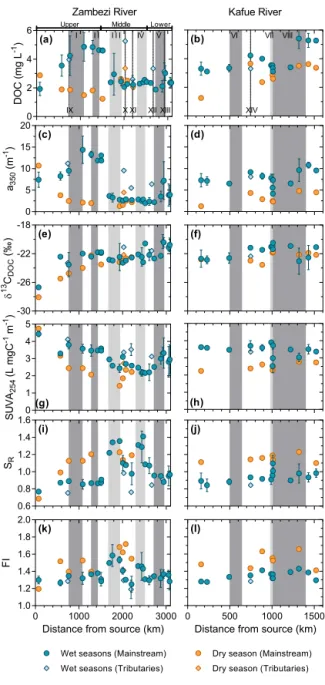
Figure 3. Longitudinal variations in DOM properties along the
Zambezi River (left panels) and the Kafue River (right panels) dur-ing the wet and the dry seasons. From top to bottom, the panels represent DOC, a350, δ13CDOC, SUVA254, SRand FI. Dark-gray and light-gray rectangles in the background represent the approx-imate position along the mainstream of wetlands/floodplains areas and reservoirs, respectively. Roman numerals refer to (I) Barotse Floodplain, (II) Chobe Swamps, (III) Kariba Reservoir, (IV) Ca-hora Bassa Reservoir, (V) lower Zambezi wetlands for the Zam-bezi River and (VI) Lukanga Swamps, (VII) Itezhi Tezhi Reservoir, and (VIII) Kafue Flats for the Kafue River. The diamonds represent samples collected from main tributaries upstream of their conflu-ence with mainstreams: (IX) the Kabompo, (X) the Kafue, (XI) the Luangwa, (XII) the Mazoe and (XIII) Shire River for the Zambezi River, and (XIV) the Lunga River for the Kafue River. Symbols and error bars for data collected during the wet seasons represent the average and standard deviation between the two field campaigns performed in 2012 and 2013, respectively.
0 5 10 15 0 2 4 6 8 % Wetlands D O C (m g L -1 ) Zambezi River R²=0.95*** Kafue River R²=0.74*
Figure 4. Relationships between DOC and % wetlands in the
catch-ment in the Zambezi and the Kafue rivers during the wet periods, with∗p< 0.1, and∗∗∗p< 0.001. For the Zambezi, only the sam-ples collected in the upper part of the basin have been considered due to the effect of the Kariba and Cahora Bassa reservoirs on the longitudinal pattern of DOC concentrations.
3 Results
3.1 Longitudinal patterns in DOC concentration, composition and DOM optical properties
Data were acquired during two wet seasons and one dry season. The two wet season data sets are discussed to-gether hereafter. DOC concentrations in the Zambezi River ranged from 1.9 ± 0.1 to 4.9 ± 1.0 mg L−1 during the wet periods and from 1.2 to 2.9 mg L−1 during the dry period (Fig. 3a). Along the upper Zambezi, DOC increased down-stream during the wet seasons, while DOC gradually de-creased downstream during the dry season. In the Kariba Reservoir, DOC variability between wet and dry seasons was relatively low, and concentrations ranged from 2.4 ± 0.3 to 2.9 ± 1.4 mg L−1. DOC exhibited relatively small variabil-ity downstream of the Kariba Reservoir and along the lower Zambezi, with the exception of a slight increase during the wet seasons downstream of the confluence with the Shire River (outlet of Lake Malawi). In the Kafue River, DOC was generally higher during the wet seasons (from 3.1 ± 0.1 to 5.4 ± 0.7 mg L−1)compared to the dry season (from 1.3 to 3.6 mg L−1; Fig. 3b). Despite this seasonal difference, DOC increased gradually downstream during both wet and dry seasons. DOC concentrations in the Itezhi Tezhi Reservoir showed a decrease (∼ 25 %) during the wet seasons but an increase (∼ 20 %) during the dry season compared to the up-stream station. During the wet periods, DOC concentrations in the upper Zambezi and the Kafue River were closely cor-related with the extent of wetlands (Fig. 4).
The a350values (Fig. 3c and d), used to assess the level of CDOM, were higher during the wet seasons (1.7 to 16.6 m−1 in the Zambezi and 3.9 to 11.5 m−1in the Kafue) than dur-ing the dry season (1.3 to 10.7 m−1in the Zambezi and 1.2 to 4.7 m−1in the Kafue). They followed similar spatial and seasonal patterns as DOC concentrations, with some
differ-ences. First, decreases in a350values were more pronounced than for DOC, especially in the upper Zambezi during the dry season and in the Kariba and Itezhi Tezhi reservoirs dur-ing the wet season. For example, while DOC decreased by a factor ∼ 2 as the Zambezi enters the Kariba Reservoir during the wet periods, a350 decreased by a factor ∼ 4. Secondly, while DOC concentrations were higher at the outlet of reser-voirs compared to upstream stations during the dry season,
a350values were lower.
δ13CDOCvalues in the Zambezi Basin ranged from −28.1 to −19.6 ‰ over the study period, i.e., from typical C3 dom-inated values (C3 end-member was estimated at −28.5 ‰ according to Kohn (2010) to values representing mixed C3 -C4vegetation (δ13C value for the C4end-member −12.1 ‰; Tamooh et al., 2012). δ13CDOC showed a gradual increase along the Zambezi River during all periods, from −28.1 and
−26.5 ‰ at the source to −21.4 to −20.1 ‰ near its delta, the latter being especially marked between the two first sam-pling sites in the upper Zambezi (Fig. 3e), while no signifi-cant pattern was observed along the Kafue River (values be-tween −25.9 and −20.5 ‰, Fig. 3f).
DOM at the source of the Zambezi exhibited the highest SUVA254(> 4 L mgC−1m−1, indicating strong aromaticity), and lowest SR (< 0.8, indicative of high molecular weight) values during both wet and dry seasons (Fig. 3g and i). During the wet seasons, the upper Zambezi was character-ized by stable SUVA254(3.5–4.0 L mgC−1m−1)and low SR (0.85–0.91) values. In the middle Zambezi, SUVA254 and
SR values were lowest (2.2 ± 0.2–2.9 ± 0.1 L mgC−1m−1) and highest (1.22 ± 0.09–1.41 ± 0.01) in the Kariba and the Cahora Bassa reservoirs compared to samples collected in-between (2.6 ± 0.1–3.1 ± 0.02 L mgC−1m−1 for SUVA
254 and 0.97 ± 0.1–1.10 ± 0.08 for SR). Overall, SUVA254 in-creased from 2.1 ± 0.5 to 2.9 ± 0.9 L mgC−1m−1, whereas
SR decreased from 1.08 ± 0.09 to 0.97 ± 0.04 in the lower Zambezi, with maximum (3.3 ± 0.9 L mgC−1m−1)and min-imum (0.88 ± 0.006) values recorded below the confluence with the Shire River, respectively. During the wet periods, FI values ranged between 1.24 and 1.41 in the mainstream, and between 1.43 and 1.58 in reservoirs (Fig. 3k). FI values during the dry season were generally higher than during the wet periods with values ranging from 1.29 to 1.72, except at the source of the Zambezi, where an FI value of 1.19 was observed.
In the Kafue River, variations in DOM composition were marked between the wet and dry seasons, but minimal along the longitudinal transect (Fig. 3h, j and l). SUVA254 and
SR ranged from 3.5 to 4.0 L mgC−1m−1 and from 0.79 to 1.05, respectively, during the wet seasons, except in the Itezhi Tezhi Reservoir, where SUVA254 decreased to 2.4 L mgC−1m−1and SRincreased up to 1.16. Values were quite stable during dry periods, and ranged between 2.2 and 2.8 L mgC−1m−1for SUVA254and from 1.11 to 1.22 for SR. FI values ranged between 1.27 and 1.42 during the wet sea-sons, and between 1.41 and 1.74 during the dry season.
Table 1. Spectral characteristics of the five fluorophores identified by PARAFAC modeling, correspondence with previously identified
com-ponents in different environments, general assignment, and possible source. Numbers in brackets refer to the second peak of maximal excitation.
Comparison with other environments
Component Maximum Maximum St Lawrence Large Arctic Boreal Subtropical Tropical Temperate Coastal Marine Assignment Possible
excitation (nm) emission (nm) River1 rivers2 lakes3,4 wetlands5,6 wetland7 estuary8 waters9 waters10 sourcea source
C1 < 240 (325) 443 C2 C1 C4 C1 C1 C4 – C1 Terrestrial humic-like T
C2 < 240 (365) 517 C3 C3 C3 C5 C4 C2 C3 – Terrestrial humic-like T
C3 < 240 (305) 383 C7 – C2 C4 C3 C6 C6 C4 Microbial humic-like Au9,M3,7,10, An8
C4 < 240 405 C1 – C5 C2 C2 C1 C1 – Terrestrial humic-like T5,6,8, P1,4
C5 275 (< 240) 337 C4 C5 C6 C8 – C7 C4 C2 Tryptophan-like Au1,9, M2,8
aT: terrestrial inputs; Au: autochthonous primary production; An: anthropogenic origin; M: microbial degradation; P: photochemical degradation. (1) Massicotte and Frenette (2011); (2) Walker et al. (2013); (3) Kothawala et al. (2014); (4) Kellerman et al. (2015); (5) Yamashita et al. (2010); (6) Cawley et al. (2012); (7) Zürbrugg et al. (2013); (8) Stedmon and Markager (2005); (9) Yamashita et al. (2008); (10) Jørgensen et al. (2011).
3.2 Longitudinal patterns in FDOM
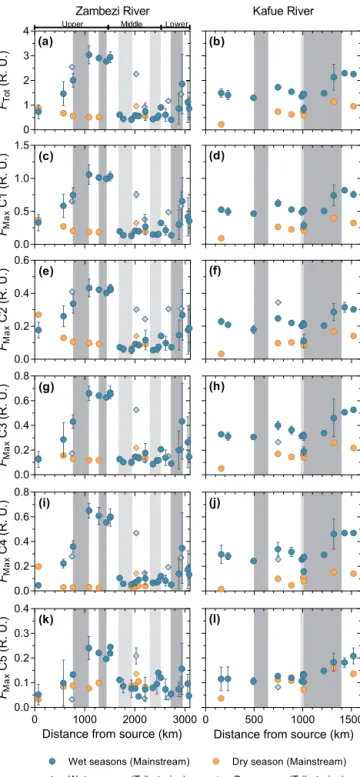
PARAFAC modeling identified three terrestrial humic-like components (C1, C2 and C4), one aquatic microbial humic-like component (C3) and one protein tryptophan-humic-like (C5) component (Table 1 and Supplement Fig. S1). In the Zam-bezi River, the fluorescence intensities (FMax)of PARAFAC components during the wet seasons presented patterns sim-ilar to DOC concentrations with some exceptions (Fig. 5).
FMaxof the C4 component presented the higher percentage of increase compared to the other component in river sec-tions flowing through wetlands/floodplains in the upper and lower Zambezi (data not shown). All terrestrial and micro-bial humic-like components showed a systematic and marked decrease in their FMax values in reservoirs, while FMax of C5 decreased in a smaller proportion in the Kariba Reser-voir and increased in the Cahora Bassa ReserReser-voir. During the dry season, FMax of terrestrial humic-like components decreased downstream concurrent with DOC concentrations, while FMaxremained stable for C3 or increased for C5. In the Kafue River, FMax of all components followed similar spa-tial and temporal patterns as those of DOC concentrations. The main difference observed was that while FMax values of humic-like compounds were lower during the dry season compared to the wet seasons, FMaxof C5 exhibited similar values across the hydrological cycle.
As a direct consequence of the spatial and temporal differ-ences in FMax of PARAFAC components, the relative con-tribution of each component to the total fluorescence signal
FTOTshowed distinct patterns (Fig. 6). Thus, the downstream decrease in %C1 and %C2 observed in the upper Zambezi during the wet seasons can be related to the parallel increase in %C4, the latter being due to the more pronounced increase in FMax of C4 relative to the other components. The same patterns for %C1 and %C2 observed during the dry season, however, reflect the fact that FMaxvalues of C3 and C5 were stable or increased during the dry season, respectively, while
FMax of C1 and C2 decreased. %C5 was higher during the dry season compared to the wet seasons, and reached highest values in reservoirs during the wet periods due to its specific spatial and temporal variations in FMaxvalues. No longitudi-nal changes in the relative abundance of PARAFAC
compo-nents were observed along the Kafue River. Similar to what was observed along the Zambezi River, the dry season was marked by a decrease in %C4 and an increase in %C5, while %C1, %C2 and %C3 were equivalent to values recorded dur-ing the wet seasons.
3.3 Principal component analysis (PCA)
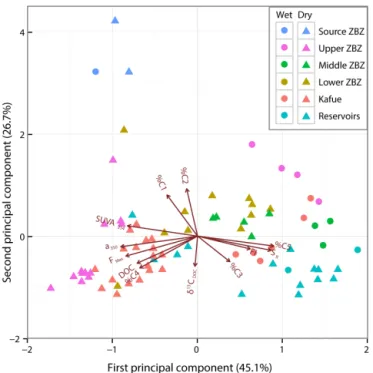
The first two components of the PCA explained 71.7 % of the variance and regrouped the variables into three main clusters (Fig. 7). The first includes %C1, %C2 and samples collected at or near the source of the Zambezi. The second group was defined by %C4 and several variables including DOC, FMax, SUVA254 and a350. Samples from the upper Zambezi and from the Kafue rivers (excluding reservoirs) were mainly lo-cated in this cluster. Finally, %C3 and %C5 were clustered with SRand FI. Samples from reservoirs (including Kariba, Cahora Bassa and Itezhi Tezhi) were almost all in this cluster. Samples collected in the middle and lower Zambezi during both the wet and dry seasons were located between the dis-tinct clusters defined by PARAFAC components and DOM concentration and composition.
4 Discussion
4.1 Identification of PARAFAC components
Humic-like components C1 and C2 are among the most com-mon fluorophores found in freshwaters and are associated with high-molecular-weight and aromatic compounds of ter-restrial origin (Stedmon and Markager, 2005; Yamashita et al., 2008; Walker et al., 2013). Component C4 has been re-ported to be of terrestrial origin (Stedmon and Markager, 2005; Kothawala et al., 2015) or to be a photoproduct of terrestrially derived DOM (Massicotte and Frenette, 2011). The association of %C4 with DOC concentrations and ter-restrial optical indices including a350 and SUVA254 advo-cates for a terrestrial origin of this component (Fig. 7). Con-versely, %C3 and %C5 were negatively correlated with a350 and SUVA254. C3 and C5 components are respectively classi-fied as microbial humic-like and tryptophan-like components related to the production of DOM within aquatic ecosystems
0 1 2 3 4 Zambezi River FTot (R . U .) (a)
Upper Middle Lower
0.0 0.2 0.4 0.6 FM a x C 2 (R . U .) (e) 0.0 0.2 0.4 0.6 0.8 FM a x C 3 (R . U .) (g) 0.0 0.2 0.4 0.6 0.8 FM a x C 4 (R . U .) (i) 0 1000 2000 3000 0.0 0.1 0.2 0.3 0.4
Distance from source (km) FM a x C 5 (R . U .)
Wet seasons (Mainstream) Dry season (Mainstream)
Wet seasons (Tributaries) Dry season (Tributaries)
(k) Kafue River (b) (f) (h) (j) 0 500 1000 1500
Distance from source (km) (l) 0.0 0.5 1.0 1.5 FM a x C 1 (R . U .) (c) (d)
Figure 5. Longitudinal variations in FDOM along the Zambezi
River (left panels) and the Kafue River (right panels) during the wet and the dry seasons. From top to bottom the panels represent: FTot and FMaxfor each PARAFAC component. The diamonds represent samples taken from main tributaries upstream of their confluence with mainstreams.
(Kothawala et al., 2014; Kellerman et al., 2015). Both fluo-rophores can originate from autochthonous primary produc-tion (Yamashita et al., 2008; 2010; Lapierre and Frenette, 2009) or from degradation of terrestrial DOM in the
wa-20 30 40 50 % C 1 Zambezi River
Upper Middle Lower
(a) 0 10 20 30 % C 2 (c) 0 10 20 30 % C 3 (e) 0 10 20 30 % C 4 (g) 0 1000 2000 3000 0 10 20 30
Distance from source (km)
%
C
5
Wet seasons (Mainstream) Dry season (Mainstream)
Wet seasons (Tributaries) Dry season (Tributaries)
(i) Kafue River (b) (d) (f) (h) 0 500 1000 1500
Distance from source (km) (j)
Figure 6. Longitudinal variations in the relative contribution of
PARAFAC component along the Zambezi River (left panels) and the Kafue River (right panels) during the wet and the dry seasons. The diamonds represent samples taken from main tributaries up-stream of their confluence with mainup-streams.
ter column as previously reported in a wide variety of en-vironments as marine (Jørgensen et al., 2011) and lake wa-ters (Kellerman et al., 2015) for C3 and large Arctic rivers (Walker et al., 2013) or small temperate catchments (Sted-mon and Markager, 2005) for C5. The opposite relationship of %C1 and %C2 vs. %C3 (Fig. 7) suggests that C3 would be the result of the transformation of terrestrial components C1 and C2 through biological activity in the water column as suggested by Jørgensen et al. (2011). The distribution of samples along PC1 is thus likely controlled by the transi-tion from terrestrial DOM with a high degree of aromaticity
Figure 7. Graphical representation of PCA results, including
load-ings plot for the input variables and scores plot for water samples collected during the wet (circles) and dry (triangles) seasons. Water samples from the Zambezi River (ZBZ) were classified according to its source and the three major segments of the Zambezi Basin. Sam-ples from reservoirs (i.e., Kariba, Cahora Bassa and Itezhi Tezhi reservoirs) were classified together.
and humic content (negative loadings) to less aromatic DOM produced within the aquatic ecosystem by the degradation of terrestrial DOM during transport and/or by autochthonous sources (positive loadings). Regarding PC2, %C1 and %C2 were also in strong contrast to δ13CDOC. Considering the highest level of %C1 and %C2 at the source of the Zambezi and suggesting that δ13CDOCwas primarily controlled by the vegetation gradient along the mainstem from C3 forest to-ward mixed C3–C4 savannah, this suggests that land cover influences DOM in the river network.
4.2 Relative contribution of C3and C4plants to the
DOM pool
The δ13CDOCvalues in the Zambezi Basin were in the range of data reported for other African river systems, being higher than those measured in C3 tropical rainforest catchments such as the Congo (Spencer et al., 2009; Bouillon et al., 2014), the Ogooué (Lambert et al., 2015) or the Nyong rivers (Brunet et al., 2009), but similar to catchments with signifi-cant areas of C4vegetation (e.g., savannah) such as the Tana (Tamooh et al., 2012), the Niger (Lambert et al., 2015) or the Betsiboka and Rianilia rivers (Marwick et al., 2014).
The increase in δ13CDOC in the Zambezi, especially marked along the first stations, was consistent with the
veg-etation gradient along the mainstem, where upstream C3 for-est ecosystems quickly shift towards mixed C3–C4 grass-land and woodgrass-land/shrubgrass-land ecosystems that dominate in the basin (Fig. S2). δ13CDOCdid not show marked depletion in surface waters of reservoirs, suggesting that phytoplank-ton production had little net effect on δ13CDOC (Bouillon et al., 2009; Tamooh et al., 2012). In addition to an increased contribution from C4 vegetation, the downstream increase in δ13CDOC could also partially result from differences in the δ13C composition of C3 vegetation at the basin scale. Indeed, δ13C values of C3 plants increase with decreasing mean annual precipitation (MAP; Kohn, 2010) and MAP in the Zambezi strongly varies from > 2000 mm yr−1 in the northern part of the basin to < 500 mm yr−1 in the south-ern part (Chenje, 2000). Using high-resolution maps of MAP (Hijmans et al., 2005); a digital elevation model at 3 arcsec resolution computed by the HydroSHEDS mapping product (http://hydrosheds.cr.usgs.gov/index.php); and the proposed equation of Kohn (2010) that estimates the δ13C signature of C3vegetation based on MAP, altitude and latitude, we esti-mated an average value of −27.1 ‰ and a range of variation from −29.3 to −26.0 ‰ for the C3vegetation of the Zambezi Basin (Fig. S3). This shift of 3.3 % is smaller than the ob-served shift of ∼ 8 % in the Zambezi River, indicating that the increase in δ13CDOCis to a large extent due to increased con-tribution from C4 vegetation. As a first approximation and using values of −27.1 ‰ for C3plants (calculated above) and
−12.1 ‰ for C4plants (Tamooh et al., 2012), we found that DOM in the Zambezi Basin was mainly from C3origin, with a relative contribution of ∼ 69 and ∼ 75 % for DOC during the wet and dry period, respectively.
4.3 Seasonal and spatial variability in downstream gradients in DOM concentration and composition Altogether, data showed clear changes in the downstream gradients of DOM concentration and composition, both sea-sonally and spatially. In addition to the vegetation gradient, these changes were essentially controlled by three main fac-tors: WRT and connectivity with wetlands/floodplains, both highly dependent on seasonal variations in water level (and discharge), and water retention by lakes/reservoirs that is more independent of seasonal variations in water level. 4.3.1 Land cover and hydrological connectivity with
wetlands/floodplains
The DOM at the source of the Zambezi was clearly distinct from the rest of the basin, independent of the hydrological period (Fig. 6), with a strong aromatic character (highest SUVA254), a high degree of molecules with elevated molec-ular weight (lowest SR)and low δ13CDOC. The shift in land cover (see Fig. S2) was reflected in the DOM gradient from the source station of the Zambezi to the next sampling site, and marked by an increase in SR, δ13CDOC and a decrease
in SUVA254. This pattern is consistent with the role of forest in releasing more aromatic DOM of high molecular weight than other vegetation types in tropical freshwaters (Lambert et al., 2015).
Downstream, the variability in the optical properties of DOM between wet and dry seasons indicated sea-sonal changes in the sources of riverine DOM in relation with changes in water level and connectivity with wet-lands/floodplains. The high SUVA254and low SRvalues dur-ing the wet seasons indicate the mobilization of fresh aro-matic DOM of high molecular weight due to the increased water flow through DOM-rich upper soil horizons during high-flow periods (Striegl et al., 2005; Neff et al., 2006; Mann et al., 2012; Bouillon et al., 2014). Wetlands and flood-plains were the main sources of terrestrial DOM at the basin scale during wet seasons, as shown by the relationships be-tween DOC and wetland extent (Fig. 4). Among the different terrestrial humic-like components, C4 was the most affected by fluctuations in the connectivity with wetlands/floodplains. The increase in the relative contribution of C4 suggests that this component was mobilized in greater proportion relative to others (Fig. 6). This observation is consistent with a re-cent study conducted in boreal streams, in which a compo-nent similar to C4 was found to increase relative to other humic-like fluorophores (equivalent to C1 and C2) in stream waters during the peak spring melt due to the higher abun-dance of this component in uppermost soil horizons of wet-lands (Kothawala et al., 2015). The longitudinal and seasonal variations in %C4 in the upper Zambezi are consistent with the hypothesis that C4 is mainly produced in the upper soil horizons of wetlands/floodplains and therefore preferentially mobilized during high-flow periods.
4.3.2 WRT modulates the downstream patterns of DOM
During the dry season, DOM was characterized by lower SUVA254 and higher SR values, indicating the transport of compounds of lower aromaticity and lower average molecu-lar weight compared to high-flow periods. The difference in downstream gradients of DOM compared to the wet seasons can be explained in part by the loss of connectivity between rivers and riparian wetlands/floodplains and the deepening of hydrological flow paths through DOM-poor deeper sub-soil horizons during the dry season (e.g., Striegl et al., 2005; Bouillon et al., 2014). Changes in connectivity with wetland during the dry season were also found to strongly impact CO2 and CH4 distribution in the Zambezi (Teodoru et al., 2015). That being said, the considerable decrease in water discharge during dry/base-flow period compared to wet/high-flow periods (Fig. 2) likely leads to a decrease in water veloc-ities and subsequently to an increase in water residence time, allowing a more efficient degradation of terrestrial DOM along a given section. For illustration, the preferential down-stream loss of a350compared to DOC in the upper Zambezi,
C ha vu m a (5 75 km ) V ic to ria F al ls (1 51 0 km ) K ar ib a D am (2 00 0) km ) Z am be zi D el ta (3 08 0 km ) 0 2´105 4´105 6´105 8´105 D O C ex po rt (k g d -1) Wet seasons Dry season +21% -95% -97% +1110% -52% Kariba Reservoir
Figure 8. DOC exports calculated at different locations along the
Zambezi River during the wet and the dry seasons. Vertical arrows represent changes in DOC exports at the same location between wet and dry seasons. Diagonal changes represent longitudinal vari-ations.
associated with a gradual decrease in SUVA254and increase in SR, is strong evidence of the preferential loss of the terres-trial and aromatic fraction of DOM through photodegrada-tion (e.g., Spencer et al., 2009; Weyhenmeyer et al., 2012). The stable level of FMax of C3 suggests a continuous sup-ply of this component, likely due to microbial degradation of terrestrial DOM. In addition, the increase in WRT could fa-vor the accumulation of DOM from autochthonous sources as suggested by higher values of FI and the gradual increase in FMaxfor C5 (Figs. 3 and 4). Flushing during high-flow pe-riods perturbs the downstream gradient of DOM established during base flow because (1) increasing water level mobi-lizes a greater proportion of terrestrial DOM and (2) higher water velocities increases the travel distance of humic and aromatic terrestrial compounds before removal due to micro-bial and photochemical degradation processes and limits the accumulation of autochthonous DOM in the water column. 4.3.3 Retention of water by lakes/reservoirs
Longitudinal patterns of DOM were affected by the pres-ence of reservoirs where DOM was characterized by low aro-maticity and molecular weight and higher microbial contri-bution independent of water level fluctuations (Figs. 5 and 7). The net loss of DOC and the preferential loss of the colored and aromatic fraction of DOM (based on a350and SUVA254, Fig. 3) in lakes and reservoirs have been previously docu-mented (Hanson et al., 2011; Köhler et al., 2013) and at-tributed to the combination of several processes including flocculation, photochemical and microbial degradation (Cory et al., 2007; von Wachenfeldt and Tranvik, 2008; Köhler et
Table 2. Temporal variations in DOM properties measured at the outlet of the Kariba Reservoir during an almost 2-year monthly sampling
(from February 2012 to November 2013).
DOC δ13CDOC a350 SUVA254 SR %C1 %C2 %C3 %C4 %C5
(mg L−1) (‰) (m−1) (L mgC−1m−1) Min 2.00 −23.96 1.00 1.39 1.010 27.7 12.2 16.1 4.0 12.3 Max 2.60 −22.26 2.50 3.11 1.428 36.5 16.6 26.2 13.8 35.9 Mean 2.22 −23.08 1.60 2.02 1.185 34.1 15.2 24.1 9.3 17.3 SD 0.17 0.37 0.44 0.43 0.141 2.4 1.2 2.7 3.1 6.2 n 20 20 12 12 12 12 12 12 12 12
al., 2013; Kothawala et al., 2014). Although we were not able to estimate the relative contribution of these mechanisms, our results indicate that the humic-like fractions of DOM (C1– C4) were more susceptible to degradation compared to the protein-like fraction (C5), an observation consistent with re-cent studies carried out in boreal lakes (Kothawala et al., 2014). The level of fluorescence of C5 could be addition-ally sustained by the FDOM from primary producers such as macrophytes (Lapierre and Frenette, 2009) or phytoplankton (Yamashita et al., 2008), which also leads to low values of the partial pressure of CO2 below atmospheric equilibrium in the Kariba and Cahora Bassa reservoirs, while rivers (i.e., excluding reservoirs) displayed CO2 supersaturated condi-tions with respect to atmospheric equilibrium (Teodoru et al., 2015).
In agreement with others studies (e.g., Hanson et al., 2011), the effects of reservoirs on the fate of DOM were re-lated to their specific WRT. The Itezhi Tezhi Reservoir had little effect on longitudinal patterns of DOM, as also sug-gested by a recent study (Zürbrugg et al., 2013), likely due to its relatively low WRT (0.7 years; Kunz et al., 2011) com-pared to the Kariba (5.7 years; Magadza, 2010) and the Ca-hora Bassa (∼ 2 years; Davies et al., 2000) reservoirs. The DOC concentrations upstream and downstream of the Ca-hora Bassa Reservoir were similar but DOM composition ex-hibited significant changes within the reservoir compared to upstream and downstream stations, suggesting a balance be-tween loss and production of new compounds. In fact, the Kariba Reservoir was the most important reservoir respon-sible for the perturbation of the longitudinal DOM gradient. The seasonal variability of DOM at the outlet of the Kariba Reservoir, in terms of both concentration and composition, was drastically reduced compared to the seasonal patterns observed in the upper Zambezi (Figs. 3 and 5). This was also illustrated by data from an almost 2-year monitoring of the Zambezi River 70 km downstream of the Kariba Dam, show-ing that the terrestrial fraction of DOM leavshow-ing the reservoir has undergone extensive transformation (Table 2). The role of lakes/reservoirs in lowering the seasonality of DOC in river network has also been evidenced in temperate and bo-real streams and rivers in Sweden (Winterdahl et al., 2014).
Beyond their role as hotspots for DOM processing and mineralization, lakes/reservoirs act as a hydrological buffer and reduce the temporal variability of downstream water flow (Goodman et al., 2011; Lottig et al., 2013). Except for some isolated events, water discharge remained constant at Kariba Dam due to hydropower management (Fig. 2). Combined with the low temporal variability in DOM con-tent (Table 2), DOC fluxes at the outlet of the Kariba Reser-voir were relatively invariant and ranged between 8.3 × 10⁷ and 9.7 × 10⁷kg yr−1. This results in a 2-fold decrease in DOC fluxes during the wet seasons between upstream in-puts from the upper Zambezi and export at the outlet of the Kariba Reservoir, but in an increase by a factor of 12 dur-ing the dry season (Fig. 8). From a longitudinal perspective, lakes/reservoirs can thus shift from DOM sources to sinks relative to upstream ecosystems while reducing the tempo-ral variation of DOM fluxes and composition to downstream ecosystems. That being said, DOM losses were largely off-set during the wet seasons by inputs from the Kafue and the Shire rivers as well as from wetlands in the lower Zambezi (Figs. 3 and 8). Therefore, the spatial arrangement of the dif-ferent elements that constitute large river networks such as lakes/reservoirs, wetlands/floodplains and large tributaries is a key aspect in controlling DOM export at the basin scale. 4.4 Comparison with others rivers
The results of this study are similar to those reported in large rivers from other biomes regarding (1) the role of peak flow periods in exporting a greater portion of terres-trial aromatic and humic DOM (Neff et al., 2006; Duan et al., 2007; Holmes et al., 2008; Walker et al., 2013; Bouillon et al., 2014), (2) the disproportionate importance of ripar-ian wetlands and floodplains in regulating in-stream chem-istry (Fiebig et al. 1990; Dosskey and Bertsch, 1994; Hin-ton et al., 1998; Battin, 1998; Hanley et al., 2013; Abril et al., 2014; Borges et al., 2015b) and (3) the reactivity of ter-restrial DOM during its transport (Massicotte and Frenette, 2011; Cawley et al., 2012; Wehenmeyer et al., 2012). How-ever, while changes in temperature have been suggested as a secondary factor impacting DOM patterns in temperate and boreal streams and rivers (Kothawala et al., 2014; Winterdahl et al., 2014; Raymond et al., 2015), changes in longitudinal
DOM patterns in the Zambezi Basin were only controlled by changes in hydrology. Indeed, water temperatures were sys-tematically elevated with values mainly ranging from 25 to 29◦C (data not shown) and no significant patterns were ap-parent between the contrasting seasons.
Our study clearly illustrates that the DOC in a given station is the legacy of upstream sources and their degree of process-ing durprocess-ing transport, and suggests that WRT is a major driver controlling the fate of DOM in freshwaters (the latter re-sulting from the competition between transport and degrada-tion processes). Seasonal changes in DOM concentradegrada-tion and composition in large rivers assessed by monitoring programs are often explained by vertical changes in DOM sources mo-bilized during high-flow and base-flow conditions, i.e., shal-low vs. deep sources along the soil profile (Neff et al., 2006; Mann et al., 2012; Bouillon et al., 2014). Our results show that the upstream degradation history of DOM during tran-sit should also be taken into consideration, especially during base-flow periods. Given the strong reactivity of fresh ter-restrial humic DOM exported during high-flow periods (e.g., Holmes et al., 2008; Mann et al., 2012) and the ability of large hydrological events to transport DOM downstream over large distances (Raymond et al., 2015), the functioning of large rivers at the seasonal scale and their impacts on receiv-ing ecosystems (e.g., coastal waters) should deserve more at-tention.
Data availability
The digital elevation model HydroSHEDS (Lehner et al., 2008) is available at http://hydrosheds.cr.usgs.gov/index. php. Climatic data (including mean annual precipitation, Hij-mans et al., 2005) are available at http://www.worldclim.org/. The Global Lakes and Wetlands database (Lehner and Döll, 2004) is available at http://www.worldwildlife.org/pages/ global-lakes-and-wetlands-database.
The Supplement related to this article is available online at doi:10.5194/bg-13-2727-2016-supplement.
Author contributions. The research project was designed by
Al-berto V. Borges and Steven Bouillon. Field data collection was done by Cristian R. Teodoru and Frank C. Nyoni. CDOM and FDOM measurements were done by Thibault Lambert with the help of François Darchambeau. Data analysis was done by Thibault Lam-bert with the help of Philippe Massicotte for PARAFAC modeling. The manuscript was drafted by Thibault Lambert and was com-mented, amended and approved by all co-authors.
Acknowledgements. This work was funded by the European
Research Council (ERC-StG 240002 AFRIVAL), the Fonds Na-tional de la Recherche Scientifique (FNRS, FluoDOM J.0009.15),
and the Research Foundation Flanders (FWO-Vlaanderen, travel grants to CRT). We thank Christiane Lancelot (Université Libre de Bruxelles) for access to the Perkin-Elmer UV/Vis 650S and two anonymous reviewers for constructive comments on the previous version of the manuscript. Thibault Lambert is a postdoctoral researcher at the FNRS. Alberto V. Borges is a senior research associate at the FNRS.
Edited by: M. Sarin
References
Abril, G., Martinez. J. M., Artigas, L. F., Moreira-Turcq. P., Benedetti, M. F., Vidal, L., Meziane, T., Kin, J. H., Bernardes, M. C., Savoye, N., Deborde, J., Souza, E. L., Albéric, P., Landim de Souza, M. F., and Roland, F.: Amazon River carbon dioxide outgassing fuelled by wetlands, Nature, 505, 395–398, doi:10.1038/nature12797, 2014.
Amon, R. M. W. and Benner, R.: Bacterial utilization of different size classes of dissolved organic matter, Limnol. Oceanogr., 41, 41–51, 1996.
Battin, T. J.: Dissolved organic matter and its optical properties in a blackwater tributary of the upper Oricono river, Venezuela, Org. Geochem., 28, 561–569, 1998.
Borcard, D., Gillet, F., and Legendre, P.: Numerical ecology with R, Springer New York, New York, 306 pp., doi:10.1007/978-1-4419-7976-6, 2011.
Borges, A. V., Darchambeau, F., Teodoru, C. R., Marwick, T. R., Tamooh, F., Geeraert, N., Omengo, F. O., Guerin, F., Lambert, T., Morana, C., Okuku, E., and Bouillon, S.: Globally signifi-cant greenhouse-gas emissions from african inland waters, Nat. Geosci., 8, 637–642, doi:10.1038/ngeo2486, 2015a.
Borges, A. V., Abril, G., Darchambeau, F., Teodoru, C. R., Deborde, J., Vidal, L. O., Lambert, T., and Bouillon, S.: Divergent biophys-ical controls of aquatic CO2and CH4in the World’s two largest rivers, Sci. Rep., 5, 15614, doi:10.1038/srep15614, 2015b. Bouillon, S., Abril, G., Borges, A. V., Dehairs, F., Govers, G.,
Hughes, H. J., Merckx, R., Meysman, F. J. R., Nyunja, J., Os-burn, C., and Middelburg, J. J.: Distribution, origin and cycling of carbon in the Tana River (Kenya): a dry season basin-scale sur-vey from headwaters to the delta, Biogeosciences, 6, 2475–2493, doi:10.5194/bg-6-2475-2009, 2009.
Bouillon, S., Yambélé, A., Gillikin, D. P., Teodoru, C. R., Darcham-beau, F., Lambert, T., and Borges, A. V.: Contrasting biogeo-chemical characteristics of the Oubangui River and tributaries (Congo River basin), Sci. Rep., 4, 1–10, doi:10.1038/srep05402, 2014.
Brunet, F., Dubois, K., Veizer, J., Nkoue Ndondo, G. R., Ndam Ngoupayou, J. R., Boeglin, J. L., and Probst, J. L.: Terrestrial and fluvial carbon fluxes in a tropical watershed: Nyong basin, Cameroon, Chem. Geol., 265, 563–572, 2009.
Cawley, K. M., Wolski, P., Mladenov, N., and Jaffé, R.: Dissolved organic matter biogeochemistry along a transect of the Okavango delta, Bostwana, Wetlands, 32, 475–486, doi:10.1007/s13157-012-0281-0, 2012.
Chenje, M.: State of the Environment Zambezi Basin 2000, SADC, IUCN, ZRA, and SARDC, Maseru, Lusaka and Harare, 334 pp., ISBN 978-1-77910-009-2, 2000.
Cole, J. J., Prairie, Y. T., Caraco, N. F., McDowell, W. H., Tranvik, L. J., Striegl, R. G., Duarte, C. M., Kortelainen, P., Downing, J. A., Middelburg, J. J., and Melack, J.: Plumbing the global carbon cycle: integrating inland waters into the terrestrial carbon budget, Ecosystems, 10, 171–184, 2007.
Cory, R. M., McKnight, D. M., Chin, Y. P., Miller, P., and Jaros, C. L.: Chemical characteristics of fulvic acids from Arc-tic surface waters: Microbial contributions and photochemi-cal transformations, J. Geophys. Res.-Biogeo., 112, G04S51, doi:10.1029/2006JG000343, 2007.
Davies, B. R., Beilfuss, R. D., and Thoms, M. C.: Cahora Bassa retrospective, 1974-1997: effects of flow regulation on the lower Zambezi River, Verh. Int. Ver. Theor. Angew., 20, 2149–2157, 2000.
del Giorgio, P. A. and Pace, M. L.: Relative independence of dis-solved organic carbon transport and processing in a large tem-perate river: the Hudson River as both pipe and reactor, Limnol. Oceanogr., 53, 185–197, 2008.
Dosskey, M. G. and Bertsch, P. M.: Forest sources and pathways of organic matter transport to a blackwater stream: a hydrologic approach, Biogeochemistry, 24, 1–19, 1994.
Duan, S., Bianchi, T., and Sampere, T. P.: Temporal variability in the composition and abundance of terrestrially-derived dissolved organic matter in the lower Mississippi and Pearl Rivers, Mar. Chem., 103, 172–184, doi:10.1016/j.marchem.2006.07.003, 2007.
Fasching, C., Behounek, B., Singer, G. A., and Battin, T. J.: Micro-bial degradation of terrigenous dissolved organic matter and po-tential consequences for carbon cycling in brown-water streams, Sci. Rep., 4, 4981, doi:10.1038/srep04981, 2014.
Fiebig, D. M., Lock, M. A., and Neal, C.: Soil water in the riparian zone as a source of carbon for a headwater stream, J. Hydrol., 116, 217–237, 1990.
Goodman, K. J., Baker, M. A., and Wurtsbaugh, W. A.: Lakes as buffers of stream dissolved organic matter (DOM) vari-ability: temporal patterns of DOM characteristics in moun-tain stream-lake systems, J. Geosphys. Res., 116, G00N02, doi:10.1029/2011JG001709, 2011.
Hanley, K., Wollheim, W. M., Salisbury, J., Huntington, T., and Aiken, G.: Controls on dissolved organic carbon quantity and chemical character in temperate rivers of North America, Global Biogeochem. Cy., 27, 492–504, doi:10.1002/gbc.20044, 2013. Hanson, P. C., Hamilton, D. P., Stanley, E. H., Preston, N.,
Lang-man, O. C., and Kara, E. L.: Fate of allochthonous dissolved or-ganic carbon in lakes: a quantitative approach, PLoS ONE, 6, e21884, doi:10.1371/journal.pone.0021884, 2011.
Helms, J. R., Stubbins, A., Ritchie, J. D., Minor, E. C., Kieber, D. J., and Mopper, K.: Absorption spectral slopes and slope ratios as indicators of molecular weight, source, and photobleaching of chromophoric dissolved organic matter, Limnol. Oceanogr., 53, 955–969, 2008.
Hijmans, R. J., Cameron, S. E, Parra, J. L., Jones, P. G., and Jarvis, A.: Very high resolution interpolated climate surfaces for global land areas, Int. J. Climatol., 25, 1965–1978, available at: http: //www.worldclim.org/ (last access: 2 October 2015), 2005. Hinton, M. J., Schiff, S. L., and English, M. C.: Sources and
flow-paths of dissolved organic carbon during storms in two forested watershed of the Precambrian Shield, Biogeochemistry, 41, 175– 197, 1998.
Holmes, R. M., McClelland, J. W., Raymond, P. A., Frazer, B. B., Peterson, B. J., and Stieglitz, M.: Lability of DOC transported by Alaskan rivers to the arctic ocean, Geophys. Res. Lett., 35, L03402, doi:10.1029/2007gl032837, 2008.
Jaffé, R., McKnight, D., Maie, N., Cory, R., McDowell, W. H., and Campbell, J. L.: Spatial and temporal variations in DOM compo-sition in ecosystems: The importance of long-term monitoring of optical properties, J. Geophys. Res.-Biogeo., 113, G04032, doi:10.1029/2008jg000683, 2008.
Johnson, M S., Couto, E. G. Abdo, M., and Lehmann, J.: Fluores-cence index as an indicator of dissolved organic carbon qual-ity in hydrologic flowpaths of forested tropical watersheds, Bio-geochemistry, 105, 149–157, doi:10.1007/s10533-011-9595-x, 2011.
Jørgensen, L., Stedmon, C. A., Kragh, T., Markager, S., Middelboe, M., and Søndergaard, M.: Global trends in the fluorescence characteristics and distribution of ma-rine dissolved organic matter, Mar. Chem., 126, 139–148, doi:10.1016/j.marchem.2011.05.002, 2011.
Kellerman, A. M., Kothawala, D. N., Dittmar, T., and Tran-vik, L. J.: Persistence of dissolved organic matter in lakes re-lated to its molecular characteristics, Nat. Geosci., 8, 454–457, doi:10.1038/ngeo2440, 2015.
Köhler, S. J., Kothawala, D., Futter, M. N., Liungman, O., and Tran-vik, L.: In-lake processes offset increased terrestrial inputs of dis-solved organic carbon and color in lakes, PLoS ONE, 8, e70598, doi:10.1371/journal.pone.0070598, 2013.
Kohn, J. M.: Carbon isotope compositions of terrestrial C3 plants as indicators of (paleo)ecology and (paleo)climate, P. Natl. Acad. Sci. USA, 107, 19691–19695, 2010.
Kothawala, D. N., Stedmon, C. A., Müller, R. A., Weyhenmeyer, G. A., Köhler, S. J., and Tranvik, L. J.: Controls of dissolved or-ganic matter quality: Evidence from a large-scale boreal lake sur-vey, Glob. Change Biol., 20, 1101–1114, doi:10.1111/gcb.12488, 2014.
Kothawala, D. N., Ji, X., Laudon, H., Ågren, A., Futter, M. N., Köhler, S. J., and Tranvik, L. J.: The relative influence of land cover, hydrology, and in-stream processing on the composition of dissolved organic matter in boreal streams, J. Geosphys. Res-Biogeo., 120, 1491–1505, doi:10.1002/2015JG002946, 2015. Kunz, M. J., Wuest, A., Wehrli, B., Landert, J., and Senn, D. B.:
Impact of a large tropical reservoir on riverine transport of sed-iment, carbon and nutrients to downstream wetlands, Water Re-sour. Res., 47, W12531, doi:10.1029/2011WR010996, 2011. Lambert, T., Darchambeau, F., Bouillon, S., Alhou, B., Mbega,
J.-D., Teodoru, C. R., Nyoni, F. C., and Borges, A. V.: Landscape control on the spatial and temporal variability of chromophoric dissolved organic matter and dissolved organic carbon in large African rivers, Ecosystems, 18, 1224–1239, doi:10.?1007/?s10021-015-9894-5, 2015.
Lapierre, J. F. and Frenette, J. J.: Effects of macrophytes and terres-trial inputs on fluorescent dissolved organic matter in a large river system, Aquat. Sci., 71, 15–24, doi:10.1007/s00027-009-9133-2, 2009.
Lehner, B. and Döll, P.: Development and validation of a global database of lakes, reservoirs and wetlands, J. Hydrol., 296, 1–22, doi:10.1016/j.jhydrol.2004.03.028, available at: http://www. worldwildlife.org/pages/global-lakes-and-wetlands-database (last access: 15 June 2015), 2004.
Lehner, B., Verdin, K., and Jarvis, A.: New global hydrography de-rived from space borne elevation data, Eos, 89, 93–94, available at: http://hydrosheds.cr.usgs.gov/index.php (last access: 15 June 2012), 2008.
Lottig, N. R., Buffam, I., and Stanley, E. H.: Comparisons of wetland and drainage lake influences on stream dissolved or-ganic concentrations and yields in a north temperate lake-rich re-gion, Aquat. Sci., 75, 619–630, doi:10.1007/s00027-013-0305-8, 2013.
Magadza, C.: Environmental state of Lake Kariba and Zam-bezi River Valley: Lessons learned and not learned, Lakes & Reservoirs: Research & Management, 15, 167–192, doi:10.1111/j.1440-1770.2010.00438.x, 2010.
Mann, P. J., Davydova, A., Zimov, N., Spencer, R. G. M., Davy-dov, S., Bulygina, E., Zimov, S., and Holmes, R. M.: Controls on the composition and lability of dissolved organic matter in Siberia’s Kolyma River basin, J. Geosphys. Res., 117, G01028, doi:10.1029/2011JG001798, 2012.
Marín-Spiotta, E., Gruley, K. E., Crawford, J., Atkinson, E. E., Miesel, J. R., Greene, S., Cardona-Correa, C., and Spencer, R. G. M.: Paradigm shifts in soil organic matter research affect interpretations of aquatic carbon cycling: transcending disci-plinary and ecosystem boundaries, Biogeochemistry, 117, 279– 297, doi:10.1007/s10533-013-9949-7, 2014.
Marwick, T., Borges, A. V., Van Acker, K., Darchambeau, F., and Bouillon, S.: Disproportionate Contribution of Riparian Inputs to Organic Carbon Pools in Freshwater Systems, Ecosystems, 17, 974–989, 2014.
Massicotte, P. and Frenette, J.-J.: Spatial connectivity in a large river system: resolving the sources and fate of dissolved organic mat-ter, Ecol. Appl., 21, 2600–2617, 2011.
Mayaux, P., Bartholomé, E., Fritz, S., and Belward, A.: A new land-cover map of Africa for the year 2000, J. Biogeogr., 31, 861–877, 2004.
Mayorga, E., Aufdenkampe, A. K., Masiello, C. A., Krusche, A. V., Hedges, J. I., Quay, P. D., Richey, J. E., and Brown, T. A.: Young organic matter as a source of carbon diox-ide outgassing from Amazonian rivers, Nature, 436, 538–541, doi:10.1038/nature03880, 2005.
McKnight, D. M., Boyer, E. W., Westerhoff, P. K., Doran, P. T., Kulbe, T., and Andersen, D. T.: Spectrofluorometric character-ization of dissolved organic matter for indication of precursor organic material and aromaticity, Limnol. Oceanogr., 46, 38–48, 2001.
Meybeck, M.: Riverine transport of atmospheric carbon: source, global typology and budget, Water Air Soil Pollut., 70, 443–463, 1993.
Mladenov, N, McKnight, D. M., Macko, S. A., Norris, M., Cory, R. M., and Ramberg, L.: Chemical characterization of DOM in channels of a seasonal wetland, Aquat. Sci., 69, 456–471, doi:10.1007/s00027-007-0905-2, 2007.
Moran, M. A., Sheldon, W. M., and Zepp, R. G.: Carbon loss and optical property changes during long-term photochemical and bi-ological degradation of estuarine dissolved organic matter, Lim-nol. Oceanogr., 45, 1254–1264, 2000.
Neff, J. C., Finlay, J. C., Zimov, S. A., Davydov, S. P., Car-rasco, J. J., Schuur, E. A. G., and Davydova, A. I.: Seasonal changes in the age and structure of dissolved organic carbon in
Siberian rivers and streams, Geophys. Res. Lett., 33, L23401, doi:10.1029/2006GL028222, 2006.
Ohno, T.: Fluorescence inner-filtering correction for determining the humification index of dissolved organic matter, Environ. Sci. Technol., 36, 742–746, doi:10.1021/Es0155276, 2002.
Parks, S. J. and Baker, L. A.: Sources and transport of organic carbon in an Arizona river-reservoir system, Water Resour., 31, 1751–1759, 1997.
Raymond, P. A., Saiers, J. E., and Sobczak W. V.: Hydrolog-ical and biogeochemHydrolog-ical controls on watershed dissolved or-ganic matter transport: pulse-shunt concept, Ecology, 97, 5–16, doi:10.1890/14-1684.1, 2016.
Schlesinger, W. H. and Melack, J. M.: Transport of organic carbon in the world’s rivers, Tellus, 33, 172–187, 1981.
Spencer, R. G. M., Stubbins, A., Hernes, P. J., Baker, A., Mopper, K., Aufdenkampe, A. K., Dyda, R. Y., Mwamba, V. L., Man-gangu, A. M., Wabakanghanzi, J. N., and Six, J.: Photochemi-cal degradation of dissolved organic matter and dissolved lignin phenols from the Congo River, J. Geophys. Res.-Biogeo., 114, G03010, doi:10.1029/2009jg000968, 2009.
Stackpoole, S. M., Stets, E. G., and Striegl, R. G.: The im-pact of climate and reservoirs on longitudinal riverine car-bon fluxes from two major watersheds in the Central and Intermontane West, J. Geophys. Res-Biogeo., 119, 848–863, doi:10.1002/2013JG002496, 2014.
Stedmon, C. A. and Markager, S.: Resolving the variability in DOM fluorescence in a temperate estuary and its catchment unsing PARAFAC, Limnol. Oceanogr., 50, 686–697, 2005.
Stedmon, C. A. and Bro, R.: Characterizing dissolved organic mat-ter fluorescence with parallel factor analysis: a tutorial, Limnol. Oceanogr.-Meth., 6, 572–579, 2008.
Stedmon, C. A., Markager, S., and Bro, R.: Tracing dissolved organic matter in aquatic environments using a new ap-proach to fluorescence spectroscopy, Mar. Chem., 82, 239–254, doi:10.1016/s0304-4203(03)00072-0, 2003.
Striegl, R. S., Aiken, G. R., Domblaser, M. M., Raymond, P. A., and Wickland, K. P.: A decrease in discharge-normalized DOC export by the Yukon River during summer through autumn, Geo-phys. Res. Lett., 32, L21413, doi:10.1029/2005GL024413, 2005. Tamooh, F., Van den Meersche, K., Meysman, F., Marwick, T. R., Borges, A. V., Merckx, R., Dehairs, F., Schmidt, S., Nyunja, J., and Bouillon, S.: Distribution and origin of suspended matter and organic carbon pools in the Tana River Basin, Kenya, Biogeo-sciences, 9, 2905–2920, doi:10.5194/bg-9-2905-2012, 2012. Teodoru, C. R., Nyoni, F. C., Borges, A. V., Darchambeau, F.,
Nyambe, I., and Bouillon, S.: Dynamics of greenhouse gases (CO2, CH4, N2O) along the Zambezi River and major tributaries, and their importance in the riverine carbon budget, Biogeo-sciences, 12, 2431–2453, doi:10.5194/bg-12-2431-2015, 2015. von Wachenfekdt, E. and Tranvik, L. J.: Sedimentation in Boreal
lakes – the role of flocculation of allochthonous dissolved or-ganic matter in the water column, Ecosystems, 11, 803–814, doi:10.1007/s10021-008-9162-z, 2008.
Walker, S. A., Amon, R. M., and Stedmon, C. A.: Variations in high-latitude riverine fluorescent dissolved organic matter: A compar-ison of large Arctic rivers, J. Geosphys. Res-Biogeo., 118, 1689– 1702, doi:10.1002/2013JG002320, 2013.
Ward, N. D., Keil, R. G., Medeiros, P. M., Brito, D. C., Cunha, A. C., Dittmar, T., Yager, P. L., Krusche, A. V., and Richey, J.
E.: Degradation of terrestrially derived macromolecules in the Amazon River, Nat. Geosci., 6, 530–533, doi:10.1038/ngeo1817, 2013.
Ward, N. D., Krusche, A. V., Sawakuchi, H. O., Brito, D. C., Cunha, A. C., Moura, J. M. S., da Silva, R., Keil, R. G., and Richey, J. E.: The compositional evolution of dissolved and particulate organic matter along the lower Amazon River-Óbidos to the ocean, Mar. Chem., 177, 244–256, doi.org/10.1016/j.marchem.2015.06.013, 2015.
Weishaar, J. L., Aiken, G. R., Bergamaschi, B. A., Fram, M. S., Fujii, R., and Mopper, K.: Evaluation of specific ultraviolet ab-sorbance as an indicator of the chemical composition and reactiv-ity of dissolved organic carbon, Environ. Sci. Technol., 37, 4702– 4708, doi:10.1021/es030360x, 2003.
Wellington, J. H.: Southern Africa – a Geographic Study, vol. 1, Physical Geography, Cambridge University Press, Cambridge, 528 pp., 1955.
Weyhenmeyer, G. A., Fröberg, M., Karltun, E., Khalili, M., Kothawala, D., Temnerud, J., and Tranvik, L. J.: Selective de-cay of terrestrial organic carbon during transport from land to sea, Glob. Change Biol., 18, 349–355, doi:10.1111/j.1365-2486.2011.02544.x, 2012.
Winterdahl, M., Erlandsson, M., Futter, M. N., Weyhenmeyer, G. A., and Bishop, K.: Intra-annual variability of organic carbon concentrations in running waters: Drivers along a climatic gradient, Global Biogeochem. Cy., 28, 451–464, doi:10.1002/2013GB004770, 2014.
Yamashita, Y., Jaffé, R., Maie, N., and Tanoue, E.: Assessing the dynamics of dissolved organic matter (DOM) in coastal envi-ronments by excitation emission matrix fluorescence and parallel factor analysis (EEM-PARAFAC), Limnol. Oceanogr., 53, 1900– 1908, 2008.
Yamashita, Y., Scinto, L. J., Maie, N., and Jaffé, R.: Dis-solved organic matter characteristics across a subtropical wet-land’s landscape: application of optical properties in the assess-ment of environassess-mental dynamics, Ecosystems, 13, 1006–1019, doi:10.1007/s10021-010-9370-1, 2010.
Zepp, R. G., Sheldon, W. M., and Moran, M. A.: Dissolved or-ganic fluorophores in southeastern US coastal waters: correc-tion method for eliminating Rayleigh and Raman scattering peaks in excitation–emission matrices, Mar. Chem., 89, 15–36, doi:10.1016/j.marchem.2004.02.006, 2004.
Zurbrügg, R., Suter, S., Lehmann, M. F., Wehrli, B., and Senn, D. B.: Organic carbon and nitrogen export from a tropical dam-impacted floodplain system, Biogeosciences, 10, 23–38, doi:10.5194/bg-10-23-2013, 2013.