Submitted to the 1
stInternational Conference on Energy, Environment And Climate Changes
Using a DNA buiding code to manage the housing stock energy performance
S. MONFILS
J.-M. HAUGLUSTAINE
Energy and Sustainable Development
Dept. of Sciences and Management of the EnvironmentUniversity of Liege (ULg) Liege, Belgium
e-mails: stephane.monfils@ulg.ac.be jmhauglustaine@ulg.ac.be
M. DESCAMPS
ARCADIS engineering company e-mail: descampsmarie@hotmail.comAbstract – The goal of this research is to qualify (and quantify)
the Walloon residential building stock, in order to identify majority typologies which can be considered as representative of the Walloon dwelling stock. This would therefore help us find potential improvement room, strategies of action when it comes to sustainable and large scale renovation of the described typologies. Then the “Reflex” software [1] can be used to determine the most appropriate renovation solutions.
In Belgium, as elsewhere, most of the dwellings have been built before the first oil crisis in the ’70, which brought the first thermal regulations in 1985 in Wallonia. Consequently, lots of old buildings are not (or not at all) properly insulated, are garnished with single-glazed windows, poorly airtight, badly ventilated... In conclusion, the existing building stock is globally old, inefficient and a big energy consumer, in which ways it presents a huge improvement potential of energy savings.
Since 1985, several thermal regulations have been mainly aiming at new buildings. Small and medium scale refurbishments are submitted to few requirements: the Walloon regulation requires maximal values for the thermal transmission coefficient of walls, which corresponds to minimal thermal insulation thickness values required for the only parts of the envelope that are newly built, built again or modified.
Beside the apparent contradiction, renovation can be seen as the future of the building sector. Belgian population growth is quite slow, which indicates we don’t fundamentally “need” to urbanize (given furthermore that the Walloon Code for Territory Landscaping, Town-Planning, Patrimony and Energy recommends a parsimonious use of the ground). Renovation can help reducing urban pressure on the environment and reinforcing the existing spatial structures without having to pay for new urban developments. In addition to that, acting on an existing building helps minimising the impact of the work on the environment, notably by minimising the use of new products and the production of wastes.
In order to give this study a Region-wide dimension, we need to identify priority types of dwelling, based on an
overview of the existing housing stock. Several parameters have been brought out to characterize the dwellings: type of household, of occupancy, living environment, size of the stock, common configurations of dwellings (house / apartment ; detached / semi-detached / row house...), size, age, quality and healthiness of the dwelling, consumptions, type of fuel and boiler used, insulation quality of the walls, roofs, floors or windows... All the data can be crossed to give a complete overview of the stock.
The description of a building can be pursued through an interesting analysis method, developed by searchers of the High School of Lucerne, in the frame of the International Energy Agency (IEA) Annex 50. It is based on the analysis of each typological parameter of a building, and its characterization with a value. The graphical illustration of the analysis method results characterizes each building with a curve, sort of a DNA building code of the edifice.
This representation of a building seems quite useful for a new regulatory requirement that appears with the European EPB legislation: the energy performance certificate, which can be described as an “Energy ID” needed each time when a dwelling is rented or sold. It has no performance goals for the existing buildings, but is supposed to be giving a good picture of the home consumption, so that the new occupant knows what to expect, and which work would be planned in order to improve the global performance of the dwelling.
Keywords-component: typology, energy performance, existing housing stock, priority renovation
I. INTRODUCTION
In Belgium, as elsewhere, history has left its footprint on architecture. Construction techniques have evolved along with industrial and technological progress; materials have become more and more efficient; urban and, later, thermal regulations appeared, then have been reinforced. All of these parameters have obviously had a significant impact on the evolution of typologies, urban aesthetic and architectural characteristics, which are specific to each and every era.
But this historical evolution has another consequence: the development of a growing gap between on one side the ancient houses, poorly insulated, equipped with inefficient systems, over-ventilated because of the lack of airtightness, sometimes subject to structural disorder (which explanation might be found in xylophagous bugs, high humidity rate, general aging of the building, or badly managed refurbishment work...); on the other side, the newly built houses, which respect the on-going regulations and standards, correctly insulated, airtight, and equipped with a controlled ventilation system and an efficient heating system.
II. PROBLEMATIC
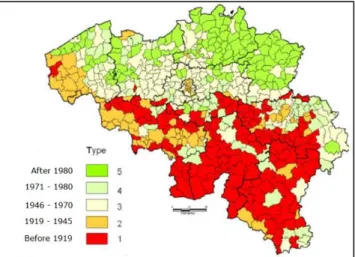
Overall, the Walloon housing stock is mainly made of buildings from the first side of the gap [2]: half of the dwellings were built before 1945 (Figure 1), mainly along the rivers near industrial zones (Figure 2). Then the urban centres grew; individual mobility appeared along with the extensions of the suburban areas. The difference between city and country became blurred.
Figure 1. Dwellings distribution according to their construction period.
Figure 2. Spatial variation of Belgium dwellings ages.
In later years, countless studies have been led, shedding light on the necessity to rationalize the use of the land (given
furthermore that the Walloon Code for Territory Landscaping, Town-Planning, Patrimony and Energy recommends a parsimonious use of the ground), to reduce the urban pressure on environment, by avoiding pointless extensions (maintenance of the existing networks costs) and to limit rural exodus; the drift from the land is responsible for urban depopulation and for the neglected state that characterises deserted urban buildings (Figure 3).
Figure 3. Crossed data: dwellings age and urban zones
Since the first thermal regulations appeared, new buildings are submitted to more and more demanding requirements. The first one (in 1985) only aimed at the envelope insulating performance and at the heating energy needs (taking into account solar and internal gains). In 1996, ventilation was introduced in the requirements, in order to guarantee unpolluted air in the living areas. Then a recent reinforcement added new parameters in the building energy performance calculations [3]: air tightness, efficiency of heating and domestic hot water systems (including production, storage, distribution, emission and regulation steps), electrical auxiliaries and eventual renewable energy production. As far as one can see, the future will of course not lead to any lull: the announced new version of the European EPB regulation foresees that towards 2020, new buildings will have to be “nearly zero energy”.
As far as they are concerned, existing buildings never knew such an evolution. Small and medium scale refurbishments are submitted to few requirements: the Walloon regulation requires maximal values for the thermal transmission coefficient of walls, that corresponds to minimal thermal insulation thickness values for the only parts of the envelope that are newly built, built again or modified [4]. No great revolution is foreseen, so existing building renovation can now be seen as a serious alternative to an expensive, highly regulated new building sector.
Considering that, in Belgium, around 98% of the energy is used in old existing dwellings and the other 2% in new efficient ones [5], where is the improvement potential?
In order to stimulate the renovation sector, real political help measures are needed, more than just financial grants. A global European goal is to reduce the energy consumption of the residential stock by 20%, to reduce the greenhouse gas emissions by 20% and introduce 20% of renewable energy in
the global energy production by 2020. It is in this frame that the “Reno2020” action has been started in 2009 [6], with different objectives:
First, Walloon existing housing stock has been analyzed in order to define its main typologies, based on parameters that are the age, insulation level, size, configuration, localization, structural characteristics, occupation type...
Then three “priority” typologies have been distinguished, most largely represented on the Walloon territory and presenting a wider room for improvement, as far as their energetic efficiency, quality and safety are concerned.
And three existing buildings have been chosen to be renovated, in comparison with the first two points conclusions, with the objective to develop solutions and (industrialized) techniques that could be applied to large scale renovation projects or lead to a large number of small scale renovations, in a sustainable development perspective.
III. ANALYSIS OF THE WALLOON STOCK
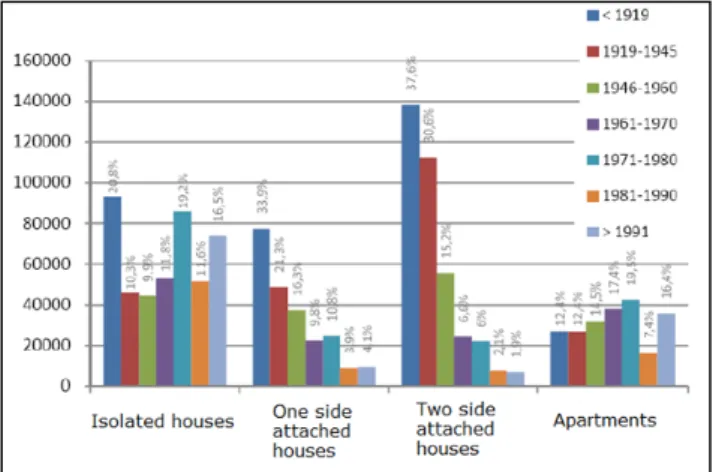
In the Walloon region, more than 4 out of 5 dwellings are single-family homes (Figures 4 and 5).
Figure 4. Dwellings distribution according to their configuration
Figure 5. Crossed data: dwellins age and configuration
Usually, preference rather goes to an isolated house, built in the quiet country or in a suburban family neighbourhood, than to the city centres although equipments and services are nearer. This kind of dwellings is amongst the most recent
ones, they often are better thermally insulated and of better quality; therefore, they haven’t been kept in the “priority” typologies.
Urban and “Near-urban” zones are piling up rehabilitation needs, nowadays: old and dense dwellings, which present a serous number of safety problems (notably the apartments created in ancient homes, divided at the time of a renovation work in several dwelling units). Their refurbishment may play a key role in order to improve a district image and promote a “return to the city” movement.
7 out of 10 households own their dwelling; they are, in general, harder to please as far as their home is concerned and have superior living means that are often translated in a higher quality dwelling. More problematic places should be found in tenants’ houses or apartments, especially social dwellings that have a higher turnover, often synonymous of lack of comfort, bad quality of unsafe feeling. Those building indeed suffer more often from humidity problems or a lack of acoustic insulation.
Apart from more recent buildings, the energetic quality of the major part of the Walloon existing building stock is relatively poor [7]. 77% of them are equipped with a central heating system, whether it is used to heat a single dwelling or an apartments building. They mainly use fuel oil as heating energy vector (57%), natural gas (38%) or electricity (5%), and their consumption is on average higher than a local heating system consumption, whether it is fed with wood (41%), natural gas (26%) or electricity (20%). Renewable energy sources (solar energy, heat pumps, pellet stoves...) still represent a weak proportion of the global energy use.
The thermal insulation of a major part of the existing buildings have to be improved, whether it is part or all of it, so this parameter doesn’t seem like a priority criteria in the choice of a to-be-renovated typology.
About one of two interviewed people declares that his roof is completely thermally insulated, and ten more percents believe that it is at least partly insulated. A more deep analysis can though reveal that overall only ten percents of all roofs are sufficiently protected from heat losses, according to actual standards and regulations (Figure 6).
Figure 6. Roof insulation data
On the same level, less than 30% of the vertical walls are completely insulated. And in the rare situations where one gets to know the actual insulation thickness in old buildings, it is even more exceptional when this thickness reaches the average 8 cm needed according to the EPB regulation (Figure 7).
Figure 7. Walls insulation data
The most spread improvement work that is usually applied to buildings nowadays is the change of windows, mainly because those walls are colder and less comfortable in ancient, garnished with single-glazed windows buildings. That is why 80% of the interviewed citizens state that at least one of their building windows has double glazing (Figure 8). This proportion obviously falls down when one tries to only consider buildings that completely respect the on-going regulations on windows U-value.
Figure 8. Windows insulation data
Globally, edifices structure is of good quality: their roofs are water-tight, their woodwork is stable, and rain evacuation system is in a good condition in nearly 9 out of 10 of them. On the comfort level, there are still very few dwellings which have no access to drinking water, or are deprived of a bathroom, interior toilets or a domestic hot water production system.
IV. DRAWING A DNA BUILDING CODE
A building description can be refined through an interesting analysis method, developed by searchers of the High School of Lucerne, in the frame of Annex 50 of the International Energy Agency (IEA). It is based on the analysis of each typological parameter of a building, and its characterization with a value. The graphical illustration of the analysis method results characterizes each building with a curve, sort of a DNA building code of the edifice.
Some prior information can help roughly identify the edifice. The type of building, its assignment, the year it has
been built (or renovated when it has been), its environment can also provide pieces of information on the construction techniques, the materials that have been used, the potential presence of insulation materials...
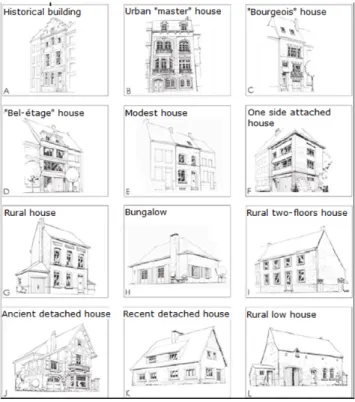
The facade typologies that are shown hereunder, with a short description, come from the 1986 national RD-Energy program [8], but are still topical.
Figure 9. Main typology facades
The environment (urban, near-urban suburb, rural…) characterises the building in a wider context. For instance, an attached house, inserted in a block doesn’t necessarly have the same architecture than another attached house part of a row (Figure 10).
Facade orientation, possible presence of an exterior private space (and its access), topography and eventual urban regulations may also play an important role in the building analysis.
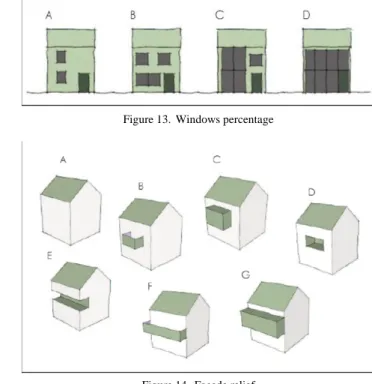
Then the building volumetry should also be characterized: number of volumes (principal, annexe, garage…), type of roof (tilted or flat, ridge line orientation in comparison to the road), possible access to flat roofs so they can be used as a terrace…, type of environment on which the inferior floor of each volume is built (cellars, ventilated caves, soil…), presence or absence of attics or underground spaces (including the proportion of them that are occupied), windows (orientation, alignment – see Figure 11 –, vertical or horizontal position– see Figure 12 –, percentage of the facade covered by glazings – see Figure 13 –), relief (balconies, loggias, terraces – see Figure 14 –). All of these parameters are conditioning the renovation strategy that can be applied to the building.
Figure 10. Environment configurations
Figure 11. Windows alignment
Figure 12. Windows configuration
Figure 13. Windows percentage
Figure 14. Façade relief
The internal organization of the building and its characteristic dimensions are one more step towards a better knowledge of it. The number of levels, for instance, is important in order to determine its size, and will be compared to its volumetry. It is all about understanding how spaces are organised in the dwelling, where are located the accesses and horizontal and vertical circulations. The structural framework of the building can be then approached through simple principles.
One also has to define the walls and components of the building, helped in this step by a list of frequently used materials, as well as the different systems that equip the edifice: heating system (central or local, type of fuel, possible extras, type of heat emitters), domestic hot water appliances, electric devices, type of ventilation system installed if there is any, potential air conditioning…
Then, the one who tries and study the edifice should also try to relate the dwelling with the household living habits and their consumptions, through some easy inputs: occupation schedule, number of unoccupied weeks, set temperatures for heating and possible air conditioning, characterization of the regulation system, presence of economic light bulbs, household electrical appliances, annual consumption of fuel and water…
When the encoding part is over, a summary characterizes the building through an automatically generated curve. The questionnaire has two types of questions: specific and generic characteristics of the building. The first ones are open question, describing the building in itself, and are not material to be used to define an architectural typology. They are specific to the analysed dwelling, and more quantitative (for example: areas, heights…), whereas the generic characteristics are more general, and form a package of
chosen criterias used to define the architectural typologies. The summary part only considers those last characteristics, each pictured as a vertical line of empty dots [9]. As shown in the following Figure 15, the answer given to a question blackened one of the dots. The user has the choice to answer the question or not (he might not know it, as often when it comes to describing an existing house); if he doesn’t, no dot will be blackened.
Figure 15. Example of DNA code results
One has to analyze a sufficient amount of dwellings in order to compare the curves (and/or the values) obtained for each and every one of them and be able to search for similarities or differences that could lead to the definition of typologies.
Here are the three « priority » typologies chosen out of the study:
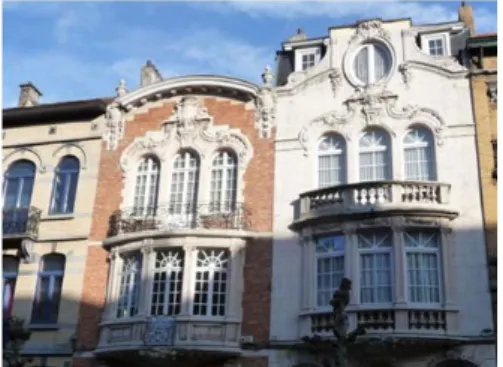
1. The urban “master” house (which represents about 16% of the houses built before 1991), usually from the beginning of the 20th century, attached, medium to large size, with high ceilings, at least 3 used levels. They often have lots of architectural details, decorations, balconies on the front facade, and more recent (and less valuable) volumes added to the back façade (Figure 16). One can find traditional and industrial components in those buildings, according to the neighborhood and the luxury of the edifice.
Figure 16. Example of luxurious “master” houses
2. The working-class house (more largely represented), row-type, relatively old, characterized by really small volumes, low ceilings, with 2 rooms by level and a simple building technique, is often in bad condition, with safety problems and coal heating systems, even if natural gas is now available in the street (Figure 17).
Figure 17. Example of a modest “working-class” house
3. Then there are the buildings that have been divided in several apartments (Figure 18), which can be found in different general shapes and ages (it depends on the age of the building before it has been divided). They are mainly rented, filling by the way a part of the lack in social dwellings. Generally, these buidlings were not conceived for several dwellings, and are in need for important work to be done (acoustic insulation, dangerous electrical and gas installations…).
Figure 18. Example of a building divided in apartments
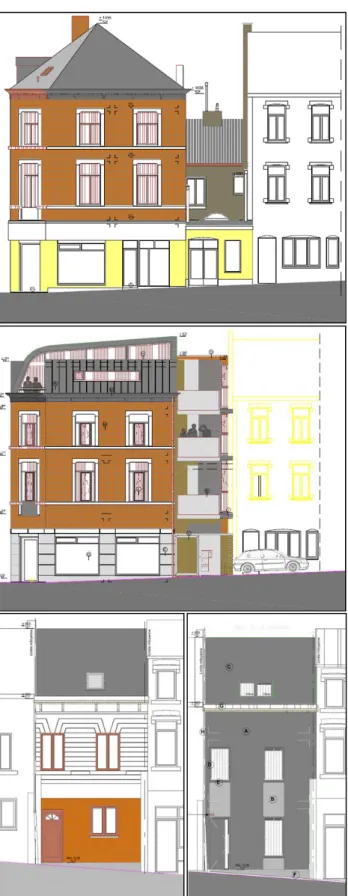
Two of the three building have already been chosen to be renovated in the city of Seraing, near Liege, in Belgium. The first one is an edifice that belongs to the third category above as it is constituted by three apartments above a commercial ground level. The renovation work (Figure 19) should begin after September 2011. The second house is a modest working-class house, and the third still have to be found.
Figure 19. Façades of the houses before and after renovation
V. CONCLUSIONS
Old buildings all have their specificities, their original architecture, their features brought by history, renovations, and successive owners or inhabitants, which make global renovation work so hard to conceive, let alone to regulate. Furthermore, this paper makes it possible to categorize the dwellings, to reduce the infinite number of different buildings to a more manageable number of parameters, allowing us to search for possible ways to renovate them, given that a better knowledge of the existing dwellings stock is a first huge step towards its improvement. The goal of this research is therefore to qualify (and quantify) the Walloon residential building stock, in order to identify majority typologies which can be considered as representative of the stock. This would also help authorities find potential improvement room, strategies of action when it comes to sustainable and large scale renovation of the described typologies.
The representation of a building seems quite useful for a new regulatory requirement that appears with the European EPB legislation: the energy performance certificate, which can be described as an “Energy ID” needed each time when a dwelling is rented or sold. It has no performance goals for the existing buildings, but is supposed to be giving (the new owner as well as authorities) a good picture of the home consumption, so that the new occupant knows what to expect, and which work can be foreseen in order to improve the global performance of the dwelling.
REFERENCES
[1] S. Monfils, J.-M. Hauglustaine, “Reflex: development of a decision help tool for residential renovation”, 1st International Conference on
Energy, Environment and Climate Changes, organized by the University of Industry at Ho Chi Minh City, 26-27 August 2011 [2] Belgian Federal Public Services for Economy, DGSIE,
“Socio-economic survey”, 2001.
[3] European Parliament and Council, “Directive 2002/91/CE approved the 16th of December, 2002, about Energy Performance of Buildings”, edited in the Official Journal of the European Communities, the 4th of January, 2003, 2002.
[4] Walloon Government, “Arrêté du gouvernement wallon du 17 avril 2008 déterminant la méthode de calcul et les exigences, les agréments et les sanctions applicables en matière de performance énergétique et de climat intérieur des bâtiments”, 2008.
[5] ICEDD, “Walloon energy balance 2005. Consumptions of the housing sector”, 2005.
[6] S. Monfils, J.-M. Hauglustaine, “Réno2020: Méthodologie d’insertion des nouvelles technologies dans la rénovation durable du logement wallon”, Intermediate Scientific report, March 2010. [7] Walloon Public Services (MRW, DGATLP, SONECOM), “Survey
on the quality of housing in the Walloon Region”, 2006-2007. [8] M. Descamps, “Optimisation d’une stratégie d’intervention sur un
bâtiment existant, pour en améliorer les performances”, Final work of the Master of Advanced Studies in Applied Sciences, ULg, 2008. [9] Belgian Federal Public Services for Science Policy, “Avec l’aide des
scientifiques, choisissez les mesures thermiques appropriées à votre logement », 1986.
ACKNOWLEDGMENT
to Walloon Government and Public Services, that give financial grants allowing the development of the Reno2020 research project.
