This is an author-deposited version published in:
http://oatao.univ-toulouse.fr/
Eprints ID: 4119
To cite this document:
AUBERT Thomas, CORJON Julien, GAUTREAULT Fabien,
LAURENT Mickaël, CAUSSE, Mickaël, DEHAIS Frédéric. Improving situation
awareness of a single human operator interacting with multiple unmanned vehicles: first
results. In: HUMOUS’10 conference - HUMans Operating Unmanned Systems, 26-27
April 2010, Toulouse, France
.
Any correspondence concerning this service should be sent to the repository
administrator:
staff-oatao@inp-toulouse.fr
Improving situation awareness of a single human
operator interacting with multiple unmanned vehicles:
first results
Thomas Aubert1, Julien Corjon1, Fabien Gautreault1, Michaël Laurent1,
Julien Corjon1, Mickaël Causse2, and Frédéric Dehais2
1 ENAC, 7, av Edouard Belin BP54005 31055 Toulouse Cedex 4,
{auber.thomas,corjon.julien,gautreault.fabien,laurent.michael}@eleve.enac.fr
2 Université de Toulouse, Isae-Supaero, DMIA, 10 av. E Belin 31055 Toulouse Cedex 4
{mickael.causse, frederic.dehais }@isae.fr
Abstract. In the context of the supervision of one or several unmanned
vehicles by a human operator, the design of an adapted user interface is a major challenge. Therefore, in the context of an existing experimental set up composed of a ground station and heterogeneous unmanned ground and air vehicles we aim at redesigning the human-robot interactions to improve the operator's situation awareness. We base our new design on a classical user centered approach.
Keywords: human robots interaction, user interface, evaluation, user
centered design
1 Introduction
Unmanned vehicles have become indispensable assets for many risky human activities (military, search and rescue…). Despite the absence of a crew onboard, the human operator remains a key agent that ensures supervisory control and critical decision making. As the actual trend is reducing manning, an issue of major importance is to design autonomous systems that could be operated by a single human operator. At first, the robotics community mostly focused on improving the automation level across hierarchical control loops (i.e. motion, navigation and decision making). However, the introduction of high level automated systems may lead to classical loss of human’s operator situation awareness [1] issues:
• The human operator’s cognitive workload is most of the time very low as the unmanned vehicles achieve the mission on their own. In critical situation, his cognitive workload increases dramatically and he is expected to handle the situation that he has not created [2];
• The human operator has a lack of knowledge of the automation [3]: he often fails to behave accurately (i.e. take over vs. reconnect automation). The mode transitions of the automation are rarely detected or understood by operators and may have catastrophic consequences [4]. The role and the authority of the agents are pre-defined: they are not adapted in abnormal operation and provoke conflictual situation [5];
• Increasing automation leads to the occurrence of programming errors (e.g. erroneous waypoint selection). These errors are rarely detected because the operators have a trend to check only the final states of the system but not its intermediate states [6]. So this kind of errors have the insidious characteristic to be latent before emerging in the process;
Moreover, the complexity of the task to be performed by the human operator in a dynamic and uncertain environment may also contribute to impair his situation awareness:
• The unmanned vehicles may be of different natures and behave differently (e.g. different flight model). Moreover, their sensors, the payload, the main goal of the mission and the geographical situation may differ from one vehicle to another. This could provoke confusion and inadequate response during stressing events; • Communication breakdowns and response latency may disrupt mutual situation
awareness among all the artificial and the human agents;The large amount of information to display may degrade the human’s operator attentional process (e.g. « tunnel vision »).
For all these reasons, the operator is more and more considered as the performance bottleneck in such autonomous systems. It appears clearly that a user centered design has to be considered in the development of these systems.
Therefore, in the context of an existing experimental set up composed of a ground station and heterogeneous unmanned ground and air vehicles (see figure 1), we aim at redesigning the human-robot interactions to improve the operator's situation awareness [7][8][9][10]. Our contribution to the project is twofold and focused on interaction issues:
• an evaluation of the existing system, with 4 different evaluation methods such as observation and speak aloud techniques, heuristic evaluation, Situation Awareness Global Assessment Technique (SAGAT) and Situational Awareness Rating Technique (SART) [11];
• an implementation of working prototypes based on expert interviews, participative design with multiple iterations (design walkthroughs) and software design patterns to maximize program flexibility The common feature of these techniques is that they place the user at the center of the development process.
2 Evaluation of the current GUI
2.1 Experimental environment
ISAE is developing an experimental set-up composed of a ground station and an unmanned ground vehicle (cf. figure 1). This UGV may be controlled either using a joystick in a manual mode or in an autonomous mode via sending waypoints coordinates. This mobile robot is equipped with several sensors (GPS, inertial sensors, panoramic camera, ultrasounds…) and it has the ability to adapt to hazardous events. The ground station offers several tools to allow a human operator to control the robot:
1. A panoramic video is placed in the upper center of the GUI;
2. A mission synoptic displaying the current step in green (e.g. back to base) below the panoramic video;
3. A Google map displaying the current position of the robot in the lower left corner;
4. An interactive panel displaying messages and asking for operator confirmation under certain circumstances;
5. A panel displaying the state of the robot sensors (working/not working) 6. A text field that provides the status of the mode (manual – hybrid –
autonomous).
Figure 1: the experimental set up. On the left, the current GUI of the ground station, on the right a lateral view of the unmanned ground vehicle
An experimental scenario was defined: it consists (c.f. figure 2) of the localization and assessment of a target by a UGV in a partially unknown area. The mission for the UGV and the operator consisted in looking for and identifying specific targets in an unknown environment. The mission was divided in 5 steps: “reach the search area” (autonomous mode), “target research” (autonomous mode), “target identification” (manual mode), “target confirmation” (manual mode), “back to base” (autonomous
mode). During the experimentation, the human operator had no direct visual contact with either the UGV or the outdoor environment. Additionally, some hazards provoked by a wizard of Oz may impair the mission such as a communication breakdown between the UGV and the ground station, low battery event..
2.2 Heuristic evaluation
The heuristic evaluation is a low-cost formative evaluation technique classically used in the HCI community to efficiently determine major and minor usability problems early in the development cycle [12][13]. This technique consists in asking a small sample of users/evaluators to assess a GUI using heuristics as guidelines while performing scenarios. In human-robot interaction (HRI), 7 specific heuristics have been adapted by Clarkson, E. and Arkin [14]: sufficient information design, visibility of system status, use of natural cues, synthesis of system and interface, help users recognize diagnose and recover from errors, flexibility of interaction architecture, aesthetic and minimalist design.
7 people (4 experts and 3 novices) have been contacted to participate to the heuristic evaluation. Before the beginning of the session, the GUI and the experimental scenario (see previous section) were presented to each participant as well as the heuristics. During the experimentation, the participants had the ability to freeze the mission in order to fill in an evaluation form (see table 1) and to rate the impact of the encountered problem with a 1-5 scale. At the end of the mission, they were given time to read over their evaluation and link the identified problems with the corresponding heuristic(s).
Evaluator mission
phase Problem Impact Heuristic
Participa nt 1
Autonomou s target research
Targets are not indicated on the map.
5 1
Participa
nt 1 Manual identificatio n of target
Target is not visible enough (only in the information panel).
5 2
Participa
nt 2 Manual identificatio n of target
The incitation to control manually the robot is too weak
4 2
Participa
nt 2 Manual identificatio n of target
Text used to inform that a target has been found is too long and too complex
3 3
Participa
nt 2 Target confirmation Was asked to confirm the target twice, why? 2 5 Table 2 : Sample of critics made by 2 participants during the heuristic evaluation
As a result, 5 mains issues were uncovered by the evaluators:
• Too many unnecessary and unclear information was displayed;
• Poor management of attention (i.e. the GUI did not help the user to look at the right thing at the right time);
• The panoramic video was difficult to use in most situations. The video definition and layout was insufficient to clearly identify targets and led to “orientation” confusion when handling the robot.
• The map was rarely checked and was quickly judged useless because of missing essential information such as the azimuth of the robot, the pre-planned trajectory or the localization of the targets.
2.3 SAGAT and SART evaluation
Another important issue in our evaluation was to assess the ability of the GUI to provide the user accurate situation awareness (SA). We therefore used two classical situation awareness evaluation methods: the Situation Awareness Global Assessment Technique (SAGAT) and the Situational Awareness Rating Technique (SART). SAGAT offers an objective evaluation of the participant’s SA [10]. During this evaluation, participants were asked questions inspired by the SA requirements compiled by Hassel, Smith and Stratton [15] (orientation and attitude, health/status, state and logic, threat in the vicinity, mission progress, thinness, trustworthiness and capabilities of the robot). SART is used to assess the subjective rating of the participant’s SA in terms of attentional demand, attentional supply and using a 1-7 scale [11].
7 new participants were recruited (age range 20-50 years old). Before the beginning of the experiments, they were familiarized with the system and their mission was presented. In this scenario, the UGV autonomously searches for targets painted on wood panes placed on the ground. The operator has to confirm only the targets represented by a white cross. Participants don’t know that two targets are placed on the path of the drone: the first is a circle and the second is a cross. At the same predefined moments for all the participants, sensor breakdowns, target detection or low power events are triggered by the wizard of Oz. The mission is then interrupted: the supervision screens are switched off and a predefined set of quick questions are asked to the participant to evaluate his SA. The screens are switched on and the mission resumes when the questions are answered.
At the end of the mission, the participants are asked to fill in a SART questionnaire. The SAGAT evaluation allowed us to uncover that 5 participants out of 7 were unable to designate the position of the UGV on a map similar to the one displayed on the system’s second screen. The reason was that they simply didn’t check that screen and were focused on the main screen all the time (the video mostly). So the visual distance of the map is a problem for perception and the information it displays is not interesting enough for the operator to feel the need to check the screen regularly (bad level 1 situation awareness).
The SAGAT evaluation also pointed out that the participants were able to perceive the state changes on the main screen but had difficulties to explain their consequences (bad level 2 situation awareness).
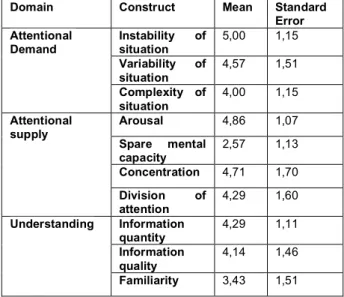
According to the SART results presented in table n°3, the participants felt that the supervision system provided poor situation awareness and generated a high cognitive workload. The GUI displays relatively too much information (sometimes inadequate) and the participants felt unable to perform another task in parallel.
Domain Construct Mean Standard
Error Instability of situation 5,00 1,15 Variability of situation 4,57 1,51 Attentional Demand Complexity of situation 4,00 1,15 Arousal 4,86 1,07 Spare mental capacity 2,57 1,13 Concentration 4,71 1,70 Attentional supply Division of attention 4,29 1,60 Information quantity 4,29 1,11 Information quality 4,14 1,46 Understanding Familiarity 3,43 1,51
Tableau 1 _ Situation Awareness Rating Technique results
3 Propositions for the new GUI
3.1 Methodology and key concepts
We followed an iterative, incremental and adaptive user centered approach based on experts interview, paper and powerpoint prototypes, powerpoint and design walktrough techniques. This particular approach, and the results of the previous analysis (see section 2) has led us to propose the following key concepts:
• Design the GUI in a goal-oriented way to let the human operator have clearly in mind the objectives of the mission;
• Customize the interface according to the mission and the profile of the human operator with a backup / load profile. This allows to adapt the GUI depending of the level of experience, profile (teleoperator / developer), environmental conditions, numbers of UVs, mission types..,
• Use Strips to represent the state of each vehicles like in the air traffic control “philosophy”. These strips provide the main information on the UVs (guidance mode, type of UV, mission statement…);
• Display the trajectories and the range of the UVs on a map as well as their timelines to help the human operator to anticipate high workload period; • Provide at once a global view and a local view for each UV to let the human
supervise or operate the different UV at any moment. The GUI must offer obvious links between these two view to facilitate identification of the different UVS;
• Set properly the criticality of the hazards/alarms and order them in the GUI to help the human operator to focus on the priority events.
3.2 Design and implementation
Main board
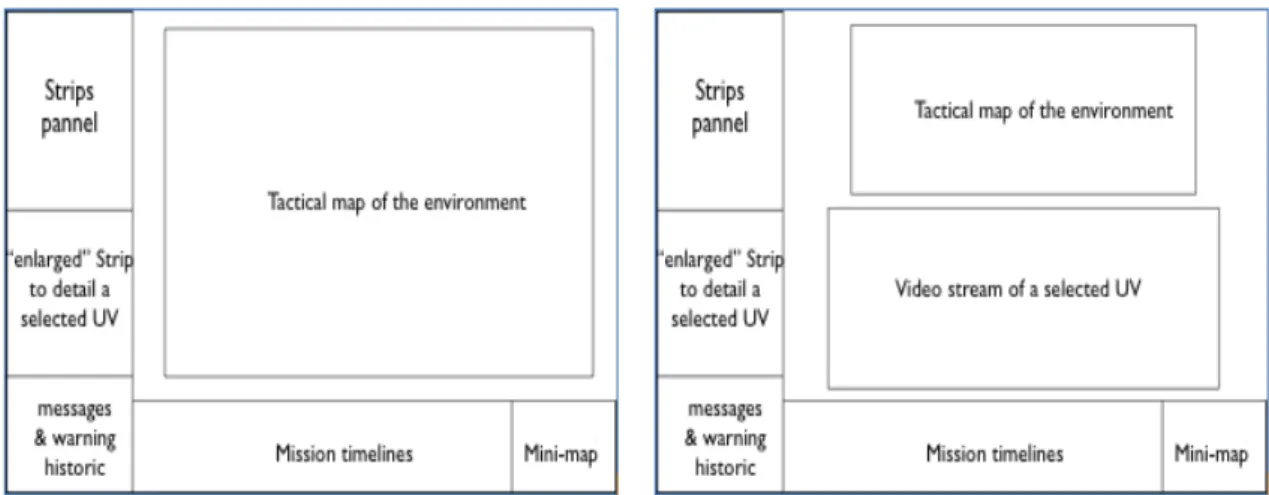
The figure 2 show the organization of the different modules in the main board. As the main task of the human operator is to supervise the UVs, we therefore propose to display the tactical map in the center part of the GUI. The different video streams are displayed on a secondary screen but a specific video stream may appear under the tactical map to offer both a local and a global view in the human operator’s visual field. The timeline and the mini-map appear in the below part of the GUI. The left part of the main board is dedicated to inform the human operator of the states of the UVs with the strips panel, then enlarged strip panel, and the message and warning panel.
Figure 1: organization of the information in the new GUI. On the lef part of the figure, the tactical map is displayed widely in the center part of the main board. If the human operator wants to control a UV, he can display its video stream under the tactical map as shown on the right part of the figure.
Strips panel
The strip panel offers synthetic information for each UV : name (eg Alpha,) the type (eg : UAV), the guidance mode (automatic vs. manual), a simplified synoptic and a color code (green, orange, red) represents its “health” status . The design of this panel offers an easy vertical visual scan path to check at a glance the states of the UVS. More information such as special messages or origin of a faileur can be displayed on a specific UV by clicking on its strip.
Figure 2 : The strip panel is represented on the left part of the figure. If the human operator “clicks” on a specific strip (eg. Charlie), it is enlarged to provide more data on the the selected UV.
Message and warning panel
The different key events (eg detection of a target, failure..) are displayed in the message and warning panel. They are ordered in terms of priority and low critical events may be hidden to avoid attentional distraction.
Mission timeline
The time line is there to synthesize information on the mission statement. It includes a time line for each UV: special events (eg. detected target or failure) are displayed at the time it occurs on the timeline.
Figure 4 : mission timeline. Each row represents the current the mission statement of a UV. Please note, that the red icon on the last row warns that the “Delta” UV will not be able to have sufficient battery to end the mission.
Mini map
The mini-map module provides a general overview of the environment where evolve the different UVs. Its design is inspired from mini maps in real time strategy games. A frame represents the area currently displayed by the main board. A click on the mini-map change the focus and the view displayed on the main board. It can also display alerts for UVs outside the field by flashing a red circle converging on them to identify and locate them rapidly.
Figure 5 : The mini map
Cartography
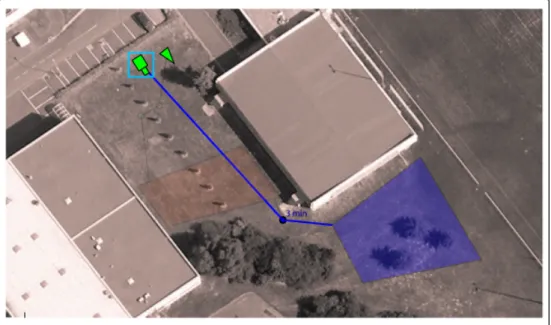
The cartography module provides the tactical information to accomplish the mission: it displays the map, the UVs with an iconic representation as well as their trajectories and research area. Tough it has not been implemented yet, this module will be used for planning and replanning options.
Figure 6 : cartography module: it display the UVs and their respective trajectories and search areas.
Video
3 types of views emerged of the design process. The first one is the current the "panoramic view". It allows the operator to view the entire environment of the UGV in one image and our users still considered it adapted for supervision.
Figure 7 - The "panoramic view"
The second view is called the "car view" because of its similarity with the environment of a car driver (a windscreen, two side windows and a rearview mirror - see figure 8). This view is useful when the operator has to control the UV s and avoid obstacles.
Figure 8 - The "car view"
The third one, called the "detailed view" is similar to the Google© street view. It displays only one part of the video corresponding to a human field of view and the operator is allowed to change this point of view (left/right rotation and in/out zoom). Street View is controlled with a mouse but we proposed a head tracker as an alternative. This view is considered well adapted to target search/confirmation tasks. Graphics color choice
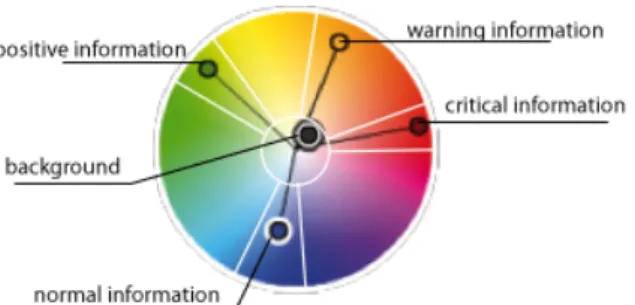
The initial evaluation phase confirmed the importance of easily differentiable and salient information to drive the attentional process: a well crafted color language can help in that matter and figure 9 illustrates the color space segmentation we have proposed.
Figure 9 - Color wheel with color signification We identified 3 important contrasts we to ensure:
• Layout/unmodifiable/real elements < > interactive/virtual elements : we based this contrast on luminosity and saturation, both low for the first elements and high for the second
• Information requiring attention < > information not requiring attention: the blue we defined to display unimportant information offers a small contrast with our de-saturated/dark background but remains visible. Information color coded that way melts with the background and does not attract attention.
The figure 10 shows the general layout of the interface and color coded elements. We also applied a color filter (grayscale + light red tint) on the map to increase the salience of the virtual and/or interactive elements as visible on Figure 4.
Software architecture
Flexibility was a major priority for 3 reasons. First, user centered design is a very dynamic process and so the architecture has to support change to enable the method to succeed. Second, the designed system is used for research and evaluation purpose and is not a consumer product: researchers will test their hypothesis on the system, so it has to be even more flexible. Last, the system’s hardware is still actively developed, so designing for hardware independence was a requirement.
To support these constraints:
• Each subpart of the interface was implemented as an independent component;
• All these components comply with the Model-View-Controller design pattern[16];
• A dialog interface was added between the raw drone messages and the Model.
4 Conclusion and perspectives
In the context of an existing experimental set up composed of a ground station and heterogeneous unmanned ground and air vehicles (see figure 1), we have proposed and implemented concepts to improve the operator's situation awareness. This new design was elaborated with user centered techniques such as Heuristic, Sagart and
Sart methods, experts interviews and design walktrough. The next step is to evaluate these concepts with a large amount of users with the same kind of techniques.
References
1. Endsley, M.R., 1995a, Towards a theory of situation awareness in dynamic systems, Human
Factors, Vol. 37, pp. 32-64.
2. Taylor, R.M. (2006) Human Automation Integration for Supervisory Control of UAVs. In Virtual Media for Military Applications (pp. 12-1 – 12-10). Meeting Proceedings RTO-MP-HFM-136, Paper 12. Neuilly-sur-Seine, France: RTO.
3. R. Mumaw, N. Sarter, and C. Wickens. (2001) Analysis of pilots’ monitoring and performance on an automated flight deck. In International Symposium on Aviation Psychology, Colombus, Ohio, 2001.
4. Dehais, F., S. Mercier and Tessier, C. (2009) Conflicts in human operator-unmmaned interactions, HCI 2009 Conference, San Diego, US.
5. N.B. Sarter, R. Wickens, S. Kimball, R. Marsh, M. Nikolic, and W. Xu. (2003) Modern flight deck automation : pilot’s mental model and monitoring patterns and performance. In Proceedings of the International Symposium on Aviation Psychology, Dayton.
6. R. Amalberti. (1996) La conduite des systèmes à risques. PUF.
7. Cummings, M. L., Nehme, C. E. , Crandall, J. and Mitchell, P. (2006.) Predicting Operator Capacity for Supervisory Control of Multiple UAVs.
8. Cummings, M. L., Bruni, S., Mercier, S. and Mitchell, P.J. (2007) Automation Architecture for Single Operator-Multiple UAV Command and Control
9. Drury, J. L., Riek, L., and Rackliffe, N. (2006). A decomposition of UAV-related situation awareness. In Proceedings of the 1st ACM SIGCHI/SIGART Conference on Human-Robot interaction (Salt Lake City, Utah, USA, March 02 - 03, 2006). HRI '06. ACM, New York, NY, 88-94.
10. Endsley, M.R., 1995b, Measurement of situation awareness in dynamic systems, Human Factors, Vol. 37, pp. 65-84.
11. Taylor, R.M. (1990). Situational Awareness Rating Technique (SART): The development of a tool for aircrew systems design. In Situational Awareness in Aerospace Operations (AGARD-CP-478) pp3/1 –3/17, Neuilly Sur Seine, France : NATO-AGARD 12. Nielsen, J. (1994). Enhancing the explanatory power of usability heuristics. In
Proceedings of CHI '94, 152-158
13. Nielsen, J. and Molich, R. (1990). Heuristic Evaluation of User Interfaces. In Proceedings of CHI '90, 249-256.
14. Clarkson, E., and Arkin, R. C. 2007. Applying Heuristic Evaluation to Human-Robot Interaction Systems. FLAIRS Conference, pp. 44-49
15. Hassell, A. J., Smith, P., and Stratton, D. (2007). An evaluation framework for videogame based tasking of remote vehicles. In Proceedings of the 4th Australian Conference on
interactive Entertainment (Melbourne, Australia, December 03 - 05, 2007). ACM International Conference Proceeding Series, vol. 305. RMIT University, Melbourne,
Australia, 1-8.
16. Burbeck, S., Applications Programming in Smalltalk-80: How to use Model-View-Controller(MVC), 1992, http://st-www.cs.uiuc.edu/users/smarch/st-docs/mvc.html.