Genomic architecture of human
neuroanatomical diversity
Roberto Toro1,2,3*, Jean-Baptiste Poline4,5, Guillaume
Huguet1,2,3, Eva Loth6,7, Vincent Frouin5, Tobias Banaschewski8, Gareth J Barker6, Arun Bokde9, Christian Büchel10, Fabiana M Carvalho6,7, Patricia Conrod6,11, Mira Fauth-Bühler16, Herta Flor12, Jürgen Gallinat13, Hugh Garavan9,14, Penny Gowland14, Andreas Heinz13, Bernd Ittermann15, Claire Lawrence20, Hervé Lemaître17,18, Karl Mann16, Frauke Nees12, Tomáš Paus19-21, Zdenka Pausova22, Marcella Rietschel23, Trevor Robbins24, Mi-chael N Smolka25,26, Andreas Ströhle13, Gunter Schumann6,7†, Thomas Bourgeron1,2,3† and the IMAGEN consortium (www.imagen-europe.com)1
Human brain anatomy is strikingly diverse and highly inheritable: genetic factors may explain up to 80% of its variability. Prior studies have tried to detect ge-netic variants with a large effect on neuroanatomical diversity, but those currently identified account for <5% of the variance. Here we show, based on our analyses of neuroimaging and whole-genome geno-typing data from 1,765 subjects, that up to 54% of this heritability is captured by large numbers of single nucleotide polymorphisms of small effect spread throughout the genome, especially within genes and close regulatory regions. The genetic bases of neuroanatomical diversity appear to be rel-atively independent of those of body size (height), but shared with those of verbal intelligence scores. The study of this genomic architecture should help us better understand brain evolution and disease. Keywords: Neuroanatomy, Heritability, Neuroimaging, Genet-ics
INTRODUCTION
Family studies show that a large part of the variability of differ-ent human brain structures is determined by genetic factors. Because we know a priori the degree of genetic relationship between monozygotic and dizygotic twins, or between mem-bers of a family, we can decompose the variability of a pheno-type into genetic and environmental components. Various stud-ies have demonstrated in this way that neuroanatomical pheno-types, such as brain volume or cortical surface, are highly in-heritable, with genetic factors accounting for up to 80% of their variability (Winkler et al., 2010; Stein et al., 2012; Blokland, de Zubicaray, McMahon, & Wright, 2012). These results are par-ticularly important for psychiatric research. Different psychiat-ric disorders have been associated with characteristic changes in brain anatomy, such as a higher incidence of macrocephaly and increases of white matter volume in autism (Amaral, Schu-mann, & Nordahl, 2008), or reduced hippocampal and total brain volumes in schizophrenia (Steen et al., 2012). If these characteristic changes are modulated by the subject's genetic background, then this background may act as a protective factor or as a risk factor for the development of psychiatric conditions.
Whereas family studies can inform us about the heritability of a 1*Corresponding author: Roberto Toro, rto@pasteur.fr †Shared last authorship
trait, different approaches are required to determine the nature of the genetic factors involved. Various efforts have been made to go deeper into the genetics of neuroanatomical diversity through candidate-gene approaches or through agnostic, gen-ome-wide association studies (Bis et al., 2012; Ikram et al., 2012; Stein et al., 2012). These approaches have provided im-portant insights on the genetic bases of neuroanatomical di-versity, however, for the moment they account for only a small proportion of the phenotypic variance.
Here we used a recently developed approach (Yang et al., 2010, 2011), were the combined effect of hundreds of thousands SNPs is considered in a single test – instead of the massive uni-variate testing approach of classic genome-wide association studies (GWAS). We studied a large cohort of 1,765 adoles-cents from the IMAGEN project (Schumann et al., 2010), for whom neuroimaging, whole-genome genotyping and behavi-oural data was available. As in twin and family studies, we es-timated the amount of phenotypic variance explained by ge-netic relationships among subjects. By contrast, instead of us-ing expected relationships based on pedigree, we used a gen-ome-wide average of the difference in genotyping at each single nucleotide polymorphism (SNP) between unrelated sub-jects. By using different sets of SNPs to compute genetic rela-tionships, we were able to partition neuroanatomical variance into different SNP sets and investigate the genomic architecture of neuroanatomical diversity at a level of granularity intermedi-ate between that of family studies and candidintermedi-ate-gene or gen-ome-wide association studies. Finally, we used simulated phen-otypes to estimate the minimum number of causal SNPs likely to produce our observed results.
RESULTS AND DISCUSSION
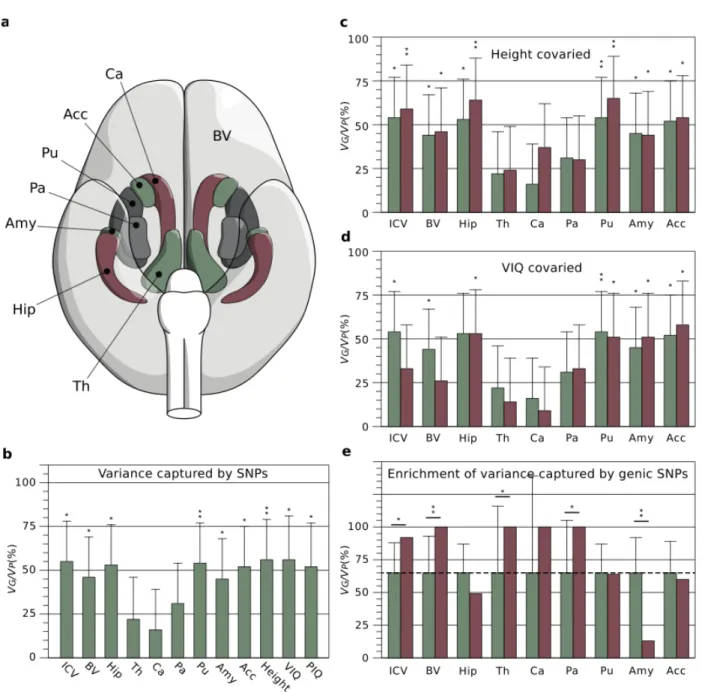
Brain scans were obtained from a cohort of 2,089 adolescents (14.5±0.4 years old, 51% females) from the IMAGEN project (http://imagen-europe.com) using magnetic resonance imaging in 8 European centres. We measured intracranial volume (ICV), total brain volume (BV), as well as the volume of the hippo-campus (Hip), thalamus (Th), caudate nucleus (Ca), putamen (Pu), globus pallidus (Pa), amygdala (Amy) and nucleus ac-cumbens (Acc) using validated automatic segmentation pro-grams (Buckner et al., 2004; Cox, 1996; Jenkinson, Bannister, Brady, & Smith, 2002; Patenaude, Smith, Kennedy, & Jenkin-son, 2011; Smith et al., 2004; Zhang, Brady, & Smith, 2001) (Figure 1a, Supplementary Figure 1, Supplementary Table 1). Individuals were whole-genome genotyped using Illumina 610-Quad and Illumina 660W-610-Quad chips. After various quality control filters, we conserved 269,308 informative, relatively in-dependent (R2<0.9) SNPs in a cohort of 1,765 unrelated sub-jects.
First, we estimated the proportion of the phenotypic variance explained by all SNPs with a linear mixed-effects model with the genetic relationship matrix as the structure of the covari-ance between subjects using GCTA (Yang et al., 2010). We es-timated through simulation that we had >50% statistical power to find heritability values >45%, and >70% statistical power to find heritability values >55% (see Methods section). In all our analyses we included age, sex, and scanning centre as fixed ef-fects. To account for population structure effects, we also in-cluded the first 10 principal components (PCs) of the iden-tity-by-state (IBS) matrix as covariates (A. L. Price et al., 2006). Figure 1b shows the estimated proportion of the pheno-typic variance attributable to genetic variance (VG/VP) for the neuroanatomical structures under study (Supplementary Table 2). The figure includes also estimates of VG/VP for height, as
not peer-reviewed) is the author/funder. All rights reserved. No reuse allowed without permission.
The copyright holder for this preprint (which was .
http://dx.doi.org/10.1101/001198
doi: bioRxiv preprint first posted online Dec. 10, 2013;
well as measurements of verbal intellectual quotient (VIQ) and performance intellectual quotient (PIQ) based on the Wechsler Intelligence Scale for Children. Our estimates for height (VG/VP=56%, P=0.0069), VIQ (VG/VP=56%, P=0.013) and PIQ (VG/VP=52%, P=0.02) were statistically significant, and consist-ent with those obtained previously in larger populations (Dav-ies et al., 2011; Yang et al., 2010). A total of 12 statistical tests were performed. Because of the correlation among phenotypes a simple Bonferroni correction would be too conservative. In-deed, a global test shows that there is a statistically significant (P=0.0011) excess of P-values <0.05 (Methods section).
We found that a large proportion of the variance of neuroana-tomical phenotypes was explained by the additive effect of gen-otyped SNPs — for example, 44% (P=0.031) of the variance in total brain volume (BV), 53% (P=0.01) of the variance in hip-pocampal volume (Hip) and 54% (P=0.011) of the variance in intracranial volume (ICV). Combined, the largest genome-wide association studies to date for BV (Stein et al., 2012), Hip (Bis et al., 2012; Stein et al., 2012) and ICV (Ikram et al., 2012; Stein et al., 2012) (N~20,000) found 1 SNP associated to Hip volume and another associated to ICV, each explaining < 0.5%
Figure 1. a. Brain phenotypes. We measured intracranial volume (not represented), total brain volume (BV, in light grey) and several subcortical
structures, Ca: Caudate nucleus, Acc: Nucleus accumbens, Pu: Putamen, Pa: Pallidum, Amy: Amygdala, Hip: Hippocampus, and Th: Thalamus. b.
Variance captured by SNPs. Percentage of phenotypic variance (VP) due to inter-individual genetic relationships (VG), computed from all genotyped
SNPs. In addition to brain phenotypes, the bar plot includes estimates of VG/VP for height, VIQ and PIQ. c. Effect of covarying body size (height) from brain phenotypes. The proportion of VG/VP after covarying height (red bars) did not change substantially compared with those in 1b (green
bars), and maintained their statistical significance. d. Effect of covarying VIQ from brain phenotypes. The proportion of VG/VP after covarying VIQ
(red bars) decreased especially for ICV and BV, where the estimates were no longer statistically significant (green bars: raw estimates from 1b). e.
Enrichment of variance captured by genic SNPs. Genic SNPs (gene boundaries ±50kbp) represent 64% of all SNPs. If all SNPs explained a similar
amount of variance, genic SNPs should explain 64% of the total variance explained by SNPs (dashed line, green bars). They explained significantly more variance than expected for ICV, BV, Th and Pa; significantly less for Amy (red bars, error bars represent test variance). * P<0.05, ** P<0.01, uncorrected.
of the variance – of the same order of magnitude as for other quantitative traits, such as height. Approximately 50% of the additive genetic factors affecting neuroanatomical variability may be then supported by a large number of SNPs, each of small effect.
To get an idea of the minimum number of SNPs likely to pro-duce our observed results we simulated 10,000 phenotypes with additive heritability of 50% produced by 1 to 1,000 causal SNPs and 10,000 phenotypes produced by 1 to 10,000 SNPs. Causal SNPs were randomly selected from among the original 518k genotyped SNPs before R2 filtering (i.e., their effect may be noticeable only through linkage disequilibrium), and their effect sizes drawn from a normal distribution to obtain 50% heritability. We performed GWAS for all our phenotypes, and recorded the order of magnitude of the smallest P-value, which varied from 10-5.1 to 10-6.8 (Table 1). We then did the same for each of the 20,000 simulated phenotypes. Figure 2 shows the proportion of simulations with smallest P-value of the order of 10-5, 10-6, etc., as a function of the number of causal SNPs used. We observed that 95% of the phenotypes simulated with <220 causal SNPs had P-values <10-8. By contrast, the order of the smallest P-value in the GWAS for ICV, for example, was 10-5.95, and 95% of simulations with smallest P-value <10-5.95 were pro-duced by <850 causal SNPs. Similarly, the order of the smallest P-value in the GWAS for BV was 10-6.8, and 95% of the simula-tions with P-values smaller than that were produced by <420 causal SNPs. If the distribution of effect sizes of causal SNPs
for ICV and BV were similar that used in our simulations, our phenotypes should likely be produced by hundreds of causal SNPs and possibly thousands of them.
The variance estimates for different brain structures were het-erogeneous, and appeared to be differently related to height, VIQ and PIQ (Supplementary Table 2). For example, whereas the variance explained by SNPs was high and statistically sig-nificant for the hippocampus (VG/VP=53%, P=0.01), this was not the case for the caudate nucleus (VG/VP=16%, P=0.25) — a
Figure 2. Distribution of smallest P-value in the GWAS with simulated phenotypes as a function of the number of causal SNPs used to generate them. Simulated phenotypes were produced with a number of causal SNPs varying from 1 to 1,000 (a), and from 1 to 10,000 (b). The effect
of causal SNPs were drawn from a normal distribution, and the heritability of the simulated phenotypes was fixed at 50%. Ninety five percent of simulated phenotypes with <220 causal SNPs had a smallest P-value <10-8. By contrast, simulated phenotypes produced with >500 causal SNPs had
most often a smallest P-value of the order of 10-6 or 10-5. The top plot in (a) and (b) shows the most frequent order of magnitude of the smallest
P-value as a function of the number of causal SNPs.
Table 1. Order of magnitude of the smallest P-value in the GWAS for each phenotype.
Phenotype -log10(Smallest P-value)
ICV 5.95 BV 6.75 Hip 5.50 Th 5.72 Ca 5.91 Pu 5.49 Pa 5.67 Amy 5.14 Acc 5.60 Height 5.94 VIQ 5.32 PIQ 5.49
not peer-reviewed) is the author/funder. All rights reserved. No reuse allowed without permission.
The copyright holder for this preprint (which was .
http://dx.doi.org/10.1101/001198
doi: bioRxiv preprint first posted online Dec. 10, 2013;
structure of comparable volume, geometry, and variability, that presents a similar correlation with ICV (rHip/ICV=0.51, rCa/ICV=0.52) and body size (rHip/Height=0.15, rCa/Height=0.21). This shows that the estimates of VG/VP are not merely determined by the structure’s volume or shape, and could rather reflect a vary-ing influence of genetic and environmental factors. Our vari-ance estimates were not significantly affected by population structure – not including the 10 first principal components of the IBS matrix changed on average the estimates of variance by less than 1% (P=0.93). The estimates of variance did not change significantly either if height or PIQ were covaried (Fig-ure 1c, Supplementary Table 2). By contrast, including VIQ scores as covariate decreased substantially VG/VP estimates for ICV and BV, but not for subcortical structures (Figure 1d). For example, ICV has a moderate correlation with height and VIQ (in our cohort rICV/Height=0.39 and rICV/VIQ=0.18). The estimate of VG/VP for ICV was not significantly different if height was ad-ded as a covariate, however, it decreased from 54% to 32% (no longer statistically significant) if VIQ was included as a covari-ate. We performed bivariate analyses to estimate the genetic correlation between our phenotypes, i.e., the amount of genetic variance shared by each pair of phenotypes (Supplementary Table 3). In particular, these analyses showed indeed a strong genetic correlation between VIQ and ICV (rG=0.95, P=0.0047), and between VIQ and BV (rG=0.89, P=0.014), but a small, not statistically significant, genetic correlation between height and ICV (rG=0.20, P=0.25), and between height and BV (rG=0.23, P=0.24). Genetic correlation was also weak between
PIQ and ICV (rG=0.02, P=0.48) and between PIQ and BV (rG=0.02, P=0.48). More than 90% of brain volume (BV) is constituted by the cerebral cortex and its cortico-cortical con-nections. Our results suggest that the genetic bases of ICV and BV diversity may be shared to a larger extent with those of VIQ than with those of PIQ or body size (height).
A large proportion of the genetic variance captured by SNPs could be due to those located within genes and close regulatory regions. We obtained 20,022 gene boundaries from the UCSC Genome Browser hg18 assembly. We made a first set with all SNPs within these boundaries, and two further sets that in-cluded also SNPs 20kbp and 50kbp upstream and downstream from the 5’ and 3’ untranslated regions of each gene. Next, we computed genetic relationship matrices for those 3 SNP sets (±0kbp, ±20kbp and ±50kbp genic sets), and their comple-ments. Finally, for each of the 3 sets, we fitted the same linear mixed-effects model as before (including age, sex, centre and 10 principal components), but using 2 genetic relationship matrices instead of 1: the genic matrix and its complementary nongenic matrix. Genic SNP sets explained up to 98% of the variance captured by all SNPs (Supplementary Table 4), which was in many cases significantly larger than what could be ex-pected from set length alone (Figure 1e, Supplementary Table 5). For ICV, where 54% of the variance can be explained by all genotyped SNPs (N=273,926), using only SNPs within gene boundaries (N=108,339) explained 26% of the phenotypic vari-ance (P=0.054), and this proportion increased to 45%
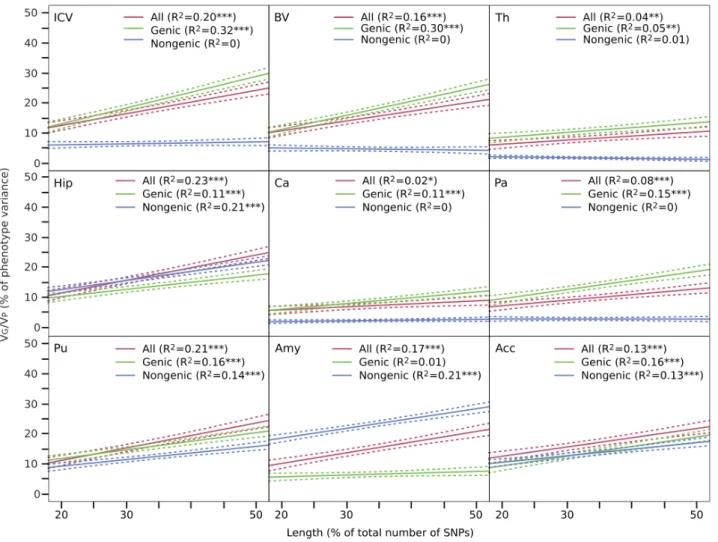
Figure 3. VG/VP versus gene set length. The amount of variance captured by SNPs increased with the number of SNPs used to compute
(P=0.0065) when the boundaries were expanded to ±20kbp (N=146,431), and to 49% (P=0.0058) when the boundaries were expanded to ±50kbp (N=174,334). The genic ±50kbp set contained 64% of all genotyped SNPs, but explained 91% of the variance of ICV attributable to SNPs, significantly more than what we would expect from its length alone (P=0.014). Previous reports have suggested that causal SNPs for height and IQ are relatively homogeneously distributed across the genome, and then, that increasing the number of SNPs used to create a genetic-relationship matrix increases proportionally the amount of phenotypic variance captured. We observed the same trend for our neuroanatomical phenotypes. We partitioned the genome into non-overlapping sets with different numbers of SNPs, and observed a strong correlation between set length and VG/VP (r=0.62 on average). The correlation was the same when only genic SNPs were selected (r=0.62), but smaller, and in most cases not statistically significant when only nongenic SNPs were selected (Figure 3).
Finally, we partitioned VG/VP based on functional annotation (SNPs within genes involved in central nervous system func-tion (Lee et al., 2012; Raychaudhuri, Korn, & McCarroll, 2010)), and relative minor-allele frequency. We did not observe statistically significant differences in the amount of variance explained by these different SNP sets compared with the ex-pectations based on their length (Supplementary Methods, Sup-plementary Tables 6, 7).
In conclusion, our analyses indicate that a significant propor-tion of the heritability of neuroanatomical phenotypes may res-ult from the additive effect of hundreds of small-effect SNPs spread genome-wide. Such SNPs seemed to be largely inde-pendent from those related to body size (height) or reflecting population structure in our cohort. They were shared to a greater extent, however, with those associated with VIQ in the case of ICV and BV. An especially important role in determin-ing neuroanatomical diversity appeared to be played by SNPs
within genes and close regulatory regions.
Even if our variance estimates are large, they are still far from the estimates of additive genetic variance from pedigree stud-ies: ~80% of the variance of various brain structures has been attributed to additive genetic factors (Stein et al., 2012). This difference may be due to a weak linkage disequilibrium between the genotyped SNPs and the real causative variants, to rare alleles with larger effect sizes or to common alleles with even smaller effect sizes. In any case, further progress will re-quire cohorts of maybe hundreds of thousands of individuals, underlining the necessity for international efforts such as the ENIGMA and CHARGE consortia.
Recent studies have highlighted the importance of the additive effect of SNPs in determining anatomical and cognitive di-versity in humans, but also their role in psychiatric disorders. In addition to the clear role of rare mutations in the susceptibility to psychiatric disorders (Cook Jr & Scherer, 2008), whole-gen-ome analyses of variance have shown that commonly geno-typed SNPs capture 23% of the risk to schizophrenia (Cross-Disorder Group of the Psychiatric Genomics Consortium, 2013; Lee et al., 2012), 24% of the risk to Alzheimer’s disease (Lee et al., 2013), and from 17% to 60% of the risk to autism spectrum disorders (Cross-Disorder Group of the Psychiatric Genomics Consortium, 2013; Klei et al., 2012). Due to the small individual effect of these SNPs, GWAS will require very large cohorts to explain any sizeable proportion of the trait’s genetic variance (Park et al., 2010). Various structural and functional neuroimaging endophenotypes, on the other hand, have been frequently associated with psychiatric disorders (Meyer-Lindenberg & Weinberger, 2006), and their analysis us-ing whole-genome regression could inform us about the added effect of SNPs at a relevant intermediate level, closer to biolo-gical processes than cognitive or psychiatric tests. A global view of the genomic architecture of neuroimaging endopheno-types should not only allow us to better understand the biolo-gical bases of the susceptibility to psychiatric disorders – help-ing us, for example, to target future GWAS to more specific chromosomal regions and brain structures – but also to improve our understanding of the biological bases of brain diversity and evolution in humans.
METHODS
Neuroimaging
Magnetic resonance imaging data were acquired at 8 European centres, using a standardised 3 Tesla, T1-weighted gradient echo protocol (voxel size=1.1 mm isotropic) based on that from
the ADNI initiative
(http://adni.loni.ucla.edu/methods/documents/mri-protocols). MRI volumes were first linearly transformed to match the MNI152 atlas using FLIRT from FSL (Jenkinson et al., 2002;
Smith et al., 2004)
(http://fsl.fmrib.ox.ac.uk/fsl/fslwiki/FLIRT). The inverse of the determinant of the transformation matrix was used to estimate intracranial volume (Buckner et al., 2004). Next, skull was stripped using 3dSkullStrip from AFNI (Cox, 1996) (http://afni.nimh.nih.gov), and the grey matter, white matter and cerebrospinal fluid were automatically segmented using
FAST (Zhang et al., 2001)
(http://fsl.fmrib.ox.ac.uk/fsl/fslwiki/FAST). The skull-stripped versions of the brain volumes, and the tissue segmentations were visually inspected and manually corrected wherever ne-cessary. Total brain volume was estimated as the sum of total grey and white matter volumes. Finally, subcortical structures were automatically segmented using FIRST (Patenaude et al.,
Figure 4. Statistical power as a function of heritability. Estimation
of statistical power obtained through simulation of 10,000 phenotypes with different heritability values, supported by a different number of causal SNPs. We had >50% statistical power to find heritability values >45%, and >70% statistical power to find heritability values >55%.
not peer-reviewed) is the author/funder. All rights reserved. No reuse allowed without permission.
The copyright holder for this preprint (which was .
http://dx.doi.org/10.1101/001198
doi: bioRxiv preprint first posted online Dec. 10, 2013;
2011) (http://fsl.fmrib.ox.ac.uk/fsl/fslwiki/FIRST), and their ac-curacy visually controlled using in-house software. All volumes were log10 converted. Their distribution is illustrated in Fig. S1. Despite the differences in average volume (from ~1 cm3 for the amygdala, to ~1,300 cm3 for total brain volume, Fig. S1), all structures showed a similar variability – there was a ~1.8-fold change from the smallest to the largest volume in the cohort. The correlation matrix for all phenotypes analysed is shown in Table S1.
Genotyping and quality control
We used the autosomal SNPs common to the Illumina 610-Quad and Illumina 660W-610-Quad chips, and strict filtering to conserve high-quality SNPs only (minor-allele frequency >5%, genotyping rate >99%, significance threshold for Hardy-Wein-berg equilibrium test <10-6, subjects missing genotyping <10%,
using PLINK (Purcell et al., 2007),
http://pngu.mgh.harvard.edu/~purcell/plink). We further ex-cluded SNPs in strong linkage disequilibrium (R2>0.9) within a window of 50 SNPs to prevent colinearity in our analyses. The final genotyping data consisted of 269,308 SNPs.
Estimation of variance captured by SNPs
The variance of a phenotype attributable to genetic factors is classically estimated by comparing the correlation between pairs of monozygotic (MZ) and dizygotic (DZ) twins. Pairs of MZ and DZ twins share a common maternal environment dur-ing foetal life, but MZ twins share 100% of their genomes whereas DZ twins share on average 50% of it. If the variance of the phenotype is affected by genetic factors, the correlations between MZ twins will be larger than those observed in DZ twins. The amount of variance due to genetic factors can be then estimated using Falconer’s formula (Falconer, 1965), or more accurately, by using the restricted maximum likelihood method (Corbeil & Searle, 1976) (REML). The twin study design can be extended to the analysis of more complex family relationships, by using the levels of relationship expected from the pedigrees. In neuroscience, this approach has been success-fully used to show that genetic factors explain an important part of the variance of several neuroanatomical phenotypes such as brain volume (Stein et al., 2012), cortical surface extension (Winkler et al., 2010) or white matter microstructure (Ko-chunov et al., 2010).
Twin and extended pedigrees studies provide important inform-ation on the role of genetic factors in determining neuroana-tomical phenotypes, but complementary approaches are needed to investigate the nature of these genetic factors. In the recent years, several research groups have attempted to discover the genetic bases of the high heritability of neuroanatomical pheno-types by studying, for example, their association with SNPs in candidate genes (BDNF (Pezawas et al., 2004), microcephaly genes (Rimol et al., 2010), etc.) or through genome-wide asso-ciation studies (Bis et al., 2012; Ikram et al., 2012; Stein et al., 2012). Yet these findings explain today only a minute part of the phenotypic variability.
The approach that we used here, implemented by the GCTA
software (Yang et al., 2010, 2011)
(http://www.complextraitgenomics.com/software/gcta), estim-ates the variance captured by a large number of SNPs (mod-elled as random effects), providing information at a level inter-mediate between twin studies and association studies. Like twin and extended pedigree studies, GCTA estimates the part of the phenotypic variance due to the matrix of genetic relation-ships among subjects. But instead of using levels of genetic re-lationship expected a priori from a pedigree, these levels are computed from genotyping data (Lynch & Ritland, 1999;
Rit-land, 1996; Yang et al., 2010). The relationship between pheno-type variance Var(y), the variance of the additive genetic effects
σ
g2
, and the residual variance
σ
e2 is formulated as fol-lows:Var
( y)=G σ
g 2+I σ
e 2 ,where G is the genetic relationship matrix, containing the de-gree of genetic relationship, and I is the identity matrix. In GCTA the level of genetic relationship between each pair of in-dividuals j and k – the entries of the G matrix – is calculated as a weighted average across all SNPs:
G
jk=
{
1
N
∑
i=1 N(x
ij−2p
i)(x
ik−2p
i)
2p
i(1− p
i)
,
if j ≠ k
1
+
N
1
∑
i=1 Nx
ij 2−(1+2p
i) x
ij+2p
i 22p
i(1− p
i)
, if j
=k
,where xij equals 0, 1 or 2 depending on whether the genotype of the i-th SNP of the j-th subjects is AA, AB or BB; pi is the al-lele frequency of SNP i; and N is the number of SNPs con-sidered in the analysis (in our case, N=269,308). The level of genetic relationship between two subjects is then a single value summarising how similar their genomes are.
GCTA estimates variance components using the Average In-formation REML (Gilmour, Thompson, & Cullis, 1995) (AI-REML) method – a variant of the classic REML that provides a more efficient estimation even if the G matrix is large. The stat-istical significance of the genetic variance estimates (the P-val-ues reported here) were computed using a maximum likelihood ratio test (LRT) comparing the complete model which includes the genetic effect, to a partial model which excludes it. In REML analyses, LRT values are distributed as a 50% mixture of 0 and a Chi-square with degrees of freedom (df) equal to the number of genetic relationship matrices being tested. The LRT values and the corresponding degrees of freedom for the tests are indicated in the LRT column of Supplementary Tables S2, S4, S6-7.
Confounding factors
Several confounding factors could affect our variance estim-ates. For all our analyses we included age, sex and scanning centre as covariates. Additional analyses including Pubertal Development Scale scores (Carskadon & Acebo, 1993) did not affect the results and this covariate was no longer included in the model. Population structure might also affect neuroanatom-ical diversity or bias our variance estimates:
1. Our estimates could be affected by cryptic relatedness if our cohort included subjects distantly related. In that case, pheno-typic similarity could be partly due to shared environment ef-fects or familial causal variants not captured by SNPs. To prevent this, we excluded subjects with a genetic relationship > 0.025 (i.e., more related than 3rd or 4th cousins).
2. We used Admixture (Alexander, Novembre, & Lange, 2009) (http://www.genetics.ucla.edu/ software/admixture) to estim-ate individual ancestry relative to the reference populations in HapMap 3 (“The International HapMap Project.,” 2003) (http://hapmap.ncbi.nlm.nih.gov). The result (Fig. S2) showed that individuals in our cohort have a strong European ancestry component.
3. It has been shown that including as covariates the first prin-cipal components of the matrix of identity-by-state (IBS) dis-tance between subjects efficiently accounts for population structure effects (A. L. Price et al., 2006; A. Price, Zaitlen, Reich, & Patterson, 2010). Usually, the first 4 or 5 principal components are included. Here, we included the first 10 prin-cipal components in all our analyses. We observed, however, that not including them affected only marginally our variance estimates. On average, the difference between estimates in-cluding and exin-cluding the first 10 principal components of the IBS matrix was of 0.6%, not significantly different (2-tailed t-test, P=0.9346).
4. Partitioning the variance explained by SNPs between genic and nongenic showed that in many cases the former ex-plained significantly more variance than the latter (see bellow for a description of the method). For example, SNPs within genes ± 50kbp explain 91% of the total variance of ICV cap-tured by SNPs. If our estimates were driven by population structure effects, we could expect an excess of Ancestry In-formative Markers (AIMs) within the genic SNP set. We ob-tained a list of 1,442 AIMs from Tian and collaborators (Tian et al., 2008), 604 of which were contained in our SNP list. There was no statistically significant difference in the number of AIMs between our genic and nongenic SNP sets (375 genic AIM versus 229 nongenic AIMs, Fisher's exact test P=0.1723), and if anything, there was a tendency for AIMs to be underrepresented within the genic SNP set (Fisher's exact test P=0.0892).
These analyses suggest that population stratification effects did not play a major role in the determination of neuroanatomical variability in our cohort (Table S2).
Estimation of statistical power
We simulated 10,000 phenotypes with different heritability val-ues, supported by a different number of causal SNPs. We uni-formly sampled heritability values in the range from 0 to 80%, and number of causal SNPs from 1 to 10,000. The causal vari-ants were selected from the non-pruned list of SNPs (~518k SNPs), but the genetic relationship matrices were computed us-ing only SNPs from the pruned set (~270k SNPs). In con-sequence, the effect of some of the causal variants would be only captured through their linkage disequilibrium with the SNPs retained in the pruned list. Statistical power achieved to detect a given heritability was estimated as the proportion of test with P<0.05 (Figure 4).
Correlation between SNP set size and VG/VP
We constructed genetic relationship matrices for 3 sets of non-overlapping, randomly selected, SNPs of small, medium and large size. These sets were drawn from all genotyped SNPs, or only from genic SNPs (Ref. Seq.±50kbp), or nongenic SNPs. We ensured that small, medium and large sets contained the same number of SNPs in all 3 groups by selecting 20%, 30% and 50% of the total number of nongenic SNPs, the less numer-ous group. We performed 100 repetitions of this procedure, each time randomly selecting non-overlapping sets of 20%, 30% and 50% (20%+30%+50%=100%) of SNPs from all gen-otyped SNPs, or only from the genic or nongenic subgroups. For each repetition, we computed the correlation between VG/VP and set size. Correlation coefficients were converted to Z values using Fisher’s transformation, and the distribution tested against the null-hypothesis of no correlation (2-tailed t-test). The amount of variance of ICV, BV, subcortical volumes, height, VIQ and PIQ explained by the low, medium and long sets correlated significantly with the size of the SNP set (Figure 2).
Partition of VG/VP
We partitioned VG/VP among non-overlapping sets of SNPs, for example, genic and nongenic SNPs (2 sets) or SNPs of low, medium and high minor-allele frequency (MAF, 3 sets), etc. We computed a genetic relationship matrix
G
i for each of these n sets, and used them as random effects in our model. The variance of our phenotypesVar
( y)
was therefore de-composed asVar
( y)=
∑
i=1 nG
iσ
gi 2+I σ
e 2 ,where the number of sets would be n=2 for the case of a genic versus nongenic partition, or n=3 in the case of a partition into low, medium and high MAF.
The LRT columns in Supplementary Tables S4, S6-7 indicate the value of the likelihood ratio test comparing the complete model (including all genetic relationship matrices) to the partial model that includes only the residual variance component. The Pmodel columns indicate the statistical significance of these val-ues given the number of variance components tested (degrees of freedom).
As a posteriori analyses, we tested whether the variance ex-plained by one of these sets, genic SNPs for example, was lar-ger than what could be expected given its number of SNPs. The total genetic variance explained is
V
T=
∑
i=1n
V
i ;where N is the total number of SNPs, and Ni the number of SNPs in set i, i=1,...,n. If all SNP sets were equivalent, then the amount of variance they explain should be simply proportional to their length, and then
EV
i=
N
iN
V
T ,where EVi is the expected amount of variance explained by the i-th set. We wanted to test whether the difference Vi-EVi was significantly larger than 0, so we constructed a Z-score
Z
i=
V
i−EV
i√
V
test , whereV
test=Var(V
i−EV
i)
.Note that Vi here is the estimated explained variance for group i – a random variable; whereas EVi is a fixed value. We com-pared the observed value of Zi with those obtained from >10,000 random permutations, where n non-overlapping SNP sets of size Ni were randomly sampled from all available SNPs (without replacement).
Partition of VG/VP based on involvement in central nervous
system function
not peer-reviewed) is the author/funder. All rights reserved. No reuse allowed without permission.
The copyright holder for this preprint (which was .
http://dx.doi.org/10.1101/001198
doi: bioRxiv preprint first posted online Dec. 10, 2013;
We looked at the proportion of VG/VP that could be attributed to genes preferentially expressed in the central nervous system, playing a role in neuronal activity, learning, or involved in syn-aptic function. We used the set of 2,725 genes defined by Raychaudhuri and collaborators (Raychaudhuri et al., 2010) and previously used in the SNP-based heritability analyses of the susceptibility to schizophrenia by Lee and collaborators (Lee et al., 2012). We made 3 SNP sets: the 1st set, CNS+, con-tained all SNPs within ±50 kbp of the 5’ and 3’ UTR of the gene set (N=61,175, 23% of the total number of SNPs); the 2nd set, CNS-, contained all the remaining genic SNPs (N=113,160, 42% of the total number of SNPs); and the 3rd set regrouped all nongenic SNPs. As before, the genetic-relationship matrices computed using these 3 SNP sets were used in a single linear mixed model. We found that the amount of variance explained by the CNS+ set was not significantly different than what we expected from its size (Table S6).
Partition of VG/VP based on MAF
Allele frequency variations may provide hints about the evolu-tionary history of a trait. We estimated the proportion of VG/VP that can be attributed to sets of SNPs with low (5-20%), me-dium (20-35%) and high (35-50%) minor allele frequencies. SNPs in the low-frequency set were the most numerous, 48% of all SNPs, followed by medium-frequency SNPs (30%), and high-frequency alleles (22%). Table S7 shows the result of fit-ting a linear mixed model with the 3 genetic-relationship matrices computed using the low, medium and high-frequency, in addition to the same fixed effects as previously. We could expect each set to explain a fraction of the variance correspond-ing to the proportion of the total number of SNPs they repres-ent. Furthermore, because SNPs of high MAF are individually more informative than those with low minor-allele frequency, they could potentially explain more variance (the variance of the genetic-relationship matrices increased from the low to the medium to the high frequency set). However, the amount of variance explained by the different sets was not significantly larger than what we expected from their size.
Global test on P-values
We performed our analyses on 12 correlated phenotypes (9 brain regions, plus Height, VIQ and PIQ). Because of these correlations, a standard Bonferroni correction would be too conservative. Indeed, after Bonferroni correction, just a few results would remain statistically significant. However, under the null hypothesis we should expect around 5% of these tests to be significant, but the observed number of P-values <0.05 was much larger. To test the significance of this excess we con-structed a statistic S from the list of P-values converted to Z-values obtained for each phenotype:
S
=
∑
i=1m
ISF
( p
i)
,where m=12 is the number of tests performed and ISF stands for the inverse survival function of the normal distribution. We then generated the distribution of S under the null hypothesis by drawing from a multivariate Gaussian distribution with a variance-covariance structure given by the correlation matrix across phenotypes (Table S1). The significance of the excess of P-values was estimated as the proportion of scores under the null hypothesis that were greater than the observed score. The result of this global test is indicated at the final row of supple-mentary tables S2, S4-6.
ACKNOWLEDGEMENTS
This work was supported by the European Union-funded FP6 Integrated Project IMAGEN (Reinforcement-related behaviour in normal brain function and psychopathology) (LSHM-CT-2007-037286), the FP7 projects ADAMS (Genomic variations underlying common neuropsychiatric diseases and diseases re-lated to cognitive traits in different human populations) (242257), the Innovative Medicine Initiative Project EU-AIMS (115300-2), the Medical Research Council Programme Grant “Developmental pathways into adolescent substance abuse” (93558), the Swedish Funding Agency FORMAS, the German Bundesministerium und Forschung (FKZ: 01EV0711), Institut Pasteur, CNRS, Université Paris Diderot, the Betten-court-Schueller Foundation, the Conny-Maeva Foundation, the Orange Foundation, the FondaMental Foundation and the Cognacq-Jay Foundation. RT thanks Hong Lee, Jian Yang and Naomi Wray for their help.
AFFILIATIONS
1 Human Genetics and Cognitive Functions, Institut Pasteur, Paris, France
2 CNRS URA 2182 “Genes, synapses and cognition”, Paris, France
3 Université Paris Diderot, Sorbonne Paris Cité, Human Genet-ics and Cognitive Functions, Paris, France
4 Henry H. Wheeler, Jr. Brain Imaging Center, University of California at Berkeley, Berkeley, United States of America 5 Neurospin, Commissariat à l'Énergie Atomique et aux Éner-gies Alternatives, Paris, France
6 Institute of Psychiatry, King’s College London, United King-dom
7 MRC Social, Genetic and Developmental Psychiatry Centre, London, United Kingdom
8 Department of Child and Adolescent Psychiatry and Psycho-therapy, Central Institute of Mental Health, Medical Faculty Mannheim, Heidelberg University, Mannheim, Germany 9 Institute of Neuroscience, Trinity College Dublin, Dublin, Ire-land
10 Universitaetsklinikum Hamburg Eppendorf, Hamburg, Ger-many
11 Department of Psychiatry, Université de Montreal, CHU Ste Justine Hospital, Canada
12 Department of Cognitive and Clinical Neuroscience, Central Institute of Mental Health, Medical Faculty Mannheim, Heidel-berg University, Mannheim, Germany
13 Department of Psychiatry and Psychotherapy, Campus Char-ité Mitte, CharChar-ité – Universitätsmedizin Berlin, Germany 14 Departments of Psychiatry and Psychology, University of Vermont, Burlington, Vermont, United States of America 15 Physikalisch-Technische Bundesanstalt (PTB), Braunschweig und Berlin, Germany
16 Department of Addictive Behaviour and Addiction Medicine, Central Institute of Mental Health, Medical Faculty Mannheim, Heidelberg University, Mannheim, Germany
17 Institut National de la Santé et de la Recherche Médicale, IN-SERM CEA Unit 1000 “Imaging & Psychiatry”, Université Paris Sud, Orsay, France
18 Assistance Publique Hôpitaux de Paris, Department of Ad-olescent Psychopathology and Medicine, Maison de Solenn, Université Paris Descartes, Paris, France
19 Rotman Research Institute, University of Toronto, Toronto, Canada
20 School of Psychology, University of Nottingham, United Kingdom
21 Montreal Neurological Institute, McGill University, Canada 22 The Hospital for Sick Children, University of Toronto,
Toronto, Canada
23 Department of Genetic Epidemiology in Psychiatry, Central Institute of Mental Health, Medical Faculty Mannheim, Heidel-berg University, Mannheim, Germany
24 Behavioural and Clinical Neurosciences Institute, Depart-ment of ExperiDepart-mental Psychology, University of Cambridge, United Kingdom
25 Department of Psychiatry and Psychotherapy, Technische Universität Dresden, Germany
26 Neuroimaging Center, Department of Psychology, Technis-che Universität Dresden, Germany
REFERENCES
Alexander, D. H., Novembre, J., & Lange, K. (2009). Fast model-based estimation of ancestry in unrelated individuals. Genome Research, 19(9), 1655–64.
doi:10.1101/gr.094052.109
Amaral, D. G., Schumann, C. M., & Nordahl, C. W. (2008). Neuroanatomy of autism. Trends in neurosciences, 31(3), 137–45. doi:10.1016/j.tins.2007.12.005
Bis, J. C., DeCarli, C., Smith, A. V., van der Lijn, F., Crivello, F., Fornage, M., … Srikanth, V. (2012). Common variants at 12q14 and 12q24 are associated with hippocampal volume. Nature genetics, 44(5), 545–51. doi:10.1038/ng.2237 Blokland, G. A. M., de Zubicaray, G. I., McMahon, K. L., &
Wright, M. J. (2012). Genetic and environmental influences on neuroimaging phenotypes: a meta-analytical perspective on twin imaging studies. Twin research and human genetics: the official journal of the International Society for Twin Stud-ies, 15(3), 351–371. doi:10.1017/thg.2012.11
Buckner, R. L., Head, D., Parker, J., Fotenos, A. F., Marcus, D., Morris, J. C., & Snyder, A. Z. (2004). A unified approach for morphometric and functional data analysis in young, old, and demented adults using automated atlas-based head size nor-malization: reliability and validation against manual measure-ment of total intracranial volume. NeuroImage, 23(2), 724– 38. doi:10.1016/j.neuroimage.2004.06.018
Carskadon, M. A., & Acebo, C. (1993). A self-administered rat-ing scale for pubertal development. The Journal of adoles-cent health: official publication of the Society for Adolesadoles-cent Medicine, 14(3), 190–195.
Cook Jr, E. H., & Scherer, S. W. (2008). Copy-number vari-ations associated with neuropsychiatric conditions. Nature, 455(7215), 919–923. doi:10.1038/nature07458
Corbeil, R. R., & Searle, S. R. (1976). Restricted maximum likelihood (REML) estimation of variance components in the mixed model. Technometrics, 18(1), 31–38.
Cox, R. W. (1996). AFNI: software for analysis and visualiza-tion of funcvisualiza-tional magnetic resonance neuroimages. Com-puters and biomedical research, 29(3), 162–73.
Cross-Disorder Group of the Psychiatric Genomics Consor-tium. (2013). Genetic relationship between five psychiatric disorders estimated from genome-wide SNPs. Nature Genet-ics, 45(9), 984–994. doi:10.1038/ng.2711
Davies, G., Tenesa, A., Payton, A., Yang, J., Harris, S. E., Liewald, D., … Deary, I. J. (2011). Genome-wide association studies establish that human intelligence is highly heritable and polygenic. Molecular psychiatry, 16(10), 996–1005. doi:10.1038/mp.2011.85
Falconer, D. (1965). The inheritance of liability to certain dis-eases, estimated from the incidence among relatives. Annals of Human Genetics, 29(1), 51–76. doi:10.1111/j.1469-1809.1965.tb00500.x
Gilmour, A. R., Thompson, R., & Cullis, B. R. (1995). Average Information REML: An Efficient Algorithm for Variance Parameter Estimation in Linear Mixed Models. Biometrics,
51(4), 1440–1450.
Ikram, M. A., Fornage, M., Smith, A. V., Seshadri, S., Schmidt, R., Debette, S., … Taal, H. R. (2012). Common variants at 6q22 and 17q21 are associated with intracranial volume. Nature genetics, 44(5), 539–44. doi:10.1038/ng.2245 Jenkinson, M., Bannister, P., Brady, M., & Smith, S. (2002).
Improved optimization for the robust and accurate linear re-gistration and motion correction of brain images. NeuroIm-age, 17(2), 825–841.
Klei, L., Sanders, S. J., Murtha, M. T., Hus, V., Lowe, J. K., Willsey, A. J., … Devlin, B. (2012). Common genetic vari-ants, acting additively, are a major source of risk for autism. Molecular Autism, 3(1), 9–9. doi:10.1186/2040-2392-3-9 Kochunov, P., Glahn, D. C., Lancaster, J. L., Winkler, A. M.,
Smith, S., Thompson, P. M., … Blangero, J. (2010). Genetics of microstructure of cerebral white matter using diffusion tensor imaging. NeuroImage, 53(3), 1109–16.
doi:10.1016/j.neuroimage.2010.01.078
Lee, S. H., DeCandia, T. R., Ripke, S., Yang, J., Sullivan, P. F., Goddard, M. E., … Wray, N. R. (2012). Estimating the pro-portion of variation in susceptibility to schizophrenia cap-tured by common SNPs. Nature genetics, 44(3), 247–50. doi:10.1038/ng.1108
Lee, S. H., Harold, D., Nyholt, D. R., Goddard, M. E., Zonder-van, K. T., Williams, J., … Visscher, P. M. (2013). Estimation and partitioning of polygenic variation captured by common SNPs for Alzheimer’s disease, multiple sclerosis and endo-metriosis. Human Molecular Genetics, 22(4), 832–41. doi:10.1093/hmg/dds491
Lynch, M., & Ritland, K. (1999). Estimation of pairwise re-latedness with molecular markers. Genetics, 152(4), 1753– 66.
Meyer-Lindenberg, A., & Weinberger, D. R. (2006). Intermedi-ate phenotypes and genetic mechanisms of psychiatric dis-orders. Nature Reviews Neuroscience, 7(10), 818–27. doi:10.1038/nrn1993
Park, J.-H., Wacholder, S., Gail, M. H., Peters, U., Jacobs, K. B., Chanock, S. J., & Chatterjee, N. (2010). Estimation of ef-fect size distribution from genome-wide association studies and implications for future discoveries. Nature genetics, 42(7), 570–5. doi:10.1038/ng.610
Patenaude, B., Smith, S. M., Kennedy, D. N., & Jenkinson, M. (2011). A Bayesian model of shape and appearance for sub-cortical brain segmentation. NeuroImage, 56(3), 907–22. doi:10.1016/j.neuroimage.2011.02.046
Pezawas, L., Verchinski, B. A., Mattay, V. S., Callicott, J. H., Kolachana, B. S., Straub, R. E., … Weinberger, D. R. (2004). The brain-derived neurotrophic factor val66met polymorph-ism and variation in human cortical morphology. The Journal of Neuroscience, 24(45), 10099–102. doi:10.1523/JNEUR-OSCI.2680-04.2004
Price, A. L., Patterson, N. J., Plenge, R. M., Weinblatt, M. E., Shadick, N. A., & Reich, D. (2006). Principal components analysis corrects for stratification in genome-wide association studies. Nature genetics, 38(8), 904–9. doi:10.1038/ng1847 Price, A., Zaitlen, N., Reich, D., & Patterson, N. (2010). New
approaches to population stratification in genome-wide asso-ciation studies. Nature Reviews Genetics, 11(7), 459–63. doi:10.1038/nrg2813
Purcell, S., Neale, B., Todd-Brown, K., Thomas, L., Ferreira, M. A. R., Bender, D., … Sham, P. C. (2007). PLINK: a tool set for whole-genome association and population-based link-age analyses. American Journal of Human Genetics, 81(3), 559–75. doi:10.1086/519795
Raychaudhuri, S., Korn, J., & McCarroll, S. (2010). Accurately assessing the risk of schizophrenia conferred by rare copy-number variation affecting genes with brain function. PLoS
not peer-reviewed) is the author/funder. All rights reserved. No reuse allowed without permission.
The copyright holder for this preprint (which was .
http://dx.doi.org/10.1101/001198
doi: bioRxiv preprint first posted online Dec. 10, 2013;
Genetics, 6(9). doi:10.1371/journal.pgen.1001097
Rimol, L. M., Agartz, I., Djurovic, S., Brown, A. a, Roddey, J. C., Kähler, A. K., … Andreassen, O. a. (2010). Sex-depend-ent association of common variants of microcephaly genes with brain structure. Proceedings of the National Academy of Sciences of the United States of America, 107(1), 384–8. doi:10.1073/pnas.0908454107
Ritland, K. (1996). A Marker-Based Method for Inferences About Quantitative Inheritance in Natural Populations. Evol-ution, 50(3), 1062–1062. doi:10.2307/2410647
Schumann, G., Loth, E., Banaschewski, T., Barbot, A., Barker, G., Büchel, C., … Struve, M. (2010). The IMAGEN study: reinforcement-related behaviour in normal brain function and psychopathology. Molecular psychiatry, 15(12), 1128–39. doi:10.1038/mp.2010.4
Smith, S. M., Jenkinson, M., Woolrich, M. W., Beckmann, C. F., Behrens, T. E. J., Johansen-Berg, H., … Matthews, P. M. (2004). Advances in functional and structural MR image ana-lysis and implementation as FSL. NeuroImage, 23 Suppl 1(Supplement 1), S208–S219.
Steen, R. G., Mull, C., Mcclure, R., Hamer, R. M., Jeffrey, A., Steen, A. N. T., & Lieberman, J. A. (2012). Brain volume in first-episode schizophrenia : Systematic review and meta-analysis of magnetic resonance imaging studies REVIEW ARTICLE AUTHOR ’ S PROOF Brain volume in first-epis-ode schizophrenia Systematic review and meta-analysis of magnetic resonance i, i, 510–518. doi:10.1192/bjp.188.6.510 Stein, J. L., Medland, S. E., Vasquez, A. A., Hibar, D. P.,
Sen-stad, R. E., Winkler, A. M., … Bergmann, Ø. (2012). Identi-fication of common variants associated with human hippo-campal and intracranial volumes. Nature genetics, 44(5), 552–61. doi:10.1038/ng.2250
The International HapMap Project. (2003). Nature, 426(6968), 789–96. doi:10.1038/nature02168
Tian, C., Plenge, R. M., Ransom, M., Lee, A., Villoslada, P., Selmi, C., … Seldin, M. F. (2008). Analysis and application of European genetic substructure using 300 K SNP informa-tion. PLoS Genetics, 4(1), e4–e4.
doi:10.1371/journal.pgen.0040004
Winkler, A. M., Kochunov, P., Blangero, J., Almasy, L., Zilles, K., Fox, P. T., … Glahn, D. C. (2010). Cortical thickness or grey matter volume? The importance of selecting the pheno-type for imaging genetics studies. NeuroImage, 53(3), 1135– 46. doi:10.1016/j.neuroimage.2009.12.028
Yang, J., Benyamin, B., McEvoy, B. P., Gordon, S., Henders, A. K., Nyholt, D. R., … Visscher, P. M. (2010). Common SNPs explain a large proportion of the heritability for human height. Nature genetics, 42(7), 565–9. doi:10.1038/ng.608 Yang, J., Manolio, T. a, Pasquale, L. R., Boerwinkle, E., Ca-poraso, N., Cunningham, J. M., … Visscher, P. M. (2011). Genome partitioning of genetic variation for complex traits using common SNPs. Nature genetics, 43(6), 519–25. doi:10.1038/ng.823
Zhang, Y., Brady, M., & Smith, S. (2001). Segmentation of brain MR images through a hidden Markov random field model and the expectation-maximization algorithm. IEEE Transactions on Medical Imaging, 20(1), 45–57. doi:10.1109/42.906424