Summary Partial forest harvesting is known to modify both above- and belowground resource availability and may result in direct and indirect stress to the residual trees as a result of machinery traffic and sudden changes in irradiance. We studied sugar maple (Acer saccharum Marsh.) trees in stands that had undergone a selection harvest 11 years before sampling to ver-ify whether sudden increases in light availability and soil dis-turbance caused by machinery influence growth rates and lead to water stress. We selected trees that had experienced either no disturbance from partial harvest, soil disturbance only, sudden increases in light availability only or both disturbances. We an-alyzed stem radial growth rates and stable carbon isotope com-position (δ13C) of stem wood with an annual resolution from 10 years before partial harvest until 10 years after partial har-vest. Disturbances from partial harvest did not negatively af-fect growth rates or tree water status. Although trees that expe-rienced increased light availability had higher (less negative) δ13C after harvest (indicating increased water-use efficiency), they also had higher growth rates, suggesting that they experienced no pronounced water stress. Trees subjected to soil disturbance showed no sign of water stress. These results may partly be associated with favorable growth conditions (abundant precipitation and mild temperature) in the years following harvest and could differ from results that would be observed under more severe climatic conditions.
Keywords: Acer saccharum, light availability, selection cut, soil disturbance, tree water status.
Introduction
Partial forest harvests remove varying proportions of canopy and understory trees to liberate resources, thereby improving growth conditions of the released residual trees (Smith et al. 1997). Increased growth rates of residual trees following par-tial harvest have been reported for trees of different species and ages (e.g., Drew and Flewelling 1979, Bodner 1984, Kneeshaw et al. 2002, Jones and Thomas 2004). Partial har-vest results in higher growth rates of residual canopy trees
through increases in light interception of the exposed tree crowns (Wyckoff and Clark 2005), accompanied by adjust-ments in the lower-canopy leaves to higher maximum area-based photosynthetic rates and higher stomatal conductances (Jones and Thomas 2007). Hence, increases in light intercep-tion can increase both photosynthetic rates and transpiraintercep-tional water demands.
Residual trees located close to skid trails may be subjected to root damage (Rönnberg 2000, Ouimet et al. 2005) and soil compaction (Kozlowski 1999), which may impair root devel-opment (Taylor and Brar 1991). Reduced water availability in compacted soils (Starsev and McNabb 2001) and decreased water uptake by damaged root systems both reduce the water supply to affected trees. Trees may mitigate effects of limited water availability by down-regulating transpiration either by decreasing canopy leaf area or by reducing stomatal conduc-tance (Sperry 2000, Sperry et al. 2002).
Experimental studies of tree responses to stand thinning are often limited to a few measurements made during one or two growing seasons (e.g., Bréda et al. 1995, Stoneman et al. 1997, Jones and Thomas 2007). In contrast, tree rings provide an in-tegrated reflection of environmental conditions at the time when the wood was deposited (Saurer et al. 1997). Tree rings can reveal not only growth responses, but also the photosyn-thetic behavior of trees for thousands of years, with an annual resolution (McCarroll and Loader 2004). Moreover, fluctua-tions in stable carbon isotope ratios (δ13C) of tree rings have been used to reconstruct past climate conditions (e.g., Lipp et al. 1991), and have proved useful in contemporary ecophysio-logical studies relating climatic variables to physioecophysio-logical pro-cesses such as respiration (e.g., Berninger et al. 2000, Bowling et al. 2002, 2003, Fessenden and Ehleringer 2003).
Variations inδ13C may be caused by increases in photosyn-thetic rate at constant stomatal conductance. Scheidegger et al. (2000) used information on evaporative enrichment in the δ18O of plant matter to distinguish between biochemical and stomatal limitations to photosynthesis in response to changes in environmental conditions (e.g., precipitation). Saurer et al. (1997) proposed linking growth rates with variations inδ13C to © 2008 Heron Publishing—Victoria, Canada
Effects of above- and belowground partial harvest disturbance on
growth and water status of residual sugar maple
HENRIK HARTMANN,
1,2CHRISTIAN WIRTH,
3CHRISTIAN MESSIER
1and FRANK
BERNINGER
11Département des Sciences Biologiques, Centre d’Étude de la Forêt (CEF), Université du Québec à Montréal, C.P. 8888, succ. Centre-ville,
Montreal, QC H3C 3P8, Canada
2
Corresponding author ([email protected])
3
Max-Planck-Institute for Biogeochemistry, Hans-Knöll-Strasse, 10, 07745 Jena, Germany
indicate whether photosynthetic rate or stomatal conductance caused variations inδ13C in response to environmental condi-tions. (1) If enhanced photosynthetic rate at constant stomatal conductance (i.e., no water stress) increasesδ13C, growth rates should increase simultaneously. (2) If increased stomatal con-ductance (i.e., decreasing water stress) increases CO2supply thereby increasing photosynthetic rate,δ13C should decrease and growth rates increase. (3) If the plant controls stomatal conductance and photosynthetic capacity simultaneously, δ13
C may stay constant. In this scenario, growth rates may vary depending on the tree’s ability to adjust to prevailing growth conditions (i.e., irradiance, water supply). Similarly, a con-stant photosynthetic rate and reduced stomatal conductance (due to reduced water supply) will yield higherδ13C and lower growth rates.
We investigated the responses of radial growth rates and sta-ble carbon isotope discrimination in stem wood of residual sugar maple trees (Acer saccharum Marsh.) following partial harvest. Trees were classified according to the degree of im-pact (soil disturbance, light increases) of the partial harvest. To interpret changes in radial growth and13C discrimination in re-sponse to harvest disturbance, application of the theoretical framework of Saurer et al. (1997) allowed us to formulate four hypotheses (sensu Saurer et al. 1997): (1) undisturbed trees (no light increase, no soil disturbance) should show no signifi-cant changes in either growth rates orδ13C following harvest (constant photosynthetic rate at constant stomatal conductance and no water stress); (2) trees subjected to sharply increased ir-radiances, but no soil disturbance, should show higher growth rates and less negativeδ13C values following harvest; (3) trees experiencing soil disturbance but no increase in irradiance should have constant (or decreasing) growth rates and less negativeδ13C values following harvest, and (4) trees experi-encing sharply higher irradiances and soil disturbance should have decreased growth rates and much less negativeδ13C val-ues following harvest.
Materials and methods Study site
The study sites are located in western Quebec (Canada,
46°43′ N, 79°04′ W). The region has a mean annual tempera-ture varying from 2.5 to 5.0 °C. The growing season extends over 170 to 180 days. Mean annual precipitation ranges from 800 to 1000 mm, with snowfall comprising about 25% of the total (Gosselin et al. 2000). Soils are podzols with sandy to loamy texture, and are derived principally from glacial tills or fluvio-glacial deposits (Robitaille and Saucier 1998).
Study plots
In 2004 and 2005, 19 plots (26 × 56 m) were established in sugar maple stands located on level ground or on gentle slopes with good to moderate drainage. The stands experienced a se-vere outbreak of forest tent caterpillar (FTC, Malacosoma disstria Hubner) in 1988, and had been harvested by selection cuts in 1993 or 1994. The selection cut aimed to remove ~30% of stand basal area across age- and diameter classes while maintaining the preexisting species proportions. Mean pre-harvest basal area (BA) was reduced from 27 to 21 m2ha–1. Tree marking aimed mainly at removing low quality low vigor trees to increase overall post-harvest stand quality. Tree felling was done manually with chainsaws and whole trees were for-warded to forest roads with cable skidders. Skid trails were spaced about 15 m apart, but spacing was not constant along the trail path, so that some areas were more affected by ma-chine traffic than others.
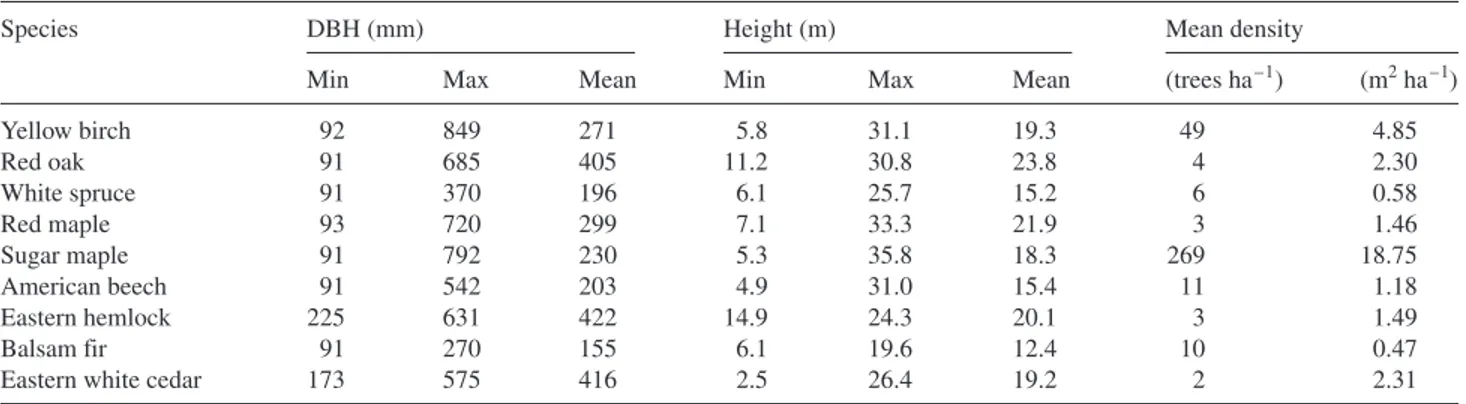
Sugar maple is the most frequent species in most plots (about 70% of total BA), followed by yellow birch (Betula alleghaniensis Britton, 18%), red oak (Quercus rubra L., 3.0%). American beech (Fagus grandifolia Ehrh., 2.3%), east-ern hemlock (Tsuga canadensis (L.) Carr., 1.8%), easteast-ern white cedar (Thuja occidentalis L., 1.6%), and red maple (Acer rubrum L., 1.5%). Other species occur in minor propor-tions (= 1% of total BA, Table 1), and included balsam fir (Abies balsamea (L.) P. Mill.) and white spruce (Picea glauca (Moench) Voss). Mean post-harvest diameter at breast height (DBH, 1.3 m above ground) ranged between 155 mm for bal-sam fir and 422 mm for eastern hemlock. Canopy height reached 19.2 m in eastern white cedar and up to 23.8 m in red oak (Table 1).
Within the plots, the DBH of all live and dead trees > 9.1 cm DBH, and the diameter at stump height (dsh) of all stumps
Table 1. Minimum, maximum and mean tree diameter at breast height (DBH) at time of sampling (2004–2005), tree height and mean tree density per species in the sample plots.
Species DBH (mm) Height (m) Mean density
Min Max Mean Min Max Mean (trees ha–1) (m2ha–1)
Yellow birch 92 849 271 5.8 31.1 19.3 49 4.85 Red oak 91 685 405 11.2 30.8 23.8 4 2.30 White spruce 91 370 196 6.1 25.7 15.2 6 0.58 Red maple 93 720 299 7.1 33.3 21.9 3 1.46 Sugar maple 91 792 230 5.3 35.8 18.3 269 18.75 American beech 91 542 203 4.9 31.0 15.4 11 1.18 Eastern hemlock 225 631 422 14.9 24.3 20.1 3 1.49 Balsam fir 91 270 155 6.1 19.6 12.4 10 0.47
(stump height≅ 0.5 m above ground) from the 1993–1994 har-vest were measured and their positions mapped. Mapping was accomplished by laying out a virtual grid on the forest floor for which the plot center line served as the Y-axis. The X-coordi-nates were determined by measuring (with a Vertex III hypsometer, Haglöf Sweden AB) the perpendicular distances of tree positions from the center line. Orientation (magnetic azimuth) of the plot center line was measured with a standard forester’s compass.
Skid trails from the 1993–1994 harvest were also measured. Because regeneration and litter accumulation since harvest (about 11 years) made skid trail identification difficult, we used several indicators as evidence: (1) linear openings in the canopy; (2) ruts and tire (or skid) wounds at tree bases; (3) dense undergrowth of light- and soil-disturbance-dependent species (e.g., yellow birch, pin cherry (Prunus pensyl-vanica L.f.), poplars (Populus spp.)); (4) stumps in the prox-imity to the proposed skid trail path; (5) absence of obstacles (e.g., boulders, escarpments); (6) conformity with machinery constraints (e.g., turning radius); and (7) general concordance with the trail network and stand features. Only when all of these criteria were satisfied were skid trails considered for further analysis.
We drew the skid trail paths as the estimated center of the skid trails on the tree maps using tree positions as landmarks. We could not directly measure trail width because of forest floor vegetation and litter accumulation and so we assumed that the skid trails were 2-m wide on either side of the central path, based on an approximate but realistic machine width of 4 m.
We evaluated the impact of machine traffic on soil bulk den-sity by measuring penetration resistance with a dynamic pen-etrometer (PEM-1, Roctest Inc., Montreal, QC, Canada). We measured the penetration depth after 10 blows and computed the ratio of penetration depth per blow. In each plot, we took five measurements at about 1-m intervals across each of three transects on the skid trails and three transects in the undis-turbed forest floor. For the skid trail measurements, we se-lected only trail sections with clearly defined trail features (wheel tracks, inter-wheel space, off trail). Transect locations were chosen randomly, and the five measurement points on the skid trails were made such that Measurements 1 and 5 were off-trail, Measurements 2 and 4 were on wheel tracks, and Measurement 3 was in the inter-wheel space.
Tree-ring width data
In the mapped plots, increment cores (three cores per tree) were taken from all sugar maple trees between 19.1 and 49.0 cm DBH as a retrospective measure of radial growth. Trees with DBH < 19.1 cm were not sampled to avoid the juve-nile effect in 13C discrimination (Freyer 1979, Francey and Farquhar 1982) and to avoid trees with heavily suppressed growth. Trees with DBH > 49.0 cm were not sampled, to avoid trees with declining growth rates. We sampled a total of 321 sugar maple trees.
Increment cores were progressively sanded down to grain 400 to allow unambiguous identification of tree rings. We
measured tree rings with a microscope equipped with a com-puter-assisted micrometer (0.001 mm precision). At least two cores per tree were readable in most cases, and we took mean ring widths among cores to account for intra-tree variability in radial increment (Kienholz 1930, Peterson and Peterson 1995). This yielded a single growth chronology per tree.
We took radial growth measurements of dominant canopy trees to construct a master chronology by adding progressively highly correlated (r = 0.3, Tardif et al. 2001) tree-ring series to the existing series and obtained a final master chronology con-taining 29 individual tree-ring series with an overall cross-cor-relation coefficient of 0.479.
We cross-dated (matched tree rings with calendar years) the remaining tree-ring series based on (1) visual examination of marker years (severe growth declines in 1971 and 1988) and (2) cross-correlation coefficients of chronology segments with the master chronology. We ran the computer software program COFECHA (Holmes 1983, Grissino-Mayer 2001) to detect missing or false rings in individual segments of tree-ring se-ries. In suspect cases, we identified false or missing rings on the cores or cross sections and added tree rings with zero width or removed these from the series. We then reran COFECHA on these series to verify improvements of the cross-correlations with the master chronology.
Only trees whose ring-width series showed strong cross-correlations (r > 0.4) with the master chronology were re-tained for further analysis. To exclude harvest disturbance un-related to sudden increases in irradiance or soil disturbance from influencing the growth and carbon isotope responses, data from trees with severe harvest damage (e.g., uprooting, bole breakage) were excluded from the analysis.
We standardized each individual tree-ring series by dividing it by its long-term growth trend, which was estimated with a cubic smoothing spline over the entire series. The resulting dimensionless ring-width indices could be more adequately compared among trees of different ages and from different sites. This standardization procedure was performed with the i.detrend function in the R software progam dplR (Bunn 2007) in the R software environment for statistical computing and graphics (Version 2.6.0).
Because stable carbon analysis was limited to the period 1983–2003 (see below), the growth series were truncated for further analysis during these years. To reduce inter-tree differ-ences in ring-width indices before harvest, we rescaled each series individually by dividing each ring-width series by its pre-harvest (1983–1993) mean. These rescaled values could be more adequately compared and averaged over treatment groups than series of raw ring-width indices.
Measures of harvest disturbance
Sudden changes in light conditions Because the partial har-vest took place 11 years before sampling, changes in light con-ditions could not be measured directly and had to be estimated retrospectively. Based on spatial information on trees and stumps from the last harvest, we simulated pre-harvest stand conditions. To achieve this, we converted diameters at stump height of tree stumps to DBH values with existing conversion
tables (MRNFP 2003), and these were considered the DBH measurements of cut trees before harvest. When external crite-ria for dead trees such as the presence of bark and fine branches, stem wood decay or crown deterioration (Sénécal et al. 2003) indicated that these trees died only after harvest, we considered these trees as being alive in the pre-harvest stands (2.9% of all trees). The DBH measurements and estimates of all trees present before harvest (live trees + cut trees + trees that died after harvest) and of trees present after harvest (live trees only) were then loaded into the forest dynamics simulator SORTIE to estimate light availability for individual trees. Deutschman et al. (1997) have provided a comprehensive overview of SORTIE’s structure and simulation procedure.
We parameterized SORTIE with regional parameters of tree species allometry and tree canopy light extinction coefficients (Canham et al. 1994, Poulin and Messier 2007, Lefrançois et al. 2008, M. Beaudet, unpublished data). Based on these pa-rameters, SORTIE modeled tree dimensions and estimated light availability for each individual tree in the stand as the sea-sonally averaged percentage of full sun (Canham 1988). Esti-mates of light availability for each individual tree, in the center of simulated crowns at 0.75(crown height), were made for pre-and post-harvest plots. Dividing post-harvest light availability by pre-harvest light availability yielded our measure of changes in light conditions.
Soil disturbance in close proximity to trees Assuming that tree crown dimensions can be predicted from tree diameter, and that tree crown dimensions are a proxy for tree root system cov-erage (Tubbs 1977), a circular influence zone was estimated around each tree based on species-specific parameters of diam-eter–crown relationships. This yielded diameter-dependent in-fluence zones with radii (m) = 0.100(DBH) (cm) for sugar ma-ple (Beaudet et al. 2002). By overlapping the influence zones of the mapped trees with the mapped skidding trails, we ob-tained an estimate of the proportion of the influence zone that had been disturbed by machinery traffic. The ratio of the area of the influence zone disturbed by machinery traffic, divided by the total area of the influence zone, served as our measure of soil disturbance in close proximity to trees.
Disturbance classes All trees retained in the analysis were grouped into four disturbance classes: (1) trees not subjected to sudden increases in irradiance or soil disturbance (no distur-bance class), (2) trees subjected to sharp sudden increases (> 100%) in irradiance following harvest, but not subjected to soil disturbance (light class); (3) trees not subjected to sudden increases in irradiance, but subjected to soil disturbance (> 30% of influence zone) (soil class), and (4) trees subjected to both a sharp sudden increase (> 100%) in irradiance following harvest and soil disturbance (> 30% of influence zone) (light + soil class). For each disturbance class, we randomly selected five trees for growth and stable carbon isotope analyses. Sam-ple sizes were limited because of the large number of carbon isotope analyses (20 trees × 21 years = 420 analyses) and their associated costs.
The threshold for soil disturbance in each disturbance class
was set assuming that disturbance to > 30% of the forest floor surrounding trees had an effect on tree growth and water sta-tus, through its effects on soil compaction and root damage (Kozlowski 1999, Rönnberg 2000, Ouimet et al. 2005). The threshold for sudden increases in irradiance was set at > 100% because increases up to about 40% can still allow a gradual ac-climation of leaf-level photosynthetic rate in mature sugar ma-ple trees (Jones and Thomas 2007).
Stable carbon isotope analysis
The isotopic composition of a carbon compound (δ13C, ‰), i.e., the proportional deviation of the13C/12C ratio from the Vi-enna PeeDee belemnite (VPDB) carbonate standard, is defined as: δ13 13 12 sample 13 12 VPDB C = C / C C / C − ⎛ ⎝ ⎜⎜ ⎞⎠⎟⎟1 1000 (1)
The trees selected forδ13C analysis were felled and cross sections of the trunk were taken at 1.3 m height. To avoid car-bon contamination from chainsaw lubricants, small rectangu-lar pieces were cut from the interior of these cross sections with a band saw. The sections were then further cut to cover a 10-year period before and after the year of harvest, yielding a sampling period spanning from 1983 to 2003.
To prevent mobile substances and handling contamination from interfering with stable carbon isotope measurements, the wood sections were extracted with a 2:1 (v/v) toluene:metha-nol solution for several hours in a heated ultrasonic bath and oven-dried at 70 °C overnight (Loader et al. 1997). Single tree rings were then shaved from the wood sections with a surgical scalpel. These shavings were ball-milled to ensure that there was a homogeneous distribution of latewood and earlywood in the sample. Three of the wood sections had tree rings so tightly spaced that shaving with annual precision and subsequent milling was not feasible. These sections were therefore cut to dimensions that allowed their measurement by laser ablation combustion gas chromatography isotope ratio mass spectrom-etry (LA-C-GC-IRMS) (Schulze et al. 2004). All other milled wood samples were weighed into tin cups and assayed with a conventional elemental analyzer, (EA)-IRMS. Because the la-ser ablation technique necessitated the use of whole wood sec-tions, conventional isotope ratio analysis was also based on whole wood samples. Moreover, it has been shown that undecayed whole wood and extracted cellulose have consis-tentδ13C signatures, with whole-wood samples having slightly less negativeδ13C values (Loader et al. 2003). Laser trajecto-ries spanned the entire ring width so that ablated wood mate-rial contained both early- and latewood. Thus, averagedδ13C values were considered representative of entire tree rings.
Sequential isotopic analyses of milled wood samples were made with a Finnigan MAT DeltaPlus XL EA-IRMS (ThermoFinnigan GmbH, Bremen, Germany), coupled to an autosampler. For the laser ablation technique, wood dust was ablated from the samples with a frequency quadrupled Nd:YAG 266 nm UV-laser (New Wave Research Merchantek;
GeoLasArF, MicroLas, Göttingen, Germany). After combus-tion of the ablated wood dust, CO2was separated from other combustion gases and analyzed by mass spectrometry (Finnigan DeltaPlus XL EA-IRMS). Measurement precision ofδ13C analyses was < 0.1‰ for the milled wood samples and < 0.25‰ with the laser ablation technique, based on measure-ments of an internal lab standard (NBS 22: –30.03‰ on VPDB scale). All isotope measurements were made in the Iso-Lab of the Max-Planck-Institute for Biogeochemistry, Jena, Germany.
For consistency with ring-width measurements and to re-duce differences inδ13C between individual trees, we rescaled δ13C values by dividing individual time series by their pre-har-vest (1983–1993) mean. This rescaling implied that values be-low 1 are indicative of post-harvest increases inδ13C (less neg-ative) and, therefore, are indicative of constrained post-harvest water status. Values above 1 indicated improvements in water supply or decreases in water use, and therefore, were indica-tive of releases of the pre-harvest water status of trees.
We did not correctδ13C values for time trends due to CO 2 enrichment of the atmosphere. The time series spanned only 21 years and comparisons were made between disturbance classes for which atmospheric enrichment was identical.
Climate–growth and climate– 13C relationships
Mean monthly climate data (precipitation, temperature) were obtained from the Canadian National Climate Data and Infor-mation Archive of Environment Canada (http://cli-mate.weatheroffice.ec.gc.ca). Weather stations that were clos-est to our study sites (within about 60 km) were Barrage Temiscaming (46°42′36″ N, 79°06′00″ W, 181 m a.s.l.) and Rapide des Joachims (46°12′00″ N, 77°42′00″ W, 137 m a.s.l.). Acquisition of monthly climate data from Barrage Temiscaming was discontinued from 1995 onward. Therefore, we amended the dataset by adding data from Rapide des Joachims and mean values in overlapping years (1983–1995).
To quantify climate–growth and climate–δ13C relation-ships, we performed correlation and response function analy-ses with the program Dendroclim2002 (Biondi and Waikul 2004). The correlation function gives univariate estimates of Pearson’s product-moment correlation (r) between ring-width indices (orδ13C indices) and climate variables, whereas the re-sponse function is a principal component regression model of the multivariate climate data with ring-width indices (orδ13C indices) as the response variables. To account for multi-collinearity in climate data and to increase the accuracy of cor-relations and the response function analysis, Dendroclim2002 computes bootstrapped confidence intervals of the parameter estimates for both functions (Biondi and Waikul 2004). Only climate variables with consistently positive or negative param-eter estimates within the 95% bootstrapped confidence inter-val were considered significant.
Statistical analysis
We tested for differences in the rescaled ring-width indices and rescaledδ13C between disturbance classes by performing
a year-by-year analysis. Because of small sample sizes (5 trees per class × 4 classes per year = 20 measurements per year) and heteroscedasticity (differing variances) among groups, we did not use conventional parametric analysis of variance (ANOVA). Instead, we performed permutational analysis of variance (Anderson 2001, McArdle and Anderson 2001), with the program PERMANOVA (Anderson 2005). PERMA-NOVA tests assume that individual observations can only be exchanged under a true null hypothesis. The program provides a partitioning of variation, based on distance measures and ac-cording to treatment factors, and applies permutations to test for differences between groups (factor levels). First, the pro-gram estimates a distribution of the test statistic F under a true null hypothesis (i.e., no differences between groups) by ran-domly shuffling group labels among observations. For each permutation, PERMANOVA computes the test statistic F*. Probabilities for the tests under a true null hypothesis are com-puted as the proportion of all permutational F* values that are greater than or equal to the value of F observed for the real data (Anderson 2005). Similarly, pairwise comparisons are based on the permutational test statistic t* and probabilities for the test under a true null hypothesis are estimated as the propor-tion of all permutapropor-tional t* values that are greater than or equal to the value of t observed for the real data. For both test proce-dures, we used 4999 permutations to estimate F* and t* distri-butions as recommended by Anderson (2005). The signifi-cance level of permutational ANOVA wasα = 0.05, but this was adjusted for multiple comparisons using the Tukey correc-tion which, for six comparisons, yields an α threshold of 0.0085.
We compared pre- versus post-harvest values in rescaled ring-width indices and in rescaledδ13C within classes to test whether harvest caused a change in these variables within a given class. Significance tests of these comparisons were made with paired t-tests after confirming normality of the sample distributions with Kolmogorov-Smirnov tests.
Results
Mean DBH at the time of sampling (2004–2005) ranged from 241 mm (light + soil class) to 379 mm (soil class). Trees in the light class (n = 5) had a mean increase in light availability of more than 10 times the preharvest value. Mean soil distur-bance of trees in the soil class (n = 5) was 48.2% of the tree’s influence zone, whereas for trees that experienced soil distur-bance and increased light availability (light + soil class; n = 5), mean soil disturbance was 46.1% with a mean irradiance in-crease of 9.55 times preharvest light availability (Table 2).
Estimates of the impact of machine traffic on soil bulk den-sity showed that, even 11 years after harvest, penetration ratios (soil penetration per blow) were significantly lower in wheel tracks and in the inter-wheel space than off-trail or in the un-disturbed forest floor (Figure 1).
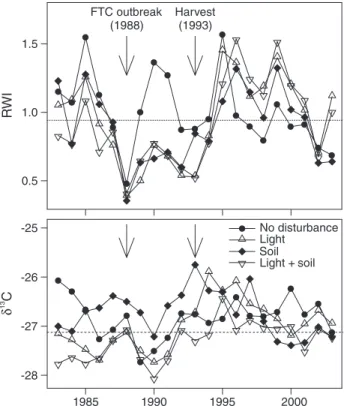
Ring-width indices showed a marked decline across all dis-turbance classes in 1988, the year of the FTC outbreak (Figure 2A). Pre-harvest growth rates in trees in the no
distur-bance class were higher than in trees in the other classes, espe-cially in the period following the insect outbreak. Growth rates increased after harvest in all classes, but only briefly for the trees in the no disturbance class where growth rate increases leveled off by 2001 (Figure 2A). Theδ13C showed some in-crease in 1988 in trees in all classes except the soil class (Fig-ure 2B). From 1988 to 1990,δ13C declined and then increased until 1993–1994 in trees in all classes. From 1994 onward, δ13C either declined (light and soil classes) or remained con-stant (no disturbance and light + soil classes) over time until 2003 (Figure 2B).
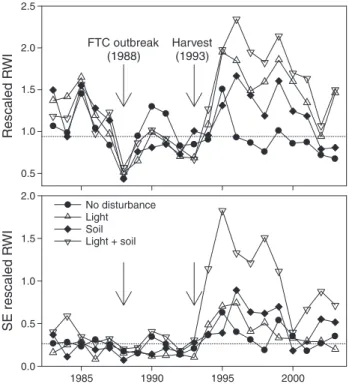
Rescaled ring-width indices declined below the pooled (all classes) pre-harvest mean twice within the 1983–2003 period. In 1988, which was the year of the FTC outbreak, rescaled growth indices of trees in all disturbance classes declined be-low the 1983–1993 mean (Figure 3A). However, trees in the different classes responded differently to the effects of partial harvest disturbance. Mean rescaled ring-width indices of trees in the light and the light + soil classes increased and stayed above pre-harvest values until 2003 (except for 2002, when the index for trees in the light class fell briefly and slightly below the mean). Mean rescaled ring-width indices of trees in the soil class showed a one-year lag in response, but increased in 1995 and stayed above the pre-harvest mean until 2002. Trees in the
no disturbance class showed only a brief increase in 1995 but fell below the pharvest mean immediately afterward and re-mained there until 2003 (Figure 3A). Standard errors of rescaled ring-width indices increased from harvest onward and were similar among trees in the no disturbance, light and soil classes, and highest in trees in the light + soil class (Fig-ure 3B).
From 1993 onward, rescaledδ13C stayed below the pre-har-vest mean in trees in all disturbance classes, except for the soil class, where it increased above the pre-harvest mean from 1998 onward (Figure 4A). Below-average values in rescaled δ13
C were equivalent to post-harvest increases inδ13C (i.e., less negative) relative to pre-harvest values, and therefore were indicative of water stress. Thus, mean rescaled post-har-Table 2. Mean diameter at breast height (DBH, at time of sampling), soil disturbance, the change in light availability (before versus after harvest) and height of trees in the no disturbance class and in the light, soil and light + soil disturbance classes. Values in parentheses are minima and max-ima (n = 5 trees per class).
Disturbance class DBH (mm) Soil disturbance (%) Light change ratio Height (m)
No disturbance 310 (215–456) 0 – 1 – 22.4 (17.2–25.8) Light 282 (237–360) 0 – 10.6 (2.5–26.3) 19.4 (16.9–23.4) Light + soil 241 (197–337) 46.1 (31.3–68.4) 9.6 (2.1–16.8) 18.1 (13.5–22.2) Soil 379 (344–410) 48.2 (37.0–52.6) 1 – 22.4 (18.1–29.5) ● ● ● ● ● ● 1.0 1.5 2.0 2.5 1 2 3 4 5 P enetr ation ratio (cm b lo w ) –1 Sample point x x x x x x Skid trail Forest floor
Figure 1. Penetration ratios (cm blow–1), an estimate of soil compac-tion, taken 11 years after harvest across skid trails or on the undis-turbed forest floor. Skid-trail Measurements 1 and 5 were off-trail, Measurements 2 and 4 were on wheel tracks, and Measurement 3 was in the inter-wheel space. Measurements 1 through 5 on undisturbed forest floor were spaced ~1 m apart. Filled circles indicate significant differences (P < 0.05, Mann-Whitney U-test) between skid-trail and forest-floor measurements at a given sample point.
● ● ● ● ● ● ● ● ● ● ● ● ● ● ● ● ● ● ● ● ● 0.5 1.0 1.5 FTC outbreak (1988) Harvest (1993) ● No disturbance Light Soil Light + soil ● ● ● ● ● ● ● ● ● ● ● ● ● ● ● ● ● ● ● ● ● -27 -28 -26 -25 1985 1990 1995 2000 RW I 13 C
Figure 2. Mean (A) ring-width indices (RWI) and (B)δ13C for trees in the no disturbance class and in the light, soil and light + soil distur-bance classes from 1983 to 2003. Horizontal lines are pooled means of all 1983–2003 values. Note the negative effect of the forest tent cat-erpillar (FTC) outbreak in 1988 on RWI in trees in all disturbance classes.
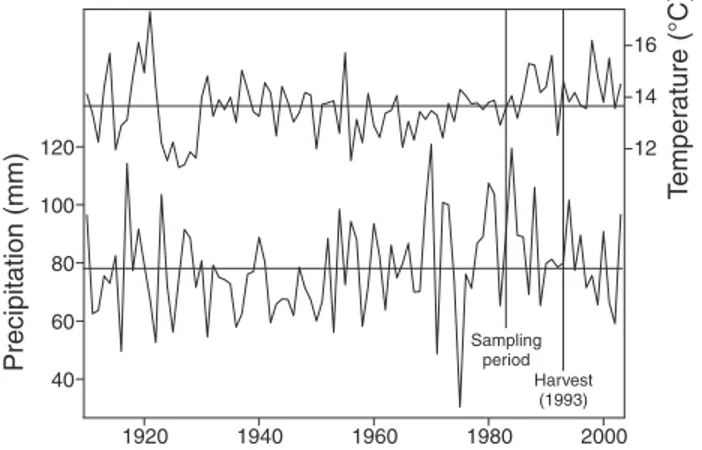
vestδ13C values were indicative of water stress in trees in the light and light + soil classes until 1998, after which they lev-eled off. Rescaled post-harvestδ13C values in trees in the no disturbance class were quite constant throughout the period and values in trees in the soil class even increased (i.e., allevia-tion of water stress) from 1998 onward. Standard errors of rescaledδ13C were generally higher in the post-harvest period than in the pre-harvest period, except for trees in the soil class, for which standard errors were higher at the beginning and end of the 1983–2003 period and lower in the interim (Figure 4B). Summer precipitation was variable in the study region throughout 1910–2003, with a long-term mean of 78.10 mm. Most abundant summer precipitation was in 1970, and the dri-est summer was in 1975 (Figure 5). During the period of growth andδ13C sampling (1983–2003), the forests received a maximum of almost 120 mm of precipitation per summer month in 1984; mean monthly summer precipitation was lower than average in 1987, 1989, 1999 and 2001, and lowest overall in 2002 (Figure 5). Mean monthly summer tempera-ture was above the long-term mean (13.65 °C) for almost the entire 1983–2003 period, except in 1984 and 1992. However, in the years following partial harvest, mean monthly summer temperatures were close to the long-term mean (Figure 5).
Climate–growth relationships were similar in trees in all disturbance classes (Figure 6). Both correlation and response function coefficients showed a similar pattern for current-year precipitation, although the positive correlation between July
precipitation and growth was significant only in the no distur-bance class (r = 0.48). August precipitation was negatively correlated with growth (r = –0.62) and had significant regres-sion parameters in the no disturbance and soil classes. This pattern was also evident in the other disturbance classes, but the coefficients were not significant. Prior fall and winter (No-vember and January) precipitation had a positive influence on growth of trees in the no disturbance class, but not in the other classes for which prior October precipitation had a negative in-fluence on growth (Figure 6A). Prior October temperature had a significant positive effect on growth of trees in all distur-bance classes, whereas June temperature was positively corre-lated with growth only in trees in the light and light + soil classes (r = 0.38 and 0.53, respectively) (Figure 6B).
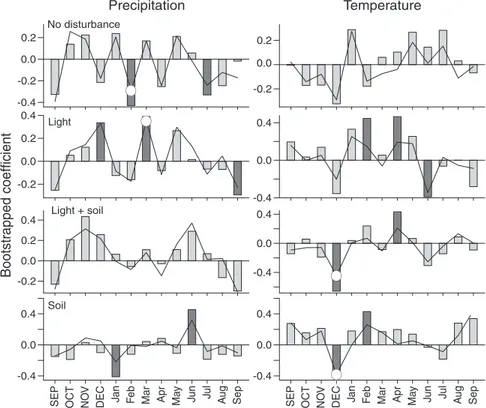
Climate–δ13C relationships were less obvious than the cli-mate–growth relationships. No clear pattern could be estab-lished for precipitation correlation or regression coefficients in the no disturbance class (Figure 7). Although we predicted that rescaledδ13C values would be consistently positively cor-related with any form of precipitation (i.e., precipitation would cause post-harvestδ13C to be lower and more negative than the pre-harvest mean), this was not necessarily the case. Although winter (December) and spring (March) precipitation was posi-tively correlated with rescaledδ13C in the light class (r = 0.34 and 0.39, respectively), and summer (June) precipitation was correlated withδ13C in the soil class (r = 0.45), no significant relationship was detected in the light + soil class (Figure 6A). Temperature was not correlated with rescaledδ13C in the no disturbance class. In the light + soil and soil classes, December temperatures were negatively correlated with rescaled δ13C
● ● ● ● ● ● ● ● ● ● ● ● ● ● ● ● ● ● ● ● ● 0.5 1.0 1.5 2.0 2.5 Rescaled R W I SE rescaled R W I ● ● ● ● ● ● ● ● ● ● ● ● ● ● ● ● ● ● ● ● ● ● 0.0 0.5 1.0 1.5 2.0 1985 1990 1995 2000 No disturbance Light Soil Light + soil FTC outbreak (1988) Harvest (1993)
Figure 3. (A) Mean rescaled ring-width indices (RWI) and (B) stan-dard errors of rescaled RWI for trees in the no disturbance class and in the light, soil and light + soil disturbance classes from 1983 to 2003. Horizontal lines are pooled (all classes) pre-harvest (1983–1993) val-ues. Note the negative effect of the forest tent caterpillar (FTC) out-break in 1988 on standardized RWI in trees in all disturbance classes.
● ● ● ● ● ● ● ● ● ● ● ● ● ● ● ● ● ● ● ● ● 0.94 0.98 0.96 1.02 1.00 1.04 FTC outbreak (1988) Harvest (1993) ● ● ● ● ● ● ● ● ● ● ● ● ● ● ● ● ● ● ● ● ● 0.00 0.02 0.04 0.06 1985 1990 1995 2000 SE rescaled 13 C Rescaled 13 C ● No dist. Light Soil Light + soil
Figure 4. Mean (A) rescaledδ13C and (B) standard errors ofδ13C for trees in the no disturbance class and in the light, soil and light + soil disturbance classes from 1983 to 2003. Horizontal lines are pooled means (all classes) of rescaled pre-harvest (1983–1993) values.
(r = –0.66 and –0.38, respectively) and had significant regres-sion parameters, whereas June temperatures were negatively correlated with rescaledδ13C in the light class (r = –0.39). In contrast, February temperature was positively correlated with rescaledδ13C in the light and soil classes (r = 0.45 and 0.43, re-spectively), whereas April temperature was positively corre-lated withδ13C in the light and light + soil classes (r = 0.46 and 0.43, respectively) (Figure 7B).
Multivariate analysis indicated that rescaled ring-width in-dices differed significantly between classes in 2000 (P = 0.0036), 2001 (P = 0.0324) and 2003 (P = 0.0302). Multiple comparisons based on permutation tests in these years were, after Tukey correction, significantly different only between
trees in the no disturbance and light classes, and only in 2003 (P = 0.0054). However, rescaled ring-width indices were sig-nificantly different between trees in the no disturbance and the light classes in 1991 and 1998 (both P = 0.0054), even though PERMANOVA did not indicate significant difference overall (Table 3). Rescaledδ13C values were not statistically different in any years from 1983 to 2003.
Contrasting pre-harvest (1983–1993) versus post-harvest (1994–2003) values of rescaled ring-width indices within dis-turbance classes showed statistically significant increases in growth rates in trees in the light (P < 0.001), light + soil (P < 0.001) and soil (P = 0.025) classes, but not in the no dis-turbance class (P = 0.228, Table 4). Rescaledδ13C decreased significantly in trees in the light (P < 0.001) and light + soil (P = 0.007) classes, but not in the no disturbance class (P = 0.299). Rescaledδ13C increased in trees in the soil class but these increases were not statistically significant (P = 0.377, Table 4).
Discussion
Our data support Hypotheses 1 and 2, which state, respec-tively, that undisturbed trees do not experience any changes in growth rates orδ13C, and that trees that experienced a sharp in-crease in irradiance but no soil disturbance have higher growth rates and less negative δ13C values following harvest. How-ever, our data did not support Hypothesis 3 that trees with soil disturbance experience increases in δ13C and decreases in growth rates. Hypothesis 4, that the light + soil class causes significant decreases in growth rates and significant increases inδ13C indicating water stress, was also refuted.
Growth and stable carbon isotope analyses following partial
Precipitation ● ● -0.2 0.4 0.4 ● ● Bootstr apped coefficient -0.4 -0.4 0.0 0.2 ● -0.2 SEP OCT NO V DEC Ja n Fe b Mar Apr Ma y Ju n Ju l Au g Sep ● ● ● ● Temperature -0.4 -0.4 -0.4 0.0 0.0 0.0 0.4 0.4 ●● -0.2 0.0 0.4 ●● -0.2 0.0 0.2 0.2 0.2 0.4 ● ●● 0.0 0.0 0.4 SEP OCT NO V DEC Ja n Fe b Mar Apr Ma y Ju n Ju l Au g Sep ● ● No disturbance Light Light + soil Soil
Figure 6. Correlation (bars) and response function (lines) analyses of rescaled ring-width indices and climate data. Monthly precipitation (left) and tempera-tures (right) from the previous (upper case) September to the current (lower case) September (1983–1994) were used to explain variances in rescaled ring-width indices of trees in the no disturbance class and in the light, soil and light + soil distur-bance classes. Significant correlation and response function coefficients (P < 0.05) are indicated with dark gray bars and white circles, respectively.
40 60 80 100 120 12 14 16 Precipitation (mm) T emper ature (°C ) Sampling period Harvest (1993) 1920 1940 1960 1980 2000
Figure 5. Mean monthly summer (April–August) precipitation and temperature from 1910 to 2003. Horizontal lines are long-term means across these years. Vertical lines indicate the start of growth andδ13C sampling (1983) and the year of partial harvest (1993).
harvest indicated no negative effects of harvest disturbance on growth rates or water status of the residual sugar maple trees. Rescaled growth indices increased after harvest in trees in all
but the no disturbance class (Figure 3, Table 4), whereas rescaledδ13C decreased only with sudden increases in light availability but increased slightly with soil disturbance five years after harvest (Figure 4, Table 4), indicating that none of the studied disturbances caused by partial harvest resulted in water stress in the residual sugar maple trees.
We are aware of the potential pitfalls associated with limited sample sizes in factorial analytical designs. Also, we acknowl-edge that SORTIE relies on a simplification of the complex canopy structure in uneven-aged deciduous forests. Similarly, our measure of soil disturbance was indirect and relied on sev-eral assumptions (e.g., negative impact of machine traffic on soil bulk density and tree root systems, uniform distribution root systems within influence zones) that are unavoidable in a retrospective study. However, we showed that soil compaction
Precipitation -0.4 0.0 0.2 ● ● No disturbance 0.0 0.2 0.4 ●● Bootstr apped coefficient 0.0 0.2 0.4 Light + soil -0.4 0.0 0.4 SEP OCT NO V DEC Ja n Fe b Mar Apr Ma y Ju n Ju l Au g Sep Soil Temperature -0.2 -0.2 -0.2 -0.2 0.0 0.2 -0.4 0.0 0.4 -0.4 0.0 0.4 ●● -0.4 0.0 0.4 SEP OCT NO V DEC Ja n Fe b Mar Apr Ma y Ju n Ju l Au g Sep ● ● ● ● Light
Figure 7. Correlation (bars) and response function (lines) analyses of rescaledδ13C and climate data. Monthly (A) precipita-tion and (B) temperature from prior (upper case) September to current (lower case) September (1983–1994) were used to ex-plain variances in rescaledδ13C of trees in the no disturbance class and in the light, soil and light + soil disturbance classes. Significant correlation and response func-tion coefficients (P < 0.05) are indicated with dark gray bars and white circles, re-spectively.
Table 3. Summary of PERMANOVA (degrees of freedom (df), sum of squares (SS), mean squares (MS)) for years with significant (P < 0.05) differences in rescaled ring-width indices among all disturbance classes (no disturbance and the light, soil and light + soil disturbance classes) and with significant (P < 0.0085) differences in pairwise comparisons between disturbance classes (only light class versus no disturbance class were significant). Tests were based on 4999 data permutations using Euclidean distances. Significant P-values for an-nual PERMANOVA (P < 0.05) and for multiple comparisons after Tukey correction (Pmc< 0.0085) are in bold.
Year df SS MS F P t Pmc 1991 3 0.4337 0.1446 2.3208 0.1112 2.6129 0.0054 Resid. 16 0.9967 0.0623 Total 19 1.4304 1998 3 3.2861 1.0954 1.4785 0.2254 3.4097 0.0054 Resid. 16 11.8539 0.7409 Total 19 15.14 2000 3 2.1691 0.723 6.7271 0.0036 3.3896 0.0128 Resid. 16 1.7197 0.1075 Total 19 3.8888 2001 3 1.5103 0.5034 3.1188 0.0324 3.0287 0.0128 Resid. 16 2.5827 0.1614 Total 19 4.0929 2003 3 2.7749 0.925 3.9047 0.0302 4.313 0.0054 Resid. 16 3.7901 0.2369 Total 19 6.565
Table 4. Paired t-tests of differences (post-harvest – pre-harvest) of rescaled ring-width indices and rescaled δ13C within disturbance classes. There were 49 degrees of freedom in all cases.
Disturbance class Difference t P
Rescaled ring-width indices
No disturbance –0.100 1.22 0.228 Light 0.482 –5.39 < 0.001 Light + soil 0.713 –4.67 < 0.001 Soil 0.220 –2.31 0.025 Rescaled 13C No disturbance –0.007 1.05 0.299 Light –0.028 4.52 < 0.001 Light + soil –0.019 2.77 0.007 Soil 0.006 –0.89 0.377
from machine traffic persisted for at least 11 years (Figure 1). In addition, our results on growth responses to harvest distur-bances corroborated the findings of Hartmann and Messier (2008), who analyzed the impact of insect defoliation and har-vest disturbances on radial growth and survival probabilities of residual sugar maple trees. Hartmann and Messier (2008), who used the same disturbance measures but larger samples sizes per disturbance class compared with our study, found that har-vest disturbances had either no effect (soil disturbance) or a positive effect (sudden exposure to higher irradiances) on growth compared with trees in the no disturbance class (Hartmann and Messier 2008). Their observed increases in growth in response to higher irradiances corroborate our method of estimating light availability with SORTIE.
In our study, harvest disturbances had little influence on the climate–growth relationships, except that the positive correla-tion of precipitacorrela-tion in the previous November and the previ-ous January with growth vanished in all trees affected by har-vest disturbance. However, precipitation in the previous Octo-ber was significantly negatively correlated with growth in trees in all but the no disturbance class (Figure 6). The positive correlation of current January precipitation with growth may by linked to increased protection of fine roots against freezing damage by deeper snow cover (Tierney et al. 2001), but the reason for the shift in correlation from precipitation in the pre-vious October and the prepre-vious November to current January precipitation remains unclear. Several other studies on cli-mate–growth relationship of sugar maple either failed to detect these correlations (e.g., Ryan et al. 1994, Yin et al. 1994, He et al. 2005) or were not designed to explain these causal relation-ships (Goldblum and Rigg 2005). The absence of a correlation between summer precipitation and growth rates may be asso-ciated with the humid climate at our research area where varia-tions in summer precipitation explain little of the variation in growth rates.
The positive correlation of temperature during the previous October with growth indices may be linked to freezing dam-age. Yin et al. (1994) used regression analysis to identify a threshold temperature of 6.4 °C during the previous October on sugar maple growth indices. They argued that temperatures below 6.4 °C may expose trees to frost damage, whereas tem-peratures above this value may result in high maintenance res-piration (Yin et al. 1994) and that both high and low tempera-tures may reduce the amount of carbon reserves for growth in the upcoming spring (Wong et al. 2003).
In our study, current June temperature was positively corre-lated with growth indices in the light and light + soil classes (Figure 6), and seemed to be indicative of favorable growth conditions. Trees with increased crown exposure as a result of partial harvest (light and light + soil classes) had increased growth rates, which was not the case for trees that experienced no change in crown exposure (no disturbance and soil classes). Althoughδ13C variations have been shown to be correlated with climate variables, such as air temperature and precipita-tion (e.g., Mazany et al. 1980, Saurer et al. 1995, Robertson et al. 1997, Hemming et al. 1998) and radiation (e.g., Smith et al. 1976, Leavitt and Long 1986, Geßler et al. 2001, Jäggi et al.
2002), we found no consistent and intuitive climate–δ13C rela-tionship in our data. Summer precipitation had no strong nega-tive effect onδ13C in our study, even in trees subjected to in-creased light availability (light and light + soil classes) or in trees subjected to assumed reductions in water availability and uptake (soil class).
McDowell et al. (2003) observed that carbon isotope dis-crimination increased in Pinus ponderosa (C. Lawson) follow-ing stand thinnfollow-ing as a result of increases in water availability, with maximum discrimination occurring 6 years after thin-ning. It is possible that post-harvest decreases in rescaled sugar mapleδ13C in the light and light + soil classes were miti-gated by increases in water availability as a result of thinning, such that no differences between classes in individual years immediately after harvest were detected. Also, Vesala et al. (2005) found little influence of thinning on transpiration in Scots pine (Pinus sylvestris L.). Abundant growing season precipitation and moderate summer temperatures in the imme-diate post-harvest period (1994–1996) could have intensified this effect and may have contributed to further mitigatingδ13C responses to disturbance following the partial harvest.
The absence of a response inδ13C to soil disturbance may be explained by an interplay of root turnover and favorable growth conditions. Fine root turnover in northern hardwoods is estimated to be about 8 months in the uppermost soil layer (< 30 cm) and 5.5 months in deeper soil horizons (> 30 cm, Hendrick and Pregitzer 1992). Given the stimulating effect of root pruning on root growth (Geisler and Feree 1984, Hipps et al. 1999), potential root damage from machinery traffic may have accelerated the replacement of damaged roots. Abundant precipitation during the post-harvest period and rapid root re-placement following disturbance may have mitigated water deficits of trees subjected to soil disturbance, thereby prevent-ing substantial increases inδ13C (i.e., significant decreases in rescaledδ13C).
Neverthless. despite abundant summer precipitation in 1988 (Figure 5),δ13C increased (Figure 2). The forest tent caterpil-lar outbreak reached its climax in 1988 and reallocation of re-serves for refoliation of defoliated crowns may have caused this increase. Starch reserves stored in woody tissue during winter are enriched in 13C compared with other metabolites such as sucrose and hexoses, and their mobilization during heterotrophic leaf development in spring causes increases in stem woodδ13C (Helle and Schleser 2004). Refoliation fol-lowing herbivory should have the same effect onδ13C.
In conclusion, our results indicated that the redistribution of resources for individual trees following partial harvest was balanced, i.e., increases in water availability through thinning outweighed increased water demands associated with in-creased light interception. This redistribution of resources may have counteracted potential decreases in water availabil-ity and uptake caused by soil compaction and root damage, re-spectively, and prevented the development of water deficits in affected trees. In addition, mean growing season precipitation and temperature were favorable for growth for at least 3 years following partial harvest in the studied stands (Figure 5). Ef-fects of harvest disturbances on the climate–growth
relation-ship could be different if climatic conditions in the first few years following harvest were less favorable, causing the redis-tribution of resources resulting from the partial harvest to be-come imbalanced.
Acknowledgments
We thank Catherine Malo for help during fieldwork, and Petra Linke and Willy Brandt from the Max-Planck-Institute for Biogeochemisty in Jena for technical advice and seemingly unlimited support during wood sample preparation and carbon isotope analysis. We are thank-ful for statistical advice from Stéphane Daigle and for the linguistic improvement of the manuscript by Bill Parsons, both of whom are members of the Centre for Forest Research.
References
Anderson, M.J. 2001. A new method for non-parametric multivariate analysis of variance. Austral Ecol. 26:32–46.
Anderson, M.J. 2005. PERMANOVA: a FORTRAN computer pro-gram for permutational multivariate analysis of variance. Depart-ment of Statistics, University of Auckland, New Zealand, 24 p. Beaudet, M., C. Messier and C.D. Canham. 2002. Predictions of
understorey light conditions in northern hardwood forests follow-ing parameterization, sensitivity analysis, and tests of the SORTIE light model. For. Ecol. Manage. 165:235–248.
Berninger, F., E. Sonninen, T. Aalto and J. Lloyd. 2000. Modeling13C discrimination in tree rings. Global Biogeochem. Cycles 14: 213–223.
Biondi, F. and K. Waikul. 2004. DENDROCLIM2002: A C++ pro-gram for statistical calibration of climate signals in tree-ring chro-nologies. Comput. Geosci. 30:303–311.
Bodner, J. 1984. Effect of thinning and fertilization on wood proper-ties and intra-ring characteristics in young Douglas-fir. Holzforsch. Holzverwert. 36:5–11.
Bowling, D.R., N.G. McDowell, B.J. Bond, B.E. Law and J.R. Ehleringer. 2002. 13C content of ecosystem respiration is linked to precipitation and vapor pressure deficit. Oecologia 131: 113–124.
Bowling, D.R., D.E. Pataki and J.R. Ehleringer. 2003. Critical evalua-tion of micrometeorological methods for measuring ecosystem at-mosphere isotopic exchange of CO2. Agric. For. Meteorol. 116: 159–179.
Bréda, N., A. Granier and G. Aussenac. 1995. Effects of thinning on soil and tree water relations, transpiration and growth in an oak for-est (Quercus petraea (Matt.) Liebl.). Tree Physiol. 15:295–306. Bunn, A. 2007. The dplR package. Version 1.1.2. Contributed R
package. Available online: http://cran.r-project.org/bin/windows/ contrib/r-release/dplR_1.1.2.zip.
Canham, C.D. 1988. Growth and canopy architecture of shade-toler-ant trees: response to canopy gaps. Ecology 69:786–793. Canham, C.D., A.C. Finzi, S.W. Pacala and D.H. Burbank. 1994.
Causes and consequences of resource heterogeneity in forests: interspecific variation in light transmission by canopy trees. Can. J. For. Res. 24:337–349.
Deutschman, D.H., S.A. Levin, C. Devine and L.A. Buttel. 1997. Scaling from trees to forests: analysis of a complex simulation model. Science Online: http://www.sciencemag.org/feature/data/ deutschman/index.htm.
Drew, T.J. and J.W. Flewelling. 1979. Stand density management: an alternative approach and its application to Douglas-fir plantations. For. Sci. 25:518–532.
Fessenden, J.E. and J.R. Ehleringer. 2003. Temporal variation inδ13C of ecosystem respiration in the Pacific Northwest: links to moisture stress. Oecologia 136:129–136.
Francey, R.J. and G.D. Farquhar. 1982. An explanation of13C/12C variations in tree rings. Nature 297:28–31.
Freyer, H.D. 1979. On the13C record in tree rings. Part I. Variations in northern hemispheric trees during the last 150 years. Tellus 31: 124–137.
Geisler, D. and D.C. Feree. 1984. Response of plants to root pruning. Hortic. Rev. 6:155–188.
Geßler, A., S. Schrempp, A. Matzarakis, H. Mayer, H. Rennenberg and M.A. Adams. 2001. Radiation modifies the effect of water availability on the carbon isotope composition of beech (Fagus sylvatica). New Phytol. 150:653–664.
Goldblum, D. and L.S. Rigg. 2005. Tree growth response to climate change at the deciduous/boreal forest ecotone, Ontario, Canada. Can. J. For. Res. 35:2709–2718.
Gosselin, J., P. Grondin and J.-P. Saucier. 2000. Programme de connaissance des écosystèmes forestiers du Québec méridional. Rapport de classification écologique: érablière à bouleau jaune de l’ouest. Ministère des Ressources naturelles, de la Faune et des Parcs, Quebec City, Canada, 186 p. [RN99-3065].
Grissino-Mayer, H.D. 2001. Evaluating crossdating accuracy: a man-ual and tutorial for the computer program COFECHA. Tree-Ring Res. 57:205–221.
Hartmann, H. and C. Messier. 2008. The role of forest tent caterpillar defoliations and partial harvest in the decline and death of sugar maple. Ann. Bot.102:377–387.
He, J.S., Q.-B. Zhang and F.A. Bazzaz. 2005. Differential drought re-sponses between saplings and adult trees in four co-occurring spe-cies of New England. Trees 19:442–450.
Helle, G. and G.H. Schleser. 2004. Beyond CO2-fixation by Rubisco—an interpretation of13C/12C variations in tree rings from novel intra-seasonal studies on broad-leaf trees. Plant Cell Environ. 27:367–380.
Hemming, D.L., V.R Switsur, J.S. Waterhouse, T.H.E. Heaton and A.H.C. Carter. 1998. Climate variation and the stable carbon iso-tope composition of tree ring cellulose: an intercomparison of Quercus robur, Fagus sylvatica and Pinus silvestris. Tellus 50B: 25–33.
Hendrick, R.L. and K.S. Pregitzer. 1992. The demography of fine roots in a northern hardwood forest. Ecology 73:1094–1104. Hipps, N.A., K.H. Higgs and L.G. Collard. 1999. Effects of root
wrenching on the growth and water relations of Prunus avium and Castanea sativa seedlings in nursery beds and after outplanting. Can. J. For. Res. 29:696–704.
Holmes, R.L. 1983. Computer assisted quality control in tree-ring dating and measurement. Tree-Ring Bull. 43:69–78.
Jäggi, M., M. Saurer, J. Fuhrer and R. Siegwolf. 2002. The relation-ship between the stable carbon isotope composition of needle bulk material, starch, and tree rings in Picea abies. Oecologia 131: 325–332.
Jones, T.A. and S.C. Thomas. 2004. The time course of diameter in-crement responses to selection harvest in Acer saccharum. Can. J. For. Res. 34:1525–1533.
Jones, T.A. and S.C. Thomas. 2007. Leaf-level acclimation to gap cre-ation in mature Acer saccharum trees. Tree Physiol. 27:281–290. Kienholz, R. 1930. The wood structure of a “pistol-butted” mountain
hemlock. Am. J. Bot. 17:739–764.
Kneeshaw, D.D., H. Williams, E. Nikinmaa and C. Messier. 2002. Patterns of above- and below-ground response of understory coni-fer release 6 years after partial cutting. Can. J. For. Res. 32: 255–265.
Kozlowski, T.T. 1999. Soil compaction and growth of woody plants. Scan. J. For. Res. 14:596–619.
Leavitt, S.W. and A. Long. 1986. Stable-carbon isotope variability in tree foliage and wood. Ecology 67:1002–1010.
Lefrançois, M.-L., M. Beaudet and C. Messier. 2008. Crown open-ness as influenced by tree and site characteristics for yellow birch, sugar maple and eastern hemlock. Can. J. For. Res. 38:488–497. Lipp, J., P. Trimborn, P. Fritz, H. Moser, B. Becker and B. Frenzel.
1991. Stable isotopes in tree ring cellulose and climatic change. Tellus 43B:322–330.
Loader, N.J., I. Robertson, A.C. Barker, V.R. Switsur and J.S. Water-house. 1997. An improved technique for the batch processing of small wholewood samples to α-cellulose. Chem. Geol. 136: 313–317.
Loader, N.J., I. Robertson and D. McCarroll. 2003. Comparison of stable carbon isotope ratios in the wholewood, cellulose and lignin of oak tree-rings. Palaeogeogr. Palaeoclimatol. 196:395–407. Mazany, T., J.C. Lerman and A. Long. 1980. Carbon-13 in tree-ring
cellulose as an indicator of past climates. Nature 287:432–435. McArdle, B.H. and M.J. Anderson. 2001. Fitting multivariate models
to community data: a comment on distance-based redundancy anal-ysis. Ecology 82:290–297.
McCarroll, D. and N.J. Loader. 2004. Stable isotopes in tree rings. Quat. Sci. Rev. 23:771–801.
McDowell, N.G., J.R. Brooks, S.A. Fitzgerald and B.J. Bond. 2003. Carbon isotope discrimination and growth response of old Pinus ponderosa trees to stand density reductions. Plant Cell Environ. 26:631–644.
MRNFP. 2003. Méthodes d’échantillonnage pour les inventaires d’intervention (inventaire avant traitement) et pour les suivis des interventions forestières (après martelage, après coupe et années antérieures). Ministère des Ressources naturelles, de la Faune et des Parcs, Quebec City, Canada, 283 p.
Ouimet, R., S. Guay and P. Lang. 2005. Evaluation de la distance minimale à respecter entre une tranchée et les arbres pour éviter la perte de vigueur des érables dans les érablières. Note de recherche forestière No. 130, Ministère de Ressources naturelles, et de la Faune et des Parcs, Quebec City, Canada, 12 p.
Peterson, D.W. and D.L. Peterson. 1995. Climatic influences on radial growth of subalpine larch in the North Cascade Mountains. In Ecology and Management of Larix Forests: A Look Ahead. Eds. W.C. Schmidt and K.J. McDonald. USDA Forest Service, GTR-INT-319, Ogden, UT, pp 268–271.
Poulin, J. and C. Messier. 2007. Rapport de paramétrisation du modèle de simulation de la dynamique forestière SORTIE-ND pour la forêt boréale et sub-boréale de l’ouest du Québec. Available online: http://www.cef-cfr.ca/uploads/CEF/parametrisation.pdf. Robertson, I., J. Rolfe, V.R. Switsur, A.H.C. Carter, M.A. Hall,
A.C. Barker and J.S. Waterhouse. 1997. Signal strength and cli-mate relationships in13C/12C ratios of tree ring cellulose from oak in east England. J. Geophys. Res. 102:19,507–19,516.
Robitaille, A. and J.-P. Saucier 1998. Paysages régionaux du Québec méridional. Les Publications du Québec, Sainte-Foy, QC, Canada, 213 p.
Rönnberg, J. 2000. Logging operations damage to roots of clear-felled Picea abies and subsequent spore infection by Heterobasi-dion annosum. Silva Fenn. 34:29–36.
Ryan, D.A.J., O.B. Allen, D.L. McLaughlin and A.M. Gordon. 1994. Interpretation of sugar maple (Acer saccharum) ring chronologies from central and southern Ontario using a mixed linear model. Can. J. For. Res. 24:568–575.
Saurer, M., U. Siegenthaler and F. Schweingruber. 1995. The cli-mate-carbon isotope relationship in tree rings and the significance of site conditions. Tellus 47B:320–330.
Saurer, M., S. Borella, F. Schweingruber and R. Siegwolf. 1997. Sta-ble carbon isotopes in tree rings of beech: climatic versus site-re-lated influences. Trees 11:291–297.
Scheidegger, Y., M. Saurer, M. Bahn and R. Siegwolf. 2000. Linking stable oxygen and carbon isotopes with stomatal conductance and photosynthetic capacity: a conceptual model. Oecologia 125: 350–357.
Schulze, B., C. Wirth, P. Linke, W.A. Brand, I. Kuhlmann, V. Horna and E.-D. Schulze. 2004. Laser ablation-combustion-GC-IRMS— a new method for online analysis of intra-annual variation ofδ13C in tree rings. Tree Physiol. 24:1193–1201.
Sénécal, D., C. Messier and J. Poulin. 2003. Revue de littérature: principales causes de mortalité chez les arbres adultes et clé d’iden-tification des arbres morts ligneux. Report presented to Tembec, Inc. Groupe de recherche en écologie forestière interuniversitaire, Université du Québec à Montréal, QC, Canada.
Smith, B.N., J. Oliver and C. McMillan. 1976. Influence of carbon source, oxygen concentration, light intensity, and temperature on 13C/12C ratios in plant tissues. Bot. Gaz. 137:99–104.
Smith, D.M., B.C. Larson, M.J. Kelty and P.M.S. Ashton. 1997. The practice of silviculture: applied forest ecology. 9th Edn. John Wiley & Sons, New York, 560 p.
Sperry, J.S. 2000. Hydraulic constraints on plant gas exchange. Agric. For. Meteorol. 104:13–23.
Sperry, J.S., U.G. Hacke, R. Oren and J.P. Comstock. 2002. Water deficits and hydraulic limits to leaf water supply. Plant Cell Envi-ron. 25:251–263.
Startsev, A.D. and D.H. McNabb. 2001. Skidder traffic effects on wa-ter retention, pore-size distribution, and van Genuchten paramewa-ters of boreal forest soils. Soil Sci. Soc. Am. J. 65:224–231. Stoneman, G.L., D.S. Crombie, K. Whitford, F.J. Hingston, R. Giles,
C.C. Portlock, J.H. Galbraith and G.M. Dimmock. 1997. Growth and water relations of Eucalyptus marginata (jarrah) stands in re-sponse to thinning and fertilization. Tree Physiol. 17:267–274. Tardif, J., J. Brisson and Y. Bergeron. 2001. Dendroclimatic analysis
of Acer saccharum, Fagus grandifolia, and Tsuga canadensis from an old-growth forest, southwestern Quebec. Can. J. For. Res. 31: 1491–1501.
Taylor, H.M. and G.S. Brar. 1991. Effects of soil compaction on root development. Soil Till. Res. 19:111–119.
Tierney, G.L., T.J. Fahey, P.M. Groffman, J.P. Hardy, R.D. Fitzhugh and C.T. Driscoll. 2001. Soil freezing alters fine root dynamics in a northern hardwood forest. Biogeochemistry 56:175–190. Tubbs, C.H. 1977. Root–crown relations of young sugar maple and
yellow birch. USDA Forest Service, Research Note, NC-225, St. Paul, MN, 4 p.
Vesala, T., T. Suni, Ü. Rannik. et al. 2005. Effect of thinning on sur-face fluxes in a boreal forest. Global Biogeochem. Cycles 19: GB2001, doi:10.1029/2004GB002316.
Wong, B.L., K.L. Baggett and A.H. Rye. 2003. Seasonal patterns of reserve and soluble carbohydrates in mature sugar maple (Acer saccharum). Can. J. Bot. 81:780–788.
Wyckoff, P.H. and J.S. Clark. 2005. Tree growth prediction using size and exposed crown area. Can. J. For. Res. 35:13–20.
Yin, X., N.W. Foster, I.K. Morrison and P.A. Arp. 1994. Tree-ring based growth analysis for a sugar maple stand: relations to local cli-mate and transient soil properties. Can. J. For. Res. 24:1567–1574.