HAL Id: hal-03162430
https://hal.inrae.fr/hal-03162430v2
Submitted on 8 Apr 2021
HAL is a multi-disciplinary open access
archive for the deposit and dissemination of
sci-entific research documents, whether they are
pub-lished or not. The documents may come from
teaching and research institutions in France or
abroad, or from public or private research centers.
L’archive ouverte pluridisciplinaire HAL, est
destinée au dépôt et à la diffusion de documents
scientifiques de niveau recherche, publiés ou non,
émanant des établissements d’enseignement et de
recherche français ou étrangers, des laboratoires
publics ou privés.
forestatrisk: a Python package for modelling and
forecasting deforestation in the tropics
Ghislain Vieilledent
To cite this version:
Ghislain Vieilledent. forestatrisk: a Python package for modelling and forecasting deforestation in the
tropics. Journal of Open Source Software, Open Journals, 2021, 6 (59), pp.2975. �10.21105/joss.02975�.
�hal-03162430v2�
forestatrisk: a Python package for modelling and
forecasting deforestation in the tropics
Ghislain Vieilledent
1, 2, 3, 41 CIRAD, UMR AMAP, F–34398 Montpellier, France 2 CIRAD, Forêts et Sociétés, F–34398
Montpellier, France. 3 AMAP, Univ Montpellier, CIRAD, CNRS, INRAE, IRD, Montpellier, France.
4 European Commission, Joint Research Centre (JRC), I–21027 Ispra (VA), Italy. DOI:10.21105/joss.02975
Software
• Review
• Repository
• Archive
Editor: Katy Barnhart
Reviewers: • @molgor • @ethanwhite Submitted: 10 December 2020 Published: 02 March 2021 License
Authors of papers retain copyright and release the work under a Creative Commons Attribution 4.0 International License (CC BY 4.0).
Summary
The forestatrisk Python package can be used to model the spatial probability of deforesta-tion and predict future forest cover in the tropics. The spatial data used to model deforestadeforesta-tion come from georeferenced raster files, which can be very large (several gigabytes). The func-tions available in the forestatrisk package process large rasters by blocks of data, making calculations fast and efficient. This allows deforestation to be modeled over large geographic areas (e.g., at the scale of a country) and at high spatial resolution (e.g., ≤ 30 m). The
forestatrisk package offers the possibility of using logistic regression with auto-correlated spatial random effects to model the deforestation process. The spatial random effects make possible to structure the residual spatial variability of the deforestation process, not explained by the variables of the model and often very large. In addition to these new features, the forestatrisk Python package is open source (GPLv3 license), cross-platform, scriptable (via Python), user-friendly (functions provided with full documentation and examples), and easily extendable (with additional statistical models for example). The forestatrisk Python package has been used to model deforestation and predict future forest cover by 2100 across the humid tropics.
Statement of Need
Commonly called the “Jewels of the Earth,” tropical forests shelter 30 million species of plants and animals representing half of the Earth’s wildlife and at least two-thirds of its plant species (Gibson et al., 2011). Through photosynthesis and carbon sequestration, tropical forests play an important role in the global carbon cycle, and in regulating the global climate (Baccini et al., 2017). Despite the many ecosystem services they provide, tropical forests are disappearing at an alarming rate (Keenan et al., 2015;Vancutsem et al., 2020), mostly because of human activities. Currently, around 8 Mha (twice the size of Switzerland) of tropical forest are disappearing each year (Keenan et al., 2015). Spatial modelling of deforestation allows identifying the main factors that determine the spatial risk of deforestation and quantifying their relative effects. Forecasting forest cover change is paramount as it allows anticipating the consequences of deforestation (in terms of carbon emissions or biodiversity loss) under various technological, political, and socioeconomic scenarios, and informs decision makers accordingly (Clark et al., 2001). Because both biodiversity and carbon vary greatly in space (Allnutt et al., 2008;Baccini et al., 2017), it is necessary to provide spatial forecasts of forest cover change to properly quantify biodiversity loss and carbon emissions associated with future deforestation. The forestatrisk Python package can be used to model tropical deforestation spatially, predict the spatial risk of deforestation, and forecast future forest cover in the tropics ( Fig-ure 1). Several other software tools allow modeling and forecasting of forest cover change
(Mas et al., 2014). The most famous land cover change software tools includeDinamica-EGO
(Soares-Filho et al., 2002),Land Change Modeller(Eastman & Toledano, 2017), andCLUE
(Verburg & Overmars, 2009). Despite the many functionalities they provide, these software tools are not open source and might not all be cross-platform, scriptable, and completely user-friendly. Moreover, the statistical approaches they propose to model land cover change do not take into account the residual spatial variability in the deforestation process that is not explained by the model’s variables, and which is often very large. The more sophisticated algo-rithms they use (genetic algoalgo-rithms, artificial neural networks, or machine learning algoalgo-rithms) might also have the tendency to over-fit the data (Mas et al., 2014). Finally, application of these software tools to large spatial scales (e.g., at the country or continental scale) with high resolution data (e.g., ≤ 30 m) has not yet been demonstrated (but see Soares-Filho et al., 2006 for a study in the Amazon at 1 km resolution). The forestatrisk Python package aims to fill some of these gaps and to enlarge the range of software available to model and forecast tropical deforestation.
Main functionalities
A set of functions for modelling and forecasting deforestation
The forestatrisk Python package includes functions to (i) compute the forest cover change raster and the rasters of explanatory variables for a given country from several global datasets (such as OpenStreetMap or the SRTM Digital Elevation Database v4.1 for example) (ii) effi-ciently sample forest cover change observations and retrieve information on spatial explanatory variables for each observation, (iii) estimate the parameters of various statistical deforestation models, (iv) predict the spatial probability of deforestation, (v) forecast the likely forest cover in the future, (vi) validate the models and the projected maps of forest cover change, (vii) estimate carbon emissions associated with future deforestation, and (viii) plot the results. The forestatrisk package includes a hierarchical Bayesian logistic regression model with auto-correlated spatial random effects, which is well suited for modeling deforestation (see below). Any statistical model class with a .predict() method can potentially be used together with the function forestatrisk.predict_raster() to predict the spatial risk of deforestation. This allows a wide variety of additional statistical models from other Python packages to be used, such as scikit-learn (Pedregosa et al., 2011) for example, for deforestation modelling and forecasting.
Ability to process large raster data
Spatially-distributed forest cover change and explanatory variables are commonly available as georeferenced raster data. Raster data consist of rows and columns of cells (or pixels), with each cell storing a single value. The resolution of the raster dataset is its pixel width in ground units. Depending on the number of pixels (which is a function of the raster’s geographical extent and resolution), raster files might occupy a space of several gigabytes on disk. Processing such large rasters in memory can be prohibitively intensive. Functions in the forestatrisk package process large rasters by blocks of pixels representing subsets of the raster data. This makes computation efficient, with low memory usage. Reading and writing subsets of raster data is done by using two methods from the GDAL Python bindings (GDAL/OGR contributors, 2020): gdal.Dataset.ReadAsArray() and gdal.Band.WriteA rray(). Numerical computations on arrays are performed with the NumPy Python package, whose core is mostly made of optimized and compiled C code that runs quickly (Harris et al., 2020). This allows the forestatrisk Python package to model and forecast forest cover change on large spatial scales (e.g., at the country or continental scale) using high resolution data (e.g., ≤ 30 m), even on personal computers with average performance hardware. For
example, the forestatrisk Python package has been used on a personal computer to model and forecast the forest cover change at 30-m resolution for the Democratic Republic of the Congo (total area of 2,345 million km2), processing large raster files of 71,205× 70,280 cells
without issues.
Statistical model with autocorrelated spatial random effects
The forestatrisk Python package includes a function called .model_binomial_iCAR() to estimate the parameters of a logistic regression model including auto-correlated spatial random effects. The model considers the random variable yi which takes value 1 if a forest
pixel i is deforested in a given period of time, and 0 if it is not. The model assumes that
yi follows a Bernoulli distribution of parameter θi (Equation 1). θi represents the spatial
relative probability of deforestation for pixel i and is linked, through a logit function, to a linear combination of the explanatory variables Xiβ, where Xi is the vector of explanatory
variables for pixel i, and β is the vector of effects [β1, . . . , βn] associated with the n variables.
The model can include (or not) an intercept α. To account for the residual spatial variation in the deforestation process, the model includes additional random effects ρj(i) for the cells
of a spatial grid covering the study-area. The spatial grid resolution has to be chosen in order to have a reasonable balance between a good representation of the spatial variability and a limited number of parameters to estimate. Each observation i is associated with one spatial cell j(i). Random effects ρj are assumed to be spatially autocorrelated through an
intrinsic conditional autoregressive (iCAR) model (Besag et al., 1991). In an iCAR model, the random effect ρj associated with cell j depends on the values of the random effects ρj′
associated with neighboring cells j′. The variance of the spatial random effects ρj is denoted
by Vρ. The number of neighbouring cells for cell j (which might vary) is denoted by nj.
Spatial random effects ρj account for unmeasured or unmeasurable variables (Clark, 2005),
which explain a part of the residual spatial variation in the deforestation process that is not explained by the fixed (i.e., explanatory) variables (Xi). The parameter inference is done in a
hierarchical Bayesian framework. The .model_binomial_iCAR() function calls an adaptive Metropolis-within-Gibbs algorithm (Rosenthal, 2011) written in C for maximum computation speed. yi∼ Bernoulli(θi) logit(θi) = α + Xiβ + ρj(i) ρj(i)∼ N ormal( ∑ j′ ρj′/nj, Vρ/nj) (1)
Applications and perspectives
The Python package forestatrisk was recently used to model the spatial probability of deforestation and predict forest cover change by 2100 across the humid tropics (https: //forestatrisk.cirad.fr). Future developments of the package will focus on expanding docu-mentation, case studies, statistical models, and validation tools. We are convinced that the forestatrisk package could be of great help in obtaining estimates of carbon emissions and biodiversity loss under various scenarios of deforestation in the tropics. Such scenarios should help decision-makers take initiatives to tackle climate change and the biodiversity cri-sis. The results from the forestatrisk package could contribute to future IPCC and IPBES reports (IPBES, 2019;IPCC, 2014), or help implement the REDD+ mechanism of the Paris Agreement.
Figures
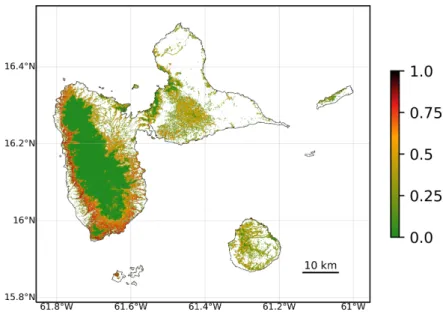
Figure 1: Map of the spatial probability of deforestation in the Guadeloupe archipelago. This
map was produced with the forestatrisk Python package. Colored pixels represent the extent of the natural old-growth tropical moist forest in 2020. The original map has a 30-m resolution. A relative spatial probability of deforestation was computed for each forest pixel. Probability of deforestation is a function of several explanatory variables describing: topography (altitude and slope), accessibility (distances to nearest road, town, and river), forest landscape (distance to forest edge), deforestation history (distance to past deforestation), and land conservation status (presence of a protected area). This map can be reproduced with the /Get started/ tutorial at https://ecology. ghislainv.fr/forestatrisk.
Acknowledgements
I am grateful to Clovis Grinand, Romuald Vaudry, and Matthieu Tiberghien who gave me the opportunity to work on deforestation modeling when we were leading forest conserva-tion projects in Madagascar. I also warmly thank Frédéric Achard and all the members of the IFORCE group for their invaluable support during the first phase of development of the package, while I was seconded to the JRC in Ispra. I would also like to thank Chris Garrard for writing the book “Geoprocessing with Python” (Garrard, 2016), which has been of great help in the development of the forestatrisk package. This work benefited from fund-ing by FRB-FFEM (BioSceneMada project, AAP-SCEN-2013 I), the European Commission (Roadless Forest project), and CNRT (RELIQUES project).
References
Allnutt, T. F., Ferrier, S., Manion, G., Powell, G. V. N., Ricketts, T. H., Fisher, B. L., Harper, G. J., Irwin, M. E., Kremen, C., Labat, J.-N., Lees, D. C., Pearce, T. A., & Rakotondrainibe, F. (2008). A method for quantifying biodiversity loss and its application to a 50-year record of deforestation across Madagascar. Conservation Letters, 1(4), 173– 181. https://doi.org/10.1111/j.1755-263X.2008.00027.x
Baccini, A., Walker, W., Carvalho, L., Farina, M., Sulla-Menashe, D., & Houghton, R. A. (2017). Tropical forests are a net carbon source based on aboveground measurements of
gain and loss. Science, 358(6360), 230–234. https://doi.org/10.1126/science.aam5962
Besag, J., York, J., & Mollié, A. (1991). Bayesian image restoration, with two applications in spatial statistics. Annals of the Institute of Statistical Mathematics, 43(1), 1–20.
https://doi.org/10.1007/bf00116466
Clark, J. S. (2005). Why environmental scientists are becoming Bayesians. Ecology Letters,
8(1), 2–14. https://doi.org/10.1111/j.1461-0248.2004.00702.x
Clark, J. S., Carpenter, S. R., Barber, M., Collins, S., Dobson, A., Foley, J. A., Lodge, D. M., Pascual, M., Pielke, R., Pizer, W., Pringle, C., Reid, W. V., Rose, K. A., Sala, O., Schlesinger, W. H., Wall, D. H., & Wear, D. (2001). Ecological forecasts: An emerging imperative. Science, 293(5530), 657–660. https://doi.org/10.1126/science.293.5530.657
Eastman, J. R., & Toledano, J. (2017). A short presentation of the Land Change Mod-eler (LCM). In Geomatic approaches for modeling land change scenarios (pp. 499–505). Springer International Publishing. https://doi.org/10.1007/978-3-319-60801-3_36
Garrard, C. (2016). Geoprocessing with Python. Manning Publications. ISBN: 978-1617292149
GDAL/OGR contributors. (2020). GDAL/OGR geospatial data abstraction software library. Open Source Geospatial Foundation. https://gdal.org
Gibson, L., Lee, T. M., Koh, L. P., Brook, B. W., Gardner, T. A., Barlow, J., Peres, C. A., Bradshaw, C. J. A., Laurance, W. F., Lovejoy, T. E., & Sodhi, N. S. (2011). Primary forests are irreplaceable for sustaining tropical biodiversity. Nature, 478(7369), 378–381.
https://doi.org/10.1038/nature10425
Harris, C. R., Millman, K. J., Walt, S. J. van der, Gommers, R., Virtanen, P., Cournapeau, D., Wieser, E., Taylor, J., Berg, S., Smith, N. J., Kern, R., Picus, M., Hoyer, S., Kerkwijk, M. H. van, Brett, M., Haldane, A., Río, J. F. del, Wiebe, M., Peterson, P., … Oliphant, T. E. (2020). Array programming with NumPy. Nature, 585(7825), 357–362. https: //doi.org/10.1038/s41586-020-2649-2
IPBES. (2019). Summary for policymakers of the global assessment report on biodiversity
and ecosystem services. The Intergovernmental Platform on Biodiversity and Ecosystem Services, IPBES, Bonn, Germany. (summary for policy makers). IPBES Secretariat. https: //doi.org/10.5281/zenodo.3553579
IPCC. (2014). Climate Change 2014: Synthesis Report. Contribution of Working Groups I, II
and III to the Fifth Assessment Report of the Intergovernmental Panel on Climate Change
(R. K. Pachauri & L. A. Meyer, Eds.; pp. 3–87). The Intergovernmental Panel on Climate Change, IPCC.https://www.ipcc.ch/report/ar5/syr/
Keenan, R. J., Reams, G. A., Achard, F., Freitas, J. V. de, Grainger, A., & Lindquist, E. (2015). Dynamics of global forest area: Results from the FAO Global Forest Resources Assessment 2015. Forest Ecology and Management, 352, 9–20. https://doi.org/10.1016/ j.foreco.2015.06.014
Mas, J.-F., Kolb, M., Paegelow, M., Olmedo, M. T. C., & Houet, T. (2014). Inductive pattern-based land use/cover change models: A comparison of four software packages.
Environ-mental Modelling & Software, 51, 94–111. https://doi.org/10.1016/j.envsoft.2013.09.010
Pedregosa, F., Varoquaux, G., Gramfort, A., Michel, V., Thirion, B., Grisel, O., Blondel, M., Prettenhofer, P., Weiss, R., Dubourg, V., Vanderplas, J., Passos, A., Cournapeau, D., Brucher, M., Perrot, M., & Duchesnay, E. (2011). Scikit-learn: Machine learning in Python. Journal of Machine Learning Research, 12, 2825–2830. https://jmlr.org/papers/ v12/pedregosa11a.html
Rosenthal, J. S. (2011). Optimal proposal distributions and adaptive MCMC. In S. Brooks, A. Gelman, G. L. Jones, & X.-L. Meng (Eds.), Handbook of Markov Chain Monte Carlo. CRC Press. https://doi.org/10.1201/b10905-5
Soares-Filho, B. S., Cerqueira, G. C., & Pennachin, C. L. (2002). DINAMICA - a stochastic cellular automata model designed to simulate the landscape dynamics in an Amazonian colonization frontier. Ecological Modelling, 154(3), 217–235. https://doi.org/10.1016/ S0304-3800(02)00059-5
Soares-Filho, B. S., Nepstad, D. C., Curran, L. M., Cerqueira, G. C., Garcia, R. A., Ramos, C. A., Voll, E., McDonald, A., Lefebvre, P., & Schlesinger, P. (2006). Modelling conservation in the Amazon basin. Nature, 440(7083), 520–523. https://doi.org/10.1038/nature04389
Vancutsem, C., Achard, F., Pekel, J.-F., Vieilledent, G., Carboni, S., Simonetti, D., Gallego, J., Aragao, L., & Nasi, R. s. (2020). Long-term (1990-2019) monitoring of tropical moist forests dynamics. bioRxiv. https://doi.org/10.1101/2020.09.17.295774
Verburg, P. H., & Overmars, K. P. (2009). Combining top-down and bottom-up dynamics in land use modeling: Exploring the future of abandoned farmlands in Europe with the Dyna-CLUE model. Landscape Ecology, 24(9), 1167–1181. https://doi.org/10.1007/ s10980-009-9355-7