4230 years of sedimentary processes at high resolution : The varved lacustrine
sediment from Cape Bounty, Melville Island, Canadian High Arctic.
François Lapointe, Pierre Francus. (INRS-ETE)
Geographical localiza.on
74º54’ N, 109º35’ W
Introduc.on
This project is part of the CBAWO that started to monitor the watershed and the two twin
lakes at Cape Bounty since 2003. Annually laminated sediments (varves) are especially
useful for precise chronological control of sedimentary and paleoenvironmental analyses.
A 737-‐cm long sediment core from East Lake (Figure 1) was retrieved in 2006. The main
objec.ve of this project is to obtain a grain size distribu.on for each varve and some
sedimentary indices. As Cape Bounty is located in an arid area, lamina.ons are thin (scale
ranging from millimeter to rarely cen.meter). To gather informa.on within each varve, we
use an image analysis soVware, developed at INRS, to store thin sec.ons images, get
measurements of varve thickness and ul.mately acquire images at the Scanning Electron
Microscope (SEM). Here, we present the methods used to obtain varve thickness and
par.cle size data for each varve year.
1598
1601
Figure 1
. Cape Bounty and a view of the IKONOS image of East Lake h^p://geog.queensu.ca/cbawo/pics/facili.es/Cape-‐Bounty_IKONOS_web.jpg.Figure 2 shows a part of a thin section scanned at 2400 dpi using a flat bed scanner with natural light (a) and cross-polarized light (b). The latter one is useful to distinguish the clay cap from the coarser grains (silts and sands) which appear brighter. The software calculates varve thickness automatically. In total, around 4230 varves were counted as seen in Figure 2 c.
Figure 3 illustrates the Regions Of Interest (ROI) selected and the images of 2 ROIs acquired at the Scanning Electron Microscope (SEM). These backsca^ered electron images (BSEI) (d and e) highlight silts and sands (>2 μm) whereas the matrix appears darker because of the low atomic weight of the epoxy resin. Around 6300 images acquired at the SEM were needed to cover the whole varved sedimentary sequence. Figure 4 shows the histogram of the gray scale values of the image (e). Once a gray scale value is chosen, the image is transformed in a binary image (f) where 1 pixel equals 1 μm. The clay matrix is hence removed. This is done for each ROI to get grain size of varves.
d
e
f
Figure 2.
a
b
Figure 3.
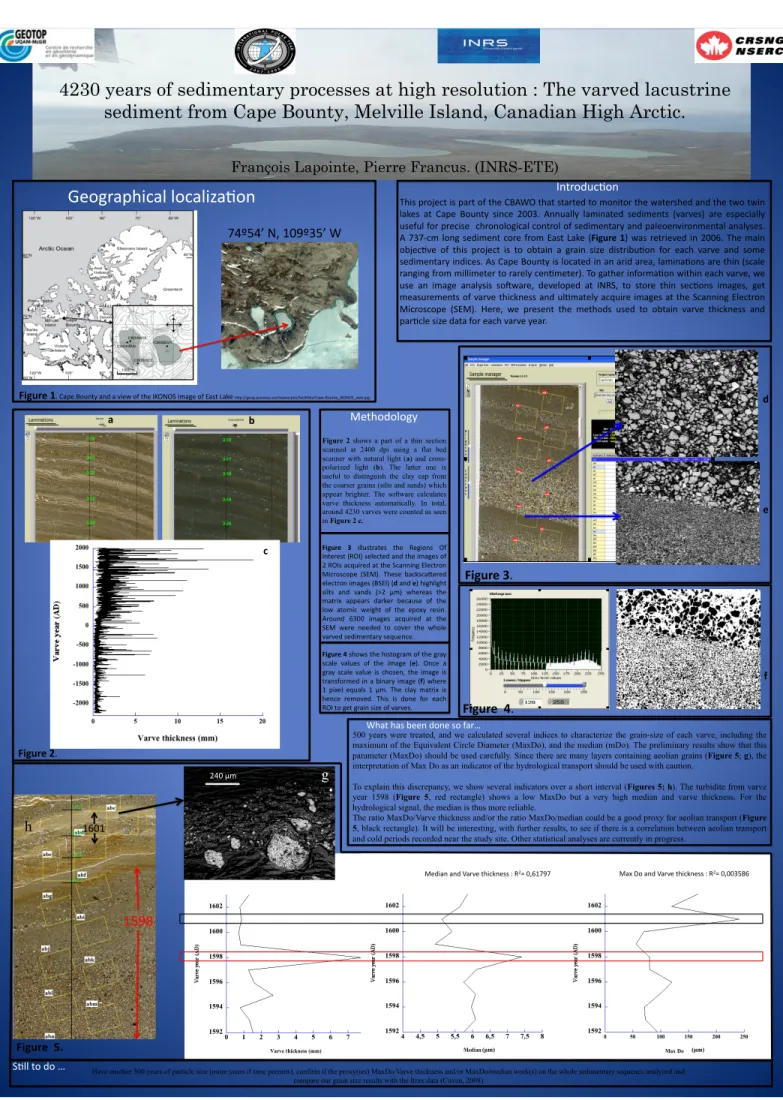
500 years were treated, and we calculated several indices to characterize the grain-size of each varve, including the maximum of the Equivalent Circle Diameter (MaxDo), and the median (mDo). The preliminary results show that this parameter (MaxDo) should be used carefully. Since there are many layers containing aeolian grains (Figure 5; g), the interpretation of Max Do as an indicator of the hydrological transport should be used with caution.
To explain this discrepancy, we show several indicators over a short interval (Figures 5; h). The turbidite from varve year 1598 (Figure 5, red rectangle) shows a low MaxDo but a very high median and varve thickness. For the hydrological signal, the median is thus more reliable.
The ratio MaxDo/Varve thickness and/or the ratio MaxDo/median could be a good proxy for aeolian transport (Figure 5, black rectangle). It will be interesting, with further results, to see if there is a correlation between aeolian transport and cold periods recorded near the study site. Other statistical analyses are currently in progress.
Figure 5.
Methodology
What has been done so far…
(µm) (µm)
240 μm
Max Do and Varve thickness : R2= 0,003586
Median and Varve thickness : R2= 0,61797